1805
Refining selectivity of XTC saturation pulse parameters through spectroscopic analysis1University of Pennsylvania, Philadelphia, PA, United States
Synopsis
In Xenon Polarization Transfer Constant (XTC) imaging, saturation pulses are applied at DP Xe frequencies for red blood cell (RBC) and tissue plasma (TP), but, due to their high power, are not perfectly selective, often depolarizing both DP frequencies instead of only the one intended. We used XTC spectroscopy to explore how various saturation pulse parameters, primarily pulse power, affects saturation selectivity. The generated graphs plot depolarization as a function of saturation frequency. They demonstrate that as pulse power increases, the contribution of gas-phase depolarization due to off-resonance saturation increases, compromising selectivity.
Introduction
Xenon-polarization Transfer Contrast (XTC) imaging is a hyperpolarized Xe-129 MRI (HXe) technique that can be used to quantify exchange between gas- (GP) and dissolved-phase (DP) Xe. In XTC imaging, saturation pulses are applied at DP Xe frequencies for red blood cell (RBC) and tissue plasma (TP), and subsequent GP depolarization is measured. Due to their high power, however, these saturation pulses are not perfectly selective, often depolarizing both DP frequencies instead of only the one intended. Consequently, the depolarization measured at GP may result from exchange with both dissolved compartments, rather than only that targeted by the saturation pulse. Here, we used XTC spectroscopy to explore various pulse parameters, varying both flip angle and duration to study their effects on DP saturation selectivity.Methods
Spectra were obtained in 4 healthy Sprague-Dawley rats ventilated with a mixture of 70% hyperpolarized xenon / 30% oxygen. Natural-abundance 129Xe gas was polarized (approximately 40%) using a prototype commercial optical pumping system (Xemed, NH) and dispensed into 1.25 L Tedlar bags within pressurizable chambers. All imaging was performed on a horizontal-bore 3T scanner (Bruker Inc, MA), and all studies were approved by the Penn Institutional Animal Care and Use Committee. Upon placement inside the magnet, rats were ventilated with 70% N2 and 30% O2 at 53 breaths per minute (bpm). N2 was switched to Xe for imaging. A global NSPECT sequence was first applied over a breath-hold to identify the chemical shifts, in Hz, for the peaks of interest: RBC (213 ppm), and TP (199 ppm), and the distance between them, Δ.After two wash-in breaths, a customized NSPECT sequence was applied during a short breath-hold at end-exhale—containing an RF pulse applied and read-out at the GP resonance (block pulse, FA = 15, BW = 10 kHz), a saturation pulse subsequently applied at the dissolved phase frequency of interest, fD, and, finally, a second RF pulse applied and read-out at the GP resonance. The sequence was repeated, with 2-wash-in breaths between acquisitions, for several fD values spread out in regular increments around the DP resonance frequencies. For the first two rats, fD values ranged from RBC + Δ to TP - Δ in increments of Δ/2; for the second two studies, fD ranged from RBC + Δ to TP - 3Δ/2 in increments of Δ/6. Pre- and post-saturation ratios were plotted to graph “z-spectra,” representing depolarization as a function of saturation frequency.
Results/Discussion
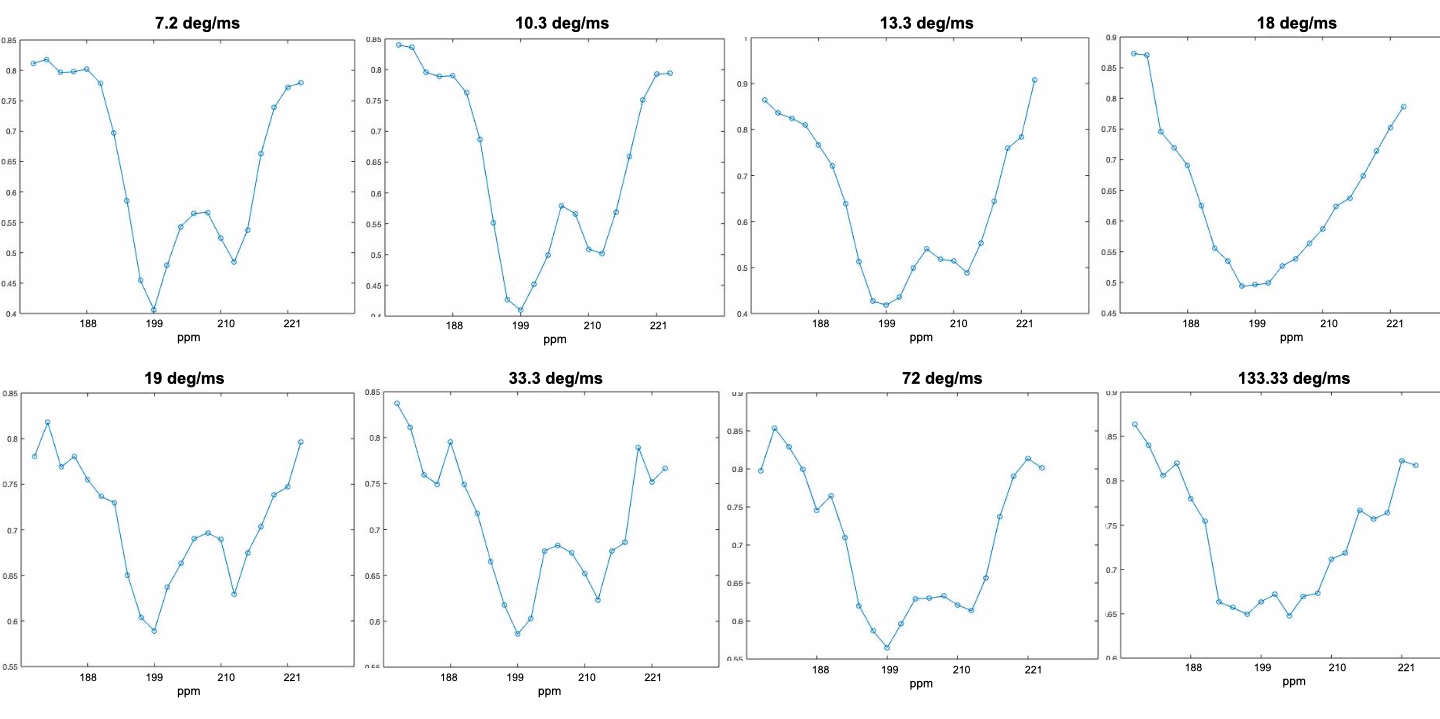
Figure 1 displays z-spectra obtained in a representative rat using block pulses applied at 7.2, 10.3, 13.33, 18, 19, 33.33, 72, and 133.33 deg/ms, flip angles of 5400 and 10000, and total durations ranging between 75 ms and 750 ms. There are two distinct polarization drops at the lowest pulse powers, centered at the RBC and TP resonance frequencies, respectively. As pulse power increases, the depolarization at the delta/2 midpoint between the peaks increases, as does peak width, suggesting lower pulse selectivity. At the highest powers of 72 deg/ms and 133.3 deg/ms, RBC and TP peaks are no longer distinguishable from each other.Figure 2 displays the same z-spectra with a Lorentzian fit applied to the graph according to the equation below:
$$\frac{S_{1}}{S_{0}} = Ae^{-Γ_{TP}t}e^{-Γ_{RBC}t}$$
where S0 and S1 are the signals measured pre- and post-saturation, respectively. A represents a scaling coefficient and the loss per unit time for RBC or TP, respectively:
$$Γ = \frac{B}{1 + \frac{p - p_{0}}{w/2}}$$
Where B is a proportionality constant, p0 represents the center of the curve, and w the width. The blue curve represents the fit for both RBC and TP peaks together, the red curve plots the same fit parameters for the first half of the equation only (loss around TP resonance), and the green curve plots the second half (loss around RBC resonance). These graphs show that the disparity between individual fits and combined fit becomes wider as power increases, suggesting that a greater portion of the observed depolarization is due to effects from the opposing DP frequency.
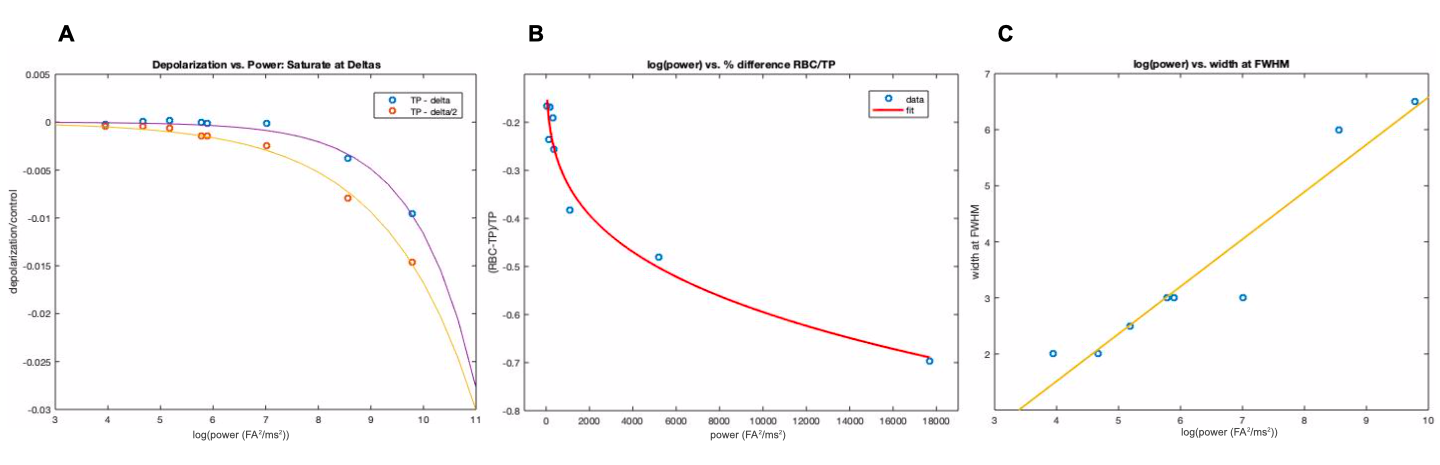
Figure 3 plots the relationship between power and various fit measures. Figure 3A shows the depolarization due to saturation at TP - Δ and TP - Δ/2 as a function of power: higher power saturation pulses result in higher contributions from the offset frequencies. Figure 3B plots the % difference between RBC and TP saturation as a function of power, demonstrating that this disparity, and therefore z-spectra asymmetry, increases with power. Lastly, Figure 3C plots the width of the tissue depolarization peak due to power, demonstrating a relatively positive linear relationship.
Conclusion
The z-spectra graphs measure the effect of saturation pulse power on selectivity for each dissolved phase compartment, and can be used to quantify the amount of depolarized gas signal that is derived from saturation of the desired compartment versus bleed-through saturation. They demonstrate that selectivity relies primarily on pulse power, as opposed to flip angle or duration individually. Pulses applied at higher powers cause greater GP depolarization due to unintended saturation at neighboring frequencies. Thus, if high power saturation pulses are used for XTC imaging—e.g., because they offer greater contrast generation—a correction method may be needed to account for compromised selectivity.Acknowledgements
References
[1] Ruppert K, Mata JF, Wang HT, Tobias WA, Cates GD, Brookeman JR, Hagspiel KD, Mugler JP 3rd. XTC MRI: sensitivity improvement through parameter optimization. Magn Reson Med. 2007 Jun;57(6):1099-109.
[2] Virgincar RS, Robertson SH, Nouls J, et al. Establishing an accurate gas phase reference frequency to quantify 129 Xe chemical shifts in vivo. Magn Reson Med. 2017;77(4):1438-1445.
[3] Amzajerdian F, Ruppert K, Hamedani H, Baron R, Xin Y, Loza L, Achekzai Ruppert K, Mata JF, Wang HT, Tobias WA, Cates GD, Brookeman JR, Hagspiel KD, Mugler JP 3rd. XTC MRI: sensitivity improvement through parameter optimization. Magn Reson Med. 2007 Jun;57(6):1099-109.
Figures