1804
Evaluating physiological gradients after bias field correction of Hyperpolarized 129Xe Gas Ventilation MRI1Medical Physics, Duke University, Durham, NC, United States, 2Biomedical Engineering, Duke University, Durham, NC, United States, 3Radiology, Duke University, Durham, NC, United States
Synopsis
Quantitative analysis of hyperpolarized 129Xe ventilation imaging requires overcoming the ill-posed problem of accurately correcting for bias field. The standard solution of N4ITK bias field correction removes not only bias field, but also physiologic gradients of interest. An alternative approach is applying RF depolarization mapping in a cohort of subjects to construct a bias field template. Here, we compare the effect that these different bias field correction techniques have on the 129Xe MRI ventilation gradients in a cohort of healthy patients (n=18).
Introduction
Hyperpolarized 129Xe magnetic resonance imaging enables regional assessment of ventilation and its response to therapy in numerous adult and pediatric diseases1,2,3. 129Xe ventilation MRI can be quantified regionally by a variety of approaches to characterize aspects of its ventilation distribution. One challenge to accurately quantifying such images is separating physiologically driven signal variation4 from that resulting from coil B1-inhomogeneity known as bias field. This is a known challenge for the most common method of bias correction using the N4ITK algorithm5 which tends to eliminate all inhomogeneities. Instead, alternative methods have been proposed to directly map RF depolarization6, which when applied to a cohort of subjects can be used to construct a flip angle template 7 for bias field correction. In this work we investigate how these different approaches to bias field correction preserve physiologic inhomogeneities in the resulting ventilation distribution.Methods
ImagingData were selected for analysis from 18 subjects who had undergone radial 129Xe ventilation MRI in the supine position at 3T (Siemens Magnetom Trio Scanner VB19) using the following parameters: views=3600; samples/view=128; TR/TE=4.5/0.45ms; flip angle=1.5; FOV=40cm. All 3D volumes were acquired using a randomized 3D Halton spiral radial sequence and reconstructed to a size of 128x128x128 with a constant kernel sharpness of 0.328.
T1 Estimation
As the total imaging time is on the order of the T1 of 129Xe in the lung, the T1 contribution to RF-depolarization cannot be ignored and thus must be properly estimated. In this work, we used an estimated T1 that was assumed based on prior studies to be dominated by paramagnetic oxygen9. For 129Xe-O2 collisions at 37oC body temperature, 129Xe relaxation is approximately linear with O2 partial pressure PO210
$$1/T_1 = 0.421s^{-1}*atm^{-1}P_{O_2}$$
PO2 was assumed to be 104 mmHg11 or 0.137 atm at end expiration (functional residual capacity - FRC) prior to subjects inhaling an anoxic dose volume of Vdose, thus further diluting the oxygen partial pressure to
$$P_{O_2}=0.137atm*\frac{FRC}{FRC+V_{dose}}$$
This dilution value was calculated for each subject individually, either from measured FRC, if available, or an estimated value if not. FRC was estimated for healthy subjects using the equation recommended by the European Respiratory Society 12, which for patients with lung disease was scaled down by the ratio of measured vs. predicted forced vital capacity (FVC)13. For a typical subject with FRC=3 liters, inhaling a 1-liter dose, the partial pressure of oxygen after dose inhalation would be ¾ of that at FRC or ~0.1 atm, yielding a T1 of approximately 24s. Note that although T1 can vary somewhat across the lung14, we have assumed it to be constant here.
Quantitative Analysis
For each of the bias field estimation methods, the resulting ventilation distributions were analyzed by a linear regression of the average intensity as a function of slice number rescaled by global average intensity for both posterior-anterior and superior-inferior gradients. Overall differences in bias field metrics and imaging metrics were tested for statistical differences using a repeated-measures ANOVA while individual differences were compared using a one-way analysis of variance with a Tukey’s honestly significant difference test.
Results
For visual demonstration of the effect of bias field correction, Figure 1 shows multiple slices from a single subject comparing uncorrected, depolarization-based, template-based, and N4ITK methods. The images are displayed using the established ventilation binning color scale derived from a healthy cohort originally corrected using the N4ITK method.Figure 2 illustrates the anterior-posterior and superior-inferior gradients in 129Xe distribution for healthy subjects. It shows both the line profiles for an individual representative subject as well as the population mean gradient in these directions for each of the correction approaches. The line profiles show the uncorrected intensity distribution to have a strong anterior-posterior gradient, which is somewhat moderated by both the depolarization- and template-based corrections. However, this gradient is eliminated by the N4ITK algorithm. In the superior-inferior direction, the uncorrected image again exhibits a strong gradient, which this time is largely, although not completely eliminated by all 3 correction approaches. In aggregate, the uncorrected images exhibited a positive anterior-posterior gradient of 2.23±2.95%/cm, which was only very slightly moderated by the RF depolarization, and template-based corrections to 2.77±2.09%/cm and 2.01±2.73 %/cm respectively. In contrast, this gradient is completely removed by the N4ITK algorithm(P<0.002) to -0.04±1.58%/cm. In the superior-inferior direction, only the uncorrected image exhibited a significant positive intensity gradient of 3.35±2.05%/cm while the RF depolarization, template, N4ITK corrected images had their gradients diminished to 0.17±2.65,-0.78±2.14, and 0.60±0.91 %/cm (P<0.001 for each comparison).
Discussion
Our study suggests that RF-depolarization based bias field correction approaches have the benefit on preserving physiological gradients, while N4ITK struggle to distinguish any slowly varying coil-induced vs physiologic inhomogeneities. In particular, this includes the well-known effects of gravity on ventilation in the supine lung that occur on this spatial scale. However, work lies ahead in establishing new binning thresholds and possibly even region-specific binning thresholds to reference cohorts.Acknowledgements
This study was funded by R01HL105643, R01HL12677, NSF GRFP DGE-1644868References
1. Thomen, R. P. et al. Hyperpolarized 129Xe for investigation of mild cystic fibrosis lung disease in pediatric patients. J. Cyst. Fibros. 16, 275–282 (2017).
2. Wang, Z. et al. Diverse cardiopulmonary diseases are associated with distinct xenon magnetic resonance imaging signatures. Eur. Respir. J. 54, (2019).
3. Svenningsen, S. et al. Hyperpolarized 3 He and 129 Xe MRI: Differences in asthma before bronchodilation. J. Magn. Reson. Imaging 38, 1521–1530 (2013).
4. Hopkins, S. R. et al. Vertical Gradients in Regional Lung Density and. Lung 103, 240–248 (2008).
5. Tustison, N. J., Cook, P. A. & Gee, J. C. N4ITK: Improved N3 Bias Correction. 29, 1310–1320 (2011).
6. Lu, J. et al. Bias Field Correction in Hyperpolarized 129 Xe Gas Ventilation MRI. ISMRM (2020).
7. Lu, J., Mummy, D., Leewiwatwong, S., Bier, E. & Driehuys, B. Template-based bias field correction of Hyperpolarized 129 Xe Gas Ventilation MRI. 10–12.
8. Robertson, S. H. et al. Optimizing 3D noncartesian gridding reconstruction for hyperpolarized 129 Xe MRI-focus on preclinical applications. Concepts Magn. Reson. Part A 44, 190–202 (2015).
9. Deninger, A. J. et al. Quantification of Regional Intrapulmonary Oxygen Partial Pressure Evolution during Apnea by 3He MRI. J. Magn. Reson. 141, 207–216 (1999).
10. Saam, B. T1 relaxation of 129Xe and how to keep it long. New Dev. NMR 2015-Janua, 122–141 (2015).
11. Ortiz-Prado, E., Dunn, J. F., Vasconez, J., Castillo, D. & Viscor, G. Partial pressure of oxygen in the human body: a general review. Am. J. Blood Res. 9, 1–14 (2019).
12. Gommers, D. Functional residual capacity and absolute lung volume. Curr. Opin. Crit. Care 20, 347–351 (2014).
13. Cooper, B. G. et al. The global lung function initiative (GLI) network: Bringing the world’s respiratory reference values together. Breathe 13, e56–e64 (2017).
14. Neemuchwala, F. et al. Lung T1 mapping magnetic resonance imaging in the assessment of pulmonary disease in children with cystic fibrosis: a pilot study. Pediatr. Radiol. 50, 923–934 (2020).
Figures
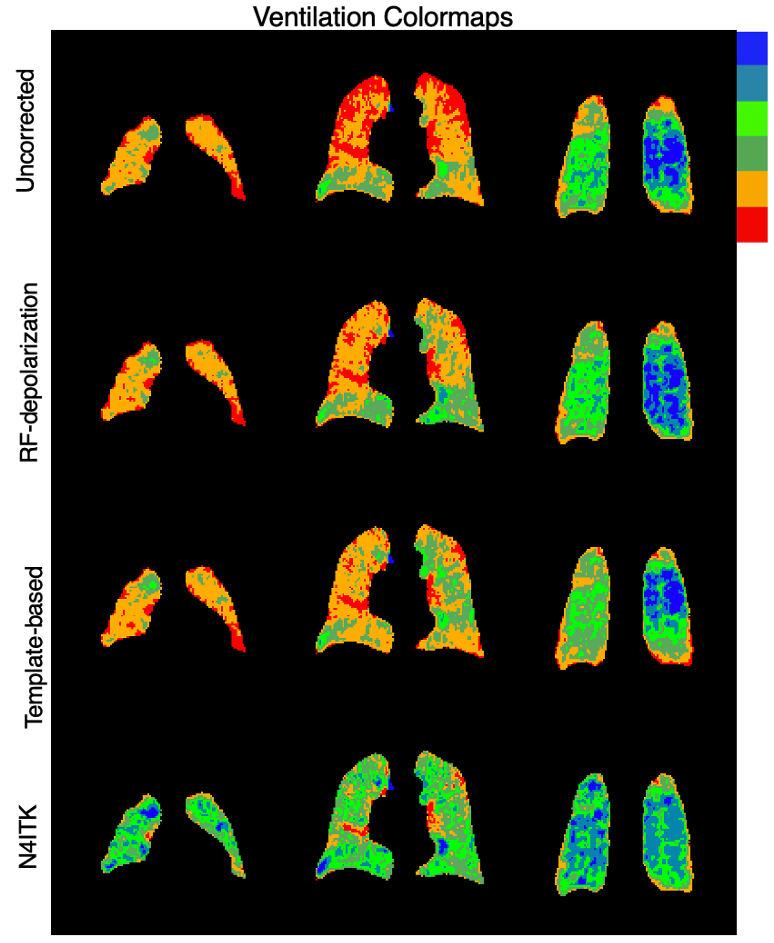
Figure 1. Comparison of corrected images using template-based approach and its respective direct correction method (RF-depolarization mapping and N4ITK). These examples illustrate 1) direct application of N4ITK tends to be similar or more aggressive than template-based bias field correction and 2) Template based bias field correction based on RF-depolarization mapping achieves similar levels of correction compared to direct application of RF-depolarization mapping derived from the individual subject.
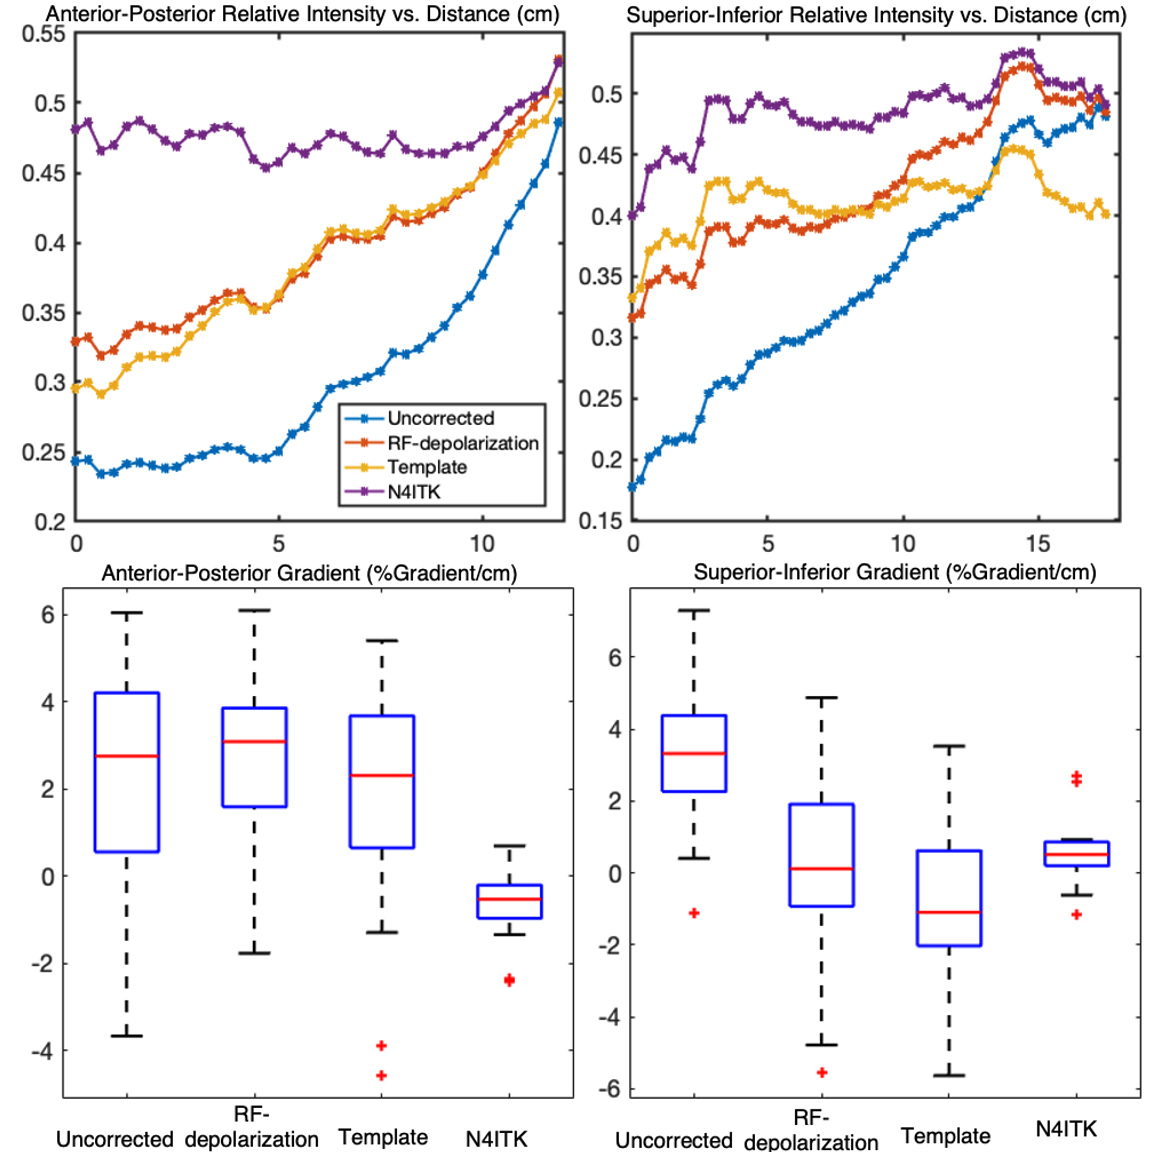
Figure 2. Top: line profile showing ventilation gradients in a representative subject in the anterior-posterior and superior-inferior directions. Bottom: Gradients (%gradient/cm) of healthy subjects (n=51) in cohort in the anterior-posterior and superior-inferior direction. In the anterior-posterior direction, both the depolarization and template-based correction methods preserved the gravitational gradient, while N4ITK eliminated this gradient entirely (P<.001).