1801
Sensitivity analysis of the MOXE model of gas exchange for lung hyperpolarised 129Xe MRS and MRI1Centre for Medical Image Computing, Quantitative Imaging Group, Department of Medical Physics & Biomedical Engineering, University College London, London, United Kingdom, 2GlaxoSmithKline R&D, Stevenage, United Kingdom, 3Bioxydyn Limited, Manchester, United Kingdom
Synopsis
Univariate sensitivity analysis was used to determine parameter importance within the model of gas exchange (MOXE) for lung hyperpolarised 129Xe MRS/MRI. Sensitivity of the model to parameter variation across a range of saturation recovery delay times within the chemical shift saturation recovery (CSSR) technique was assessed. Simulated parameter values spanned those in healthy and patient groups. MOXE is found to be most sensitive to changes in surface-area-to-volume ratio and in septal wall thickness. MOXE is negligibly sensitive to alveoli-capillary barrier thickness. CSSR measurements taken within delay periods between 0 - 200 ms provide optimum parameter sensitivity.
Introduction
Parameters related to the microstructural and physiological properties of the lung have been estimated using 1D diffusion respiratory models in conjunction with a variety of hyperpolarized 129Xe (HpXe) MRS and MRI techniques. Chang’s1 model of gas exchange (MOXE) expanded upon the HpXe diffusion model development by Ruppert2 and Patz3, by incorporating both the red blood cell (RBC) and tissue phase (TP) of the MR signal within the dissolved phase. The parameters estimated using the MOXE model have been used in the pre-clinical and clinical assessment of pulmonary diseases such as chronic obstructive pulmonary disease (COPD), interstitial lung disease (ILD), and asthma. However, to the best of our knowledge, no formal analysis of the sensitivity of the model to changes in the parameters of interest has been performed to date. Sensitivity analysis investigates how variations in a model’s output can be attributed to variations within different inputs/parameters4. If the model output is insensitive to changes within the parameter space, precise interrogation of parameters cannot be achieved. We employed a univariate sensitivity analysis in the assessment of six anatomical and physiological parameters within the MOXE diffusion model: capillary transit time $$$\tau$$$; surface area to volume ratio $$$SVR$$$; the diffusion time constant $$$T$$$; alveoli-capillary barrier thickness $$$\delta$$$; septal wall thickness $$$d$$$; and Haematocrit $$$HCT$$$.Methods
The MOXE model is summarised in Fig. 1 and was simulated for chemical shift saturation recovery (CSSR) measurements according to Chang1$$ S_{d1}(t) = \lambda d\frac{ S_A}{V_g}\left(2\frac{\delta}{d}-\frac{8}{\pi^2}\sum_{n=odd}\left[1-cos(n\pi \frac{\delta}{d})\right]e^{-n^2 t/T}\right),$$
$$ S_{d2} = 2\lambda d\frac{S_A}{V_g}\Bigg\{(1-2\frac{\delta}{d})\frac{t}{\tau}-\frac{8}{\pi^2}\frac{T}{\tau}\sum_{n=odd}\left[\frac{1}{n^4}cos(n\pi \frac{\delta}{d})\right]e^{-n^2 t/T}\Bigg\}\\+ 2\lambda d\frac{S_A}{V_g}\left(\frac{\tau-t}{\tau}\right)\Bigg\{(1-2\frac{\delta}{d})-\frac{8}{\pi^2}\sum_{n=odd}\left[\frac{1}{n^2}cos(n\pi \frac{\delta}{d})\right]e^{-n^2 t/T}\Bigg\},$$
$$ S_{TP}(t) = S_{d1}(t) + (1-\eta)S_{d2}(t),$$
$$ S_{RBC}(t) = \eta S_{d2}(t), $$
where $$$ S_{d1} $$$ is the signal contribution to the total HpXe signal from the non-vascular tissue and $$$ S_{d2} $$$ is the contribution from the plasma and RBCs, where $$$ \eta $$$ is the fraction of dissolved gas in the RBC's, $$$ S_{TP} $$$ is the signal from the tissue/plasma and $$$ S_{RBC} $$$ is the signal from the RBC’s.
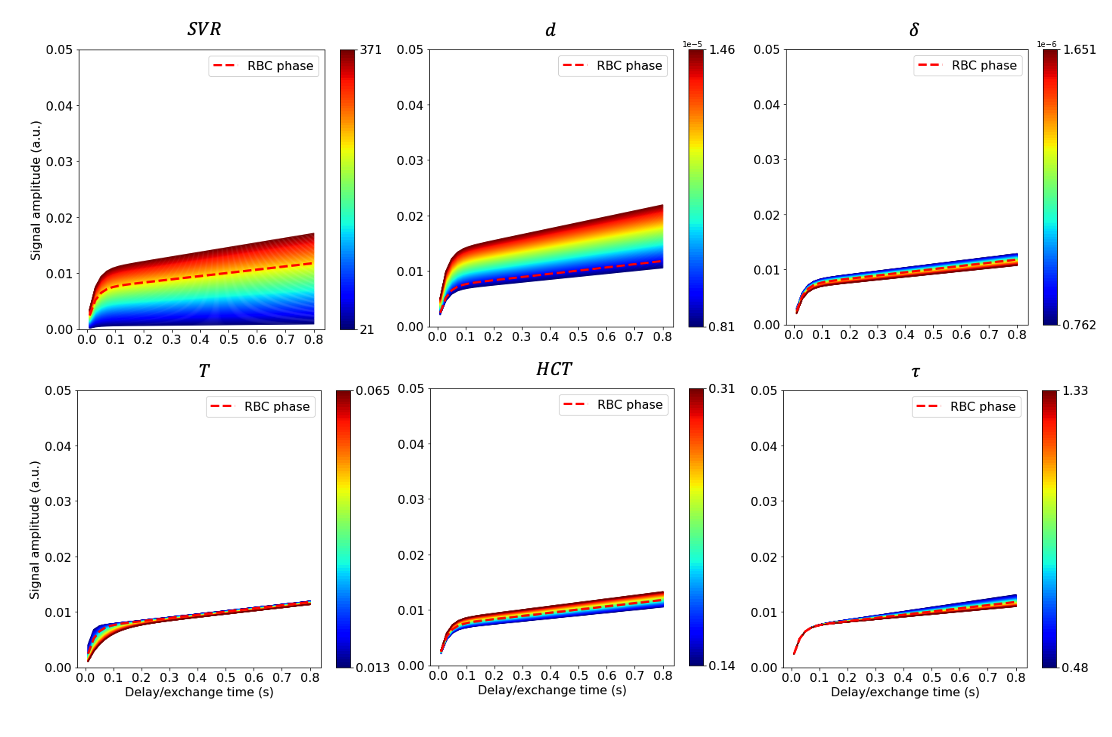
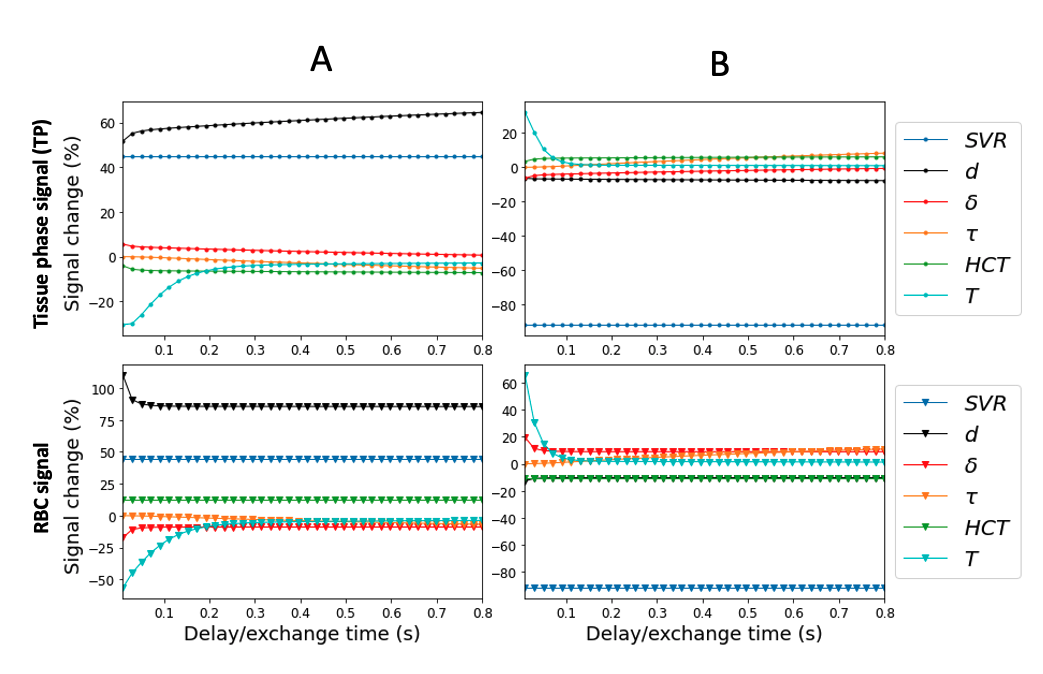
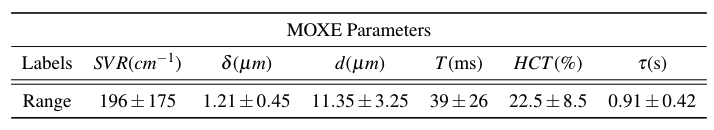
We simulated saturation delay times up to 800 ms. Each model parameter was varied within the range mean $$$\pm$$$ St dev independently, whilst maintaining constant values for the other five parameters at their mean. Diseased and healthy parameter values were taken from previous MOXE experiments,1,6 CT,5 and histological measurements9,10 respectively. Each independently incremented parameter value was used in producing a simulated MOXE model output. During the delay time interval, the model output variability is affected by changes to the range of the parameter value. In evaluating temporal dependence, the maximum signal percentage change (SPC) of each parameter was assessed. In general SPC plots represent the signal as the change in percentage from the mean average values. The maximum SPC display the SPC due to the upper and lower limits of the parameter range, displaying the general shape of change and in what temporal region.
Results
Figures. 2,3, and 4, show the signal variations and maximum SPC observed when independently varying each model parameter. For both TP and RBC, variations in $$$ SVR $$$ led to the largest signal changes, followed by $$$ d $$$. $$$ \delta $$$ showed the smallest change in TP signal, whereas $$$ T $$$ variation led to the smallest change in RBC signal. The largest changes in percentage terms were observed for $$$ d $$$, followed by $$$ SVR $$$, with $$$ \tau $$$ generally showing the smallest change. Model output variation as a function of delay time within the CSSR acquisition window was apparent, with most parameters displaying sensitivity within delay times up to 200 ms, apart from $$$ \tau $$$ demonstrating greater contribution to model output at delay times above 100 ms.Discussion
Parameter sensitivity varied to a degree for the different dissolved phase compartments, but $$$ SVR $$$ and $$$ d $$$ are the parameters that the model is most sensitive to for both TP and RBC. $$$ \delta $$$ shows the greatest difference in sensitivity between the two phases, but overall, the model sensitivity to variation in $$$ \delta $$$ is low, which has previously been demonstrated experimentally6. Sensitivity to all other parameters is marginally greater than $$$ \delta $$$, but substantially lower than sensitivity to $$$ SVR $$$ and $$$ d $$$. These observations provide useful guidance for the likely SNR requirements of CSSR measurements designed to measure MOXE parameters. For example, an SNR of only $$$ \sim 2 $$$ would be adequate to distinguish the extremes of the range of possible $$$ SVR $$$ and $$$ d $$$, whereas an SNR of $$$ \sim15 $$$ would be required to distinguish the extremes of the range of possible $$$ \delta $$$.For both the TP and RBC phase the greatest sensitivity to the majority of parameters was between CSSR saturation recovery times of 0-200 ms. Consequently, with the exception of $$$ \tau $$$, taking measurements over this range will be optimum.
Conclusion
Sensitivity analysis of the MOXE model displayed the greatest signal sensitivity to $$$ SVR $$$ and $$$ d $$$. In contrast, the model is negligibly sensitive to $$$ \delta $$$. CSSR measurements taken within delay periods between 0 - 200 ms are likely to provide optimum parameter sensitivity.Acknowledgements
This work is co-funded by an EPSRC Industrial CASE award (Voucher No. V20000074) aligned to the EPSRC UCL Centre for Doctoral Training in Medical Imaging (EP/S021930/1) and GlaxoSmithKline Research and Development Ltd (BIDS3000035683).References
- Yulin V Chang. MOXE: a model of gas exchange for hyperpolarized 129xe magnetic resonance of the lung. Magnetic resonance in medicine, 69(3):884–890, 2013.
- Kai Ruppert, Jaime F Mata, James R Brookeman, Klaus D Hagspiel, and John P Mugler III. Exploring lung function with hyperpolarized 129xe nuclear magnetic resonance. Magnetic Resonance in Medicine: An Official Journal of the International Society for Magnetic Resonance in Medicine, 51(4):676–687, 2004.
- Samuel Patz, Iga Muradyan, Mirko I Hrovat, Mikayel Dabaghyan, George R Washko, Hiroto Hatabu, and James P Butler. Diffusion of hyperpolarized129Xe in the lung: a simplified model of129Xe septal uptake and experimental results. New Journal of Physics, 13(1):15009, Jan 2011.
- Andrea Saltelli, Marco Ratto, Terry Andres, Francesca Campolongo, Jessica Cariboni, Debora Gatelli, Michaela Saisana, and Stefano Tarantola. Global sensitivity analysis: the primer. John Wiley & Sons, 2008.
- Harvey O Coxson, Robert M Rogers, Kenneth P Whittall, YULIA D’YACHKOVA, Peter D Pare, Frank C Sciurba, and James C Hogg. A quantification of the lung surface area in emphysema using computed tomography. American journal of respiratory and critical care medicine, 159(3):851–856, 1999.
- Neil J Stewart, General Leung, Graham Norquay, Helen Marshall, Juan Parra-Robles, Philip S Murphy, Rolf F Schulte, Charlie Elliot, Robin Condliffe, Paul D Griffiths, et al. Experimental validation of the hyperpolarized 129xe chemical shift saturation recovery technique in healthy volunteers and subjects with interstitial lung disease. Magnetic resonance in medicine, 74(1):196–207, 2015.
- Kai Ruppert, Kun Qing, James T Patrie, Talissa A Altes, and John P Mugler III. Using hyperpolarized xenon-129 MRI to quantify early-stage lung disease in smokers. Academic radiology, 26(3):355–366, 2019.
- Justus E Roos, Holman P McAdams, S Sivaram Kaushik, and Bastiaan Driehuys. Hyperpolarized gas MR imaging: technique and applications. Magnetic Resonance Imaging Clinics, 23(2):217–229, 2015
- Stanley M Cassan, Matthew B Divertie, and Arnold L Brown. Fine structural morphometry on biopsy specimens of human lung: 2. diffuse idiopathic pulmonary fibro-sis. Chest, 65(3):275–278, 1974
- KATSUTOMO YUBA. A study on the pulmonary functions and the pulmonary circulation in cardio-pulmonary diseases: (i) pulmonary diffusing capacity in cardio-pulmonary diseases. Japanese Circulation Journal, 35(11):1391-1397, 1971.
Figures
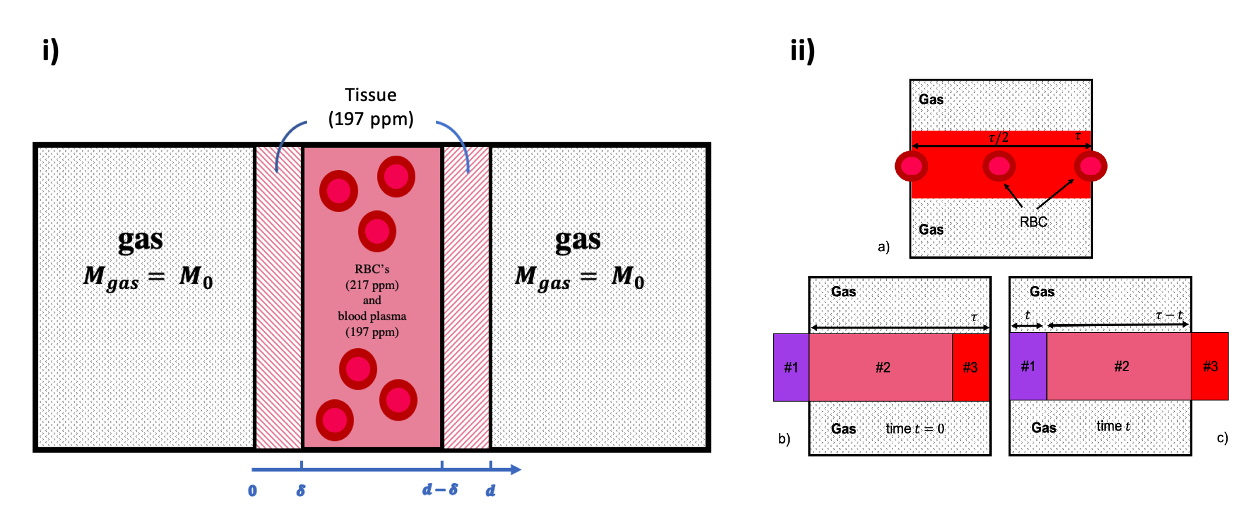
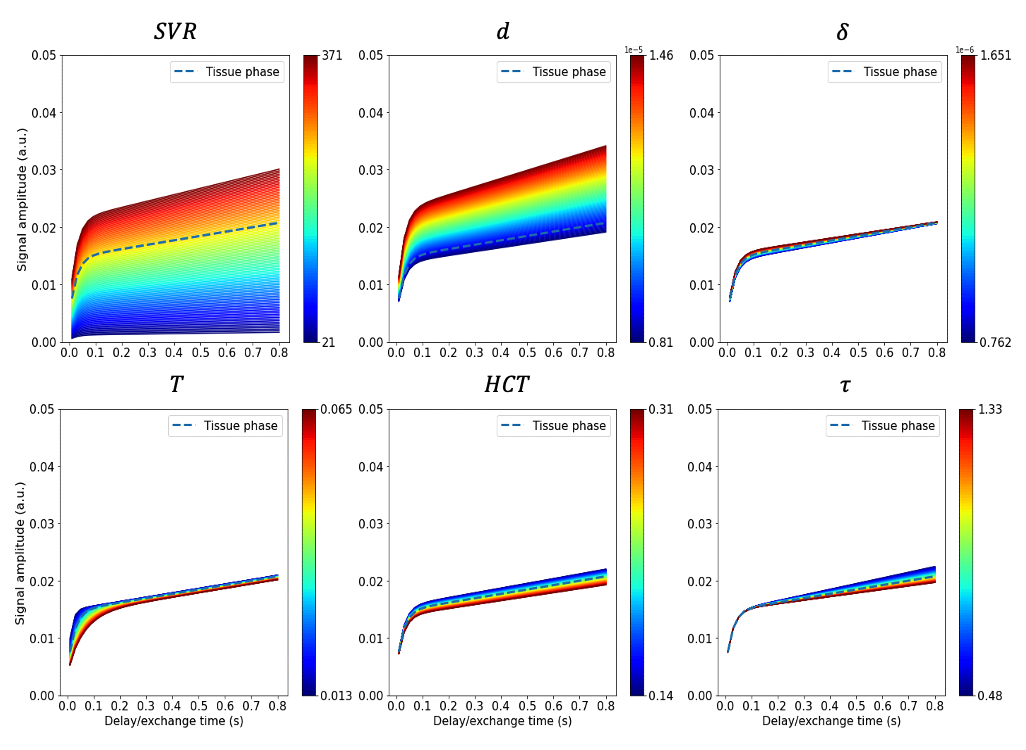
Figure 2: Plots of the six parameters for the MOXE model spanning the range of disease and healthy parameters given in Table. 1, where the dashed line corresponds to the original TP values produced by MOXE1 for a typical healthy subject. Colour maps correspond to the lower and upper limits of the standard deviation of each parameter where axes represent signal amplitude (y-axis) and saturation delay time (x-axis). The colour scale corresponds to the values of the parameter being varied where the signal amplitude is dependent on the value of the parameter.