1799
Multi-band echo-planar spectroscopic imaging of hyperpolarized 13C probes in a compact preclinical PET/MR scanner1Washington University, St Louis, MO, United States, 2MR Solutions, Guildford, United Kingdom, 3GE Healthcare, Dallas, TX, United States
Synopsis
Hyperpolarized (HP) 13C MRI requires advanced pulse sequences to capture the dynamic, localized metabolic information. We developed an echo planar spectroscopic imaging (EPSI) pulse sequence incorporating multi-band spectral-spatial radiofrequency (SSRF) pulses for rapid and efficient HP 13C MRI on a new cryogen-free simultaneous PET/MR molecular imaging platform with compact footprint. Excitation profiles were measured in phantoms, and the SSRF-EPSI sequence was tested in rats using two HP 13C probes. We also obtained simultaneous 18F-FDG-PET data for comparison. In conclusion, advanced 13C SSRF imaging approaches are feasible on the new PET/MR platform, facilitating direct comparison with PET.
Introduction
Hyperpolarized (HP) 13C MRI is a powerful modality for detecting real-time enzymatic conversions of metabolically-active substrates. The short lifetime of HP 13C magnetization, as dictated by T1, constrains the design of acquisition sequences. Echo planar spectroscopic imaging (EPSI) with multi-band spectral-spatial radiofrequency (SSRF) excitation, which enables prescription of specifically optimized flip angles onto individual metabolites, is a rapid and efficient approach1. Specifically, application of a smaller flip angle on the primary injected substrate as compared to its downstream metabolite(s) can significantly improve the efficiency of sampling. In the rapidly evolving landscape of preclinical MRI, our new PET/MR system features a cryogen-free magnet with compact footprint of 2.6 m (L) x 1.1 m (W) x 1.6 m (H), which has allowed us to site the scanner in a small available space within a preclinical PET/CT facility. The present work shows for the first time that multi-band 13C EPSI is feasible on this new molecular imaging discovery platform. Use of flyback readouts and excitation pulse waveforms, with their tolerance for potential gradient imperfections, provides a robust entry point2. We present results from HP 13C metabolic imaging using the new multi-band EPSI sequence.Methods
PET/MR scanner Variable-field 7T/3T capability was adjusted to 3T for improved signal lifetime. 13C studies were conducted using a dual-tuned 13C/1H quad/quad volume RF coil (i.d.= 72 mm). The PET insert supports simultaneous PET with an axial FOV of 98 mm and a transverse FOV of 95 mm.Hyperpolarization [1-13C]Pyruvate and [1-13C]α-ketobutyrate3 (αKB) samples were each polarized in the GE SPINlab hyperpolarizer (0.8 K / 5 T) by microwave irradiation for 3 h. Each sample was rapidly dissolved in superheated water and neutralized to yield ~100-mM contrast media.
Pulse sequence development A vendor-supplied 2D EPSI pulse sequence was modified to support arbitrary SSRF excitation waveforms (Figure 1A). Pulses were designed to impart differential flip angles on the primary injected substrate ([1-13C]pyruvate, 5°) as compared with its downstream metabolic product ([1-13C]lactate, 13°), using the “Spectral Spatial RF Pulse Design Matlab Package”1. A short 2.2-ms waveform with peak B1 of 0.01 mT (Figure 1B) meets the target specifications. Spectral-spatial profiles were verified by sweeping the center frequency while scanning a narrow water phantom in 1H mode, and corresponded well with Bloch simulations (Figure 1C). Pulses were also tested on a new 3D-printed multi-chamber 13C phantom.
HP 13C Acquisition Coronal dynamic multi-band EPSI of rat abdomen was acquired starting 20 s after injection, with temporal resolution of 4 s. Each frame consisted of a 16 x 16 spatial matrix (5 mm in-plane) with spectral bandwidth of 833 Hz. Metabolite AUC ratios and first-order apparent pyruvate-to-lactate conversion rates (kPL) were quantified, using the “Hyperpolarized MRI Toolbox”4. Four rats were scanned after injection of HP [1-13C]pyruvate, and one rat was scanned with [1-13C]αKB. Standard EPSI was also acquired in one rat (flip angle= 8°).
FDG-PET Acquisition List mode PET data were acquired in one rat for one hour after injection of 1 mCi 18F-FDG, just prior to HP [1-13C]pyruvate MRI.
Results
Phantom testing As shown in Figure 2, multi-band SSRF excitation selectively increased [1-13C]lactate signals over [13C]formate (surrogate for pyruvate), as compared with standard “broadband” excitation.Multi-band EPSI HP [1-13C]pyruvate imaging is shown in Figure 3. For liver, mean lactate/pyruvate AUC ratios and kPL values were 0.34±0.096 and 0.016±0.0039 s-1, respectively. For kidney, corresponding values were 0.15±0.047 and 0.0066±0.0022 s-1. Multi-band acquisition resulted in improved [1-13C]lactate detection within a liver ROI (Fig. 3C). HP [1-13C]αKB imaging is shown in Figure 4. Hepatic reduction to α-hydroxybutyrate (αHB) was attenuated vs [1-13C]pyruvate (αHB/αKB AUC ratio= 0.095), presumably as a result of the specificity of the pyruvate analog for LDHB-expressed units of LDH, which are largely absent from liver5. Kidney and heart both maintained high reduction of αKB, consistent with their known expression of LDHB. The αHB/αKB AUC ratio in kidney was 0.052, and was 4.6-fold higher in heart than in liver.
Simultaneous PET and HP 13C imaging Coronal FDG-PET images are shown in Figure 5, together with results of multi-band HP [1-13C]pyruvate imaging acquired immediately after the PET scan.
Discussion
There are few prior reports on HP 13C on this platform, published only recently6,7. Our multi-band approach enables more efficient sampling of metabolite dynamics. There are also few prior reports on simultaneous HP 13C / PET8. Synthesis of advanced 13C and PET facilitates direct comparison of the full capabilities of these modalities in model systems. Recent comparative work has shown that HP [1-13C]pyruvate MRI can be more sensitive than FDG-PET for early detection of treatment response9. Additional comparative studies are needed to help elucidate the future clinical role of HP 13C.It is important to acknowledge certain limitations of the current sequence. First, the particular pulse is only suitable for resonance patterns associated with [1-13C]pyruvate and [1-13C]αKB. Second, we have yet to implement slice shifting. For our robust flyback excitations, this only requires a simple frequency offset calculation.
Future work will include extending our developments into 3D, and optimization of PET/MR. The former could be achieved via undersampling strategies. If biochemical effects of pyruvate on PET results are found to be negligible, comparative 13C/PET studies could be streamlined.
Acknowledgements
We gratefully acknowledge the unwavering support and guidance of Joseph J.H. Ackerman. We also acknowledge grant support from NIH S10 OD023580, R01 DK115987, and U24 CA209837.References
1. Larson PE, Kerr AB, Chen AP, Lustig MS, Zierhut ML, Hu S, Cunningham CH, Pauly JM, Kurhanewicz J, Vigneron DB. Multiband excitation pulses for hyperpolarized 13C dynamic chemical-shift imaging. J Magn Reson 2008;194(1):121-127.
2. Cunningham CH, Chen AP, Albers MJ, Kurhanewicz J, Hurd RE, Yen YF, Pauly JM, Nelson SJ, Vigneron DB. Double spin-echo sequence for rapid spectroscopic imaging of hyperpolarized 13C. J Magn Reson 2007;187(2):357-362.
3. von Morze C, Bok RA, Ohliger MA, Zhu Z, Vigneron DB, Kurhanewicz J. Hyperpolarized [(13)C]ketobutyrate, a molecular analog of pyruvate with modified specificity for LDH isoforms. Magn Reson Med 2016;75(5):1894-1900.
4. Hyperpolarized MRI Toolbox. Available online at: https://github.com/LarsonLab/hyperpolarized-mri-toolbox . DOI: 10.5281/zenodo.1198915 . Accessed November 2, 2021.
5. Markert CL. Lactate dehydrogenase. Biochemistry and function of lactate dehydrogenase. Cell Biochem Funct 1984;2(3):131-134.
6. Kawai T, Brender JR, Lee JA, Kramp T, Kishimoto S, Krishna MC, Tofilon P, Camphausen KA. Detection of metabolic change in glioblastoma cells after radiotherapy using hyperpolarized (13) C-MRI. Nmr Biomed 2021:e4514.11.
7. Saida Y, Brender JR, Yamamoto K, Mitchell JB, Krishna MC, Kishimoto S. Multimodal molecular imaging detects early responses to immune checkpoint blockade. Cancer Res 2021.
8. Gutte H, Hansen AE, Henriksen ST, Johannesen HH, Ardenkjaer-Larsen J, Vignaud A, Hansen AE, Borresen B, Klausen TL, Wittekind AM, Gillings N, Kristensen AT, Clemmensen A, Hojgaard L, Kjaer A. Simultaneous hyperpolarized (13)C-pyruvate MRI and (18)F-FDG-PET in cancer (hyperPET): feasibility of a new imaging concept using a clinical PET/MRI scanner. Am J Nucl Med Mol Imaging 2015;5(1):38-45.
9. Hesketh RL, Wang J, Wright AJ, Lewis DY, Denton AE, Grenfell R, Miller JL, Bielik R, Gehrung M, Fala M, Ros S, Xie B, Hu DE, Brindle KM. Magnetic Resonance Imaging Is More Sensitive Than PET for Detecting Treatment-Induced Cell Death-Dependent Changes in Glycolysis. Cancer Res 2019;79(14):3557-3569.
Figures
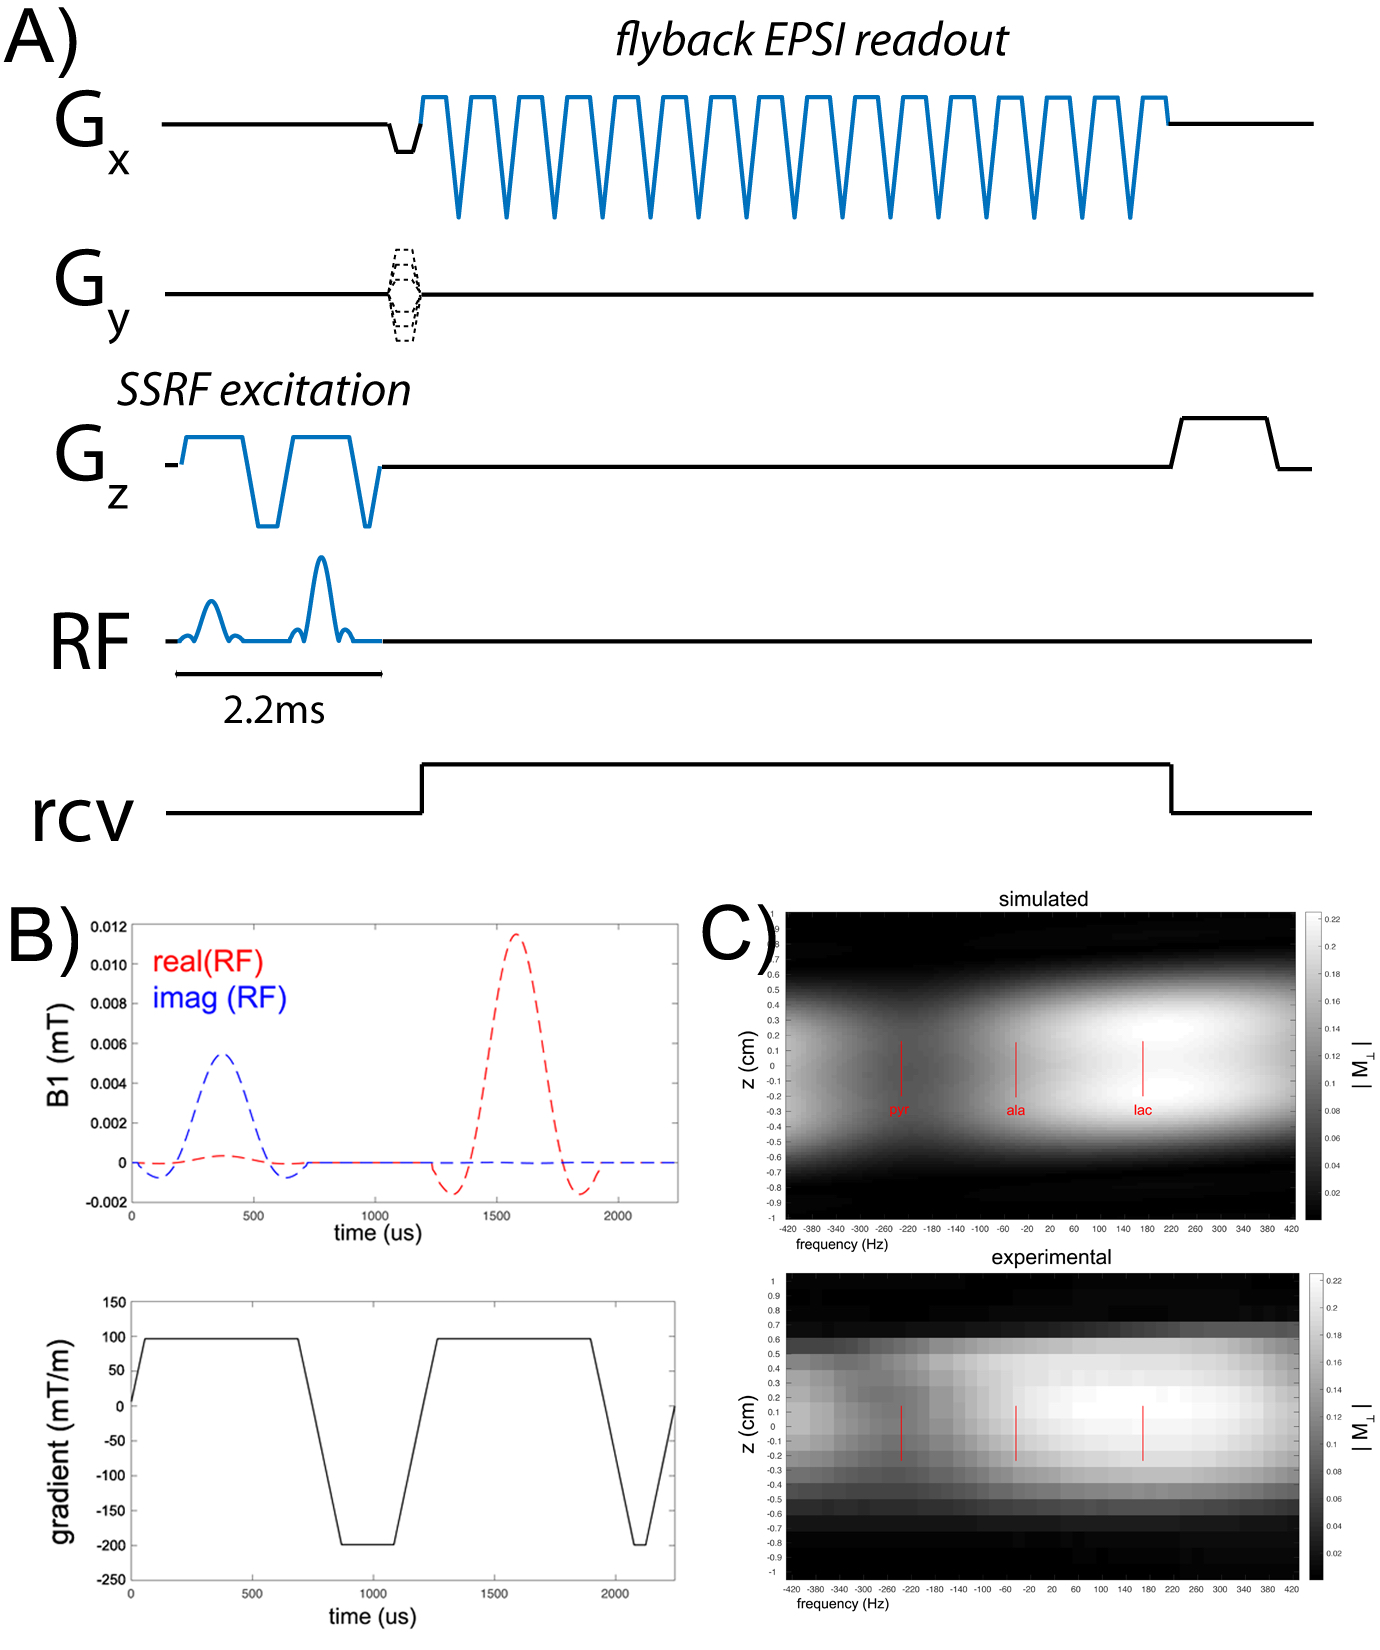
Figure 1. Multi-band 2D EPSI sequence (A) incorporating SSRF excitation for rapid and efficient HP 13C MRI. Detailed views of the custom RF and gradient waveforms comprising the SSRF excitation are shown in panel B. Simulated and experimental spectral-spatial excitation profiles for the custom SSRF excitation waveform are shown in panel C. Magnitude of the transverse magnetization is shown, scaled to unity for 90° excitation. Positions of the relevant 13C resonances are indicated by red lines.
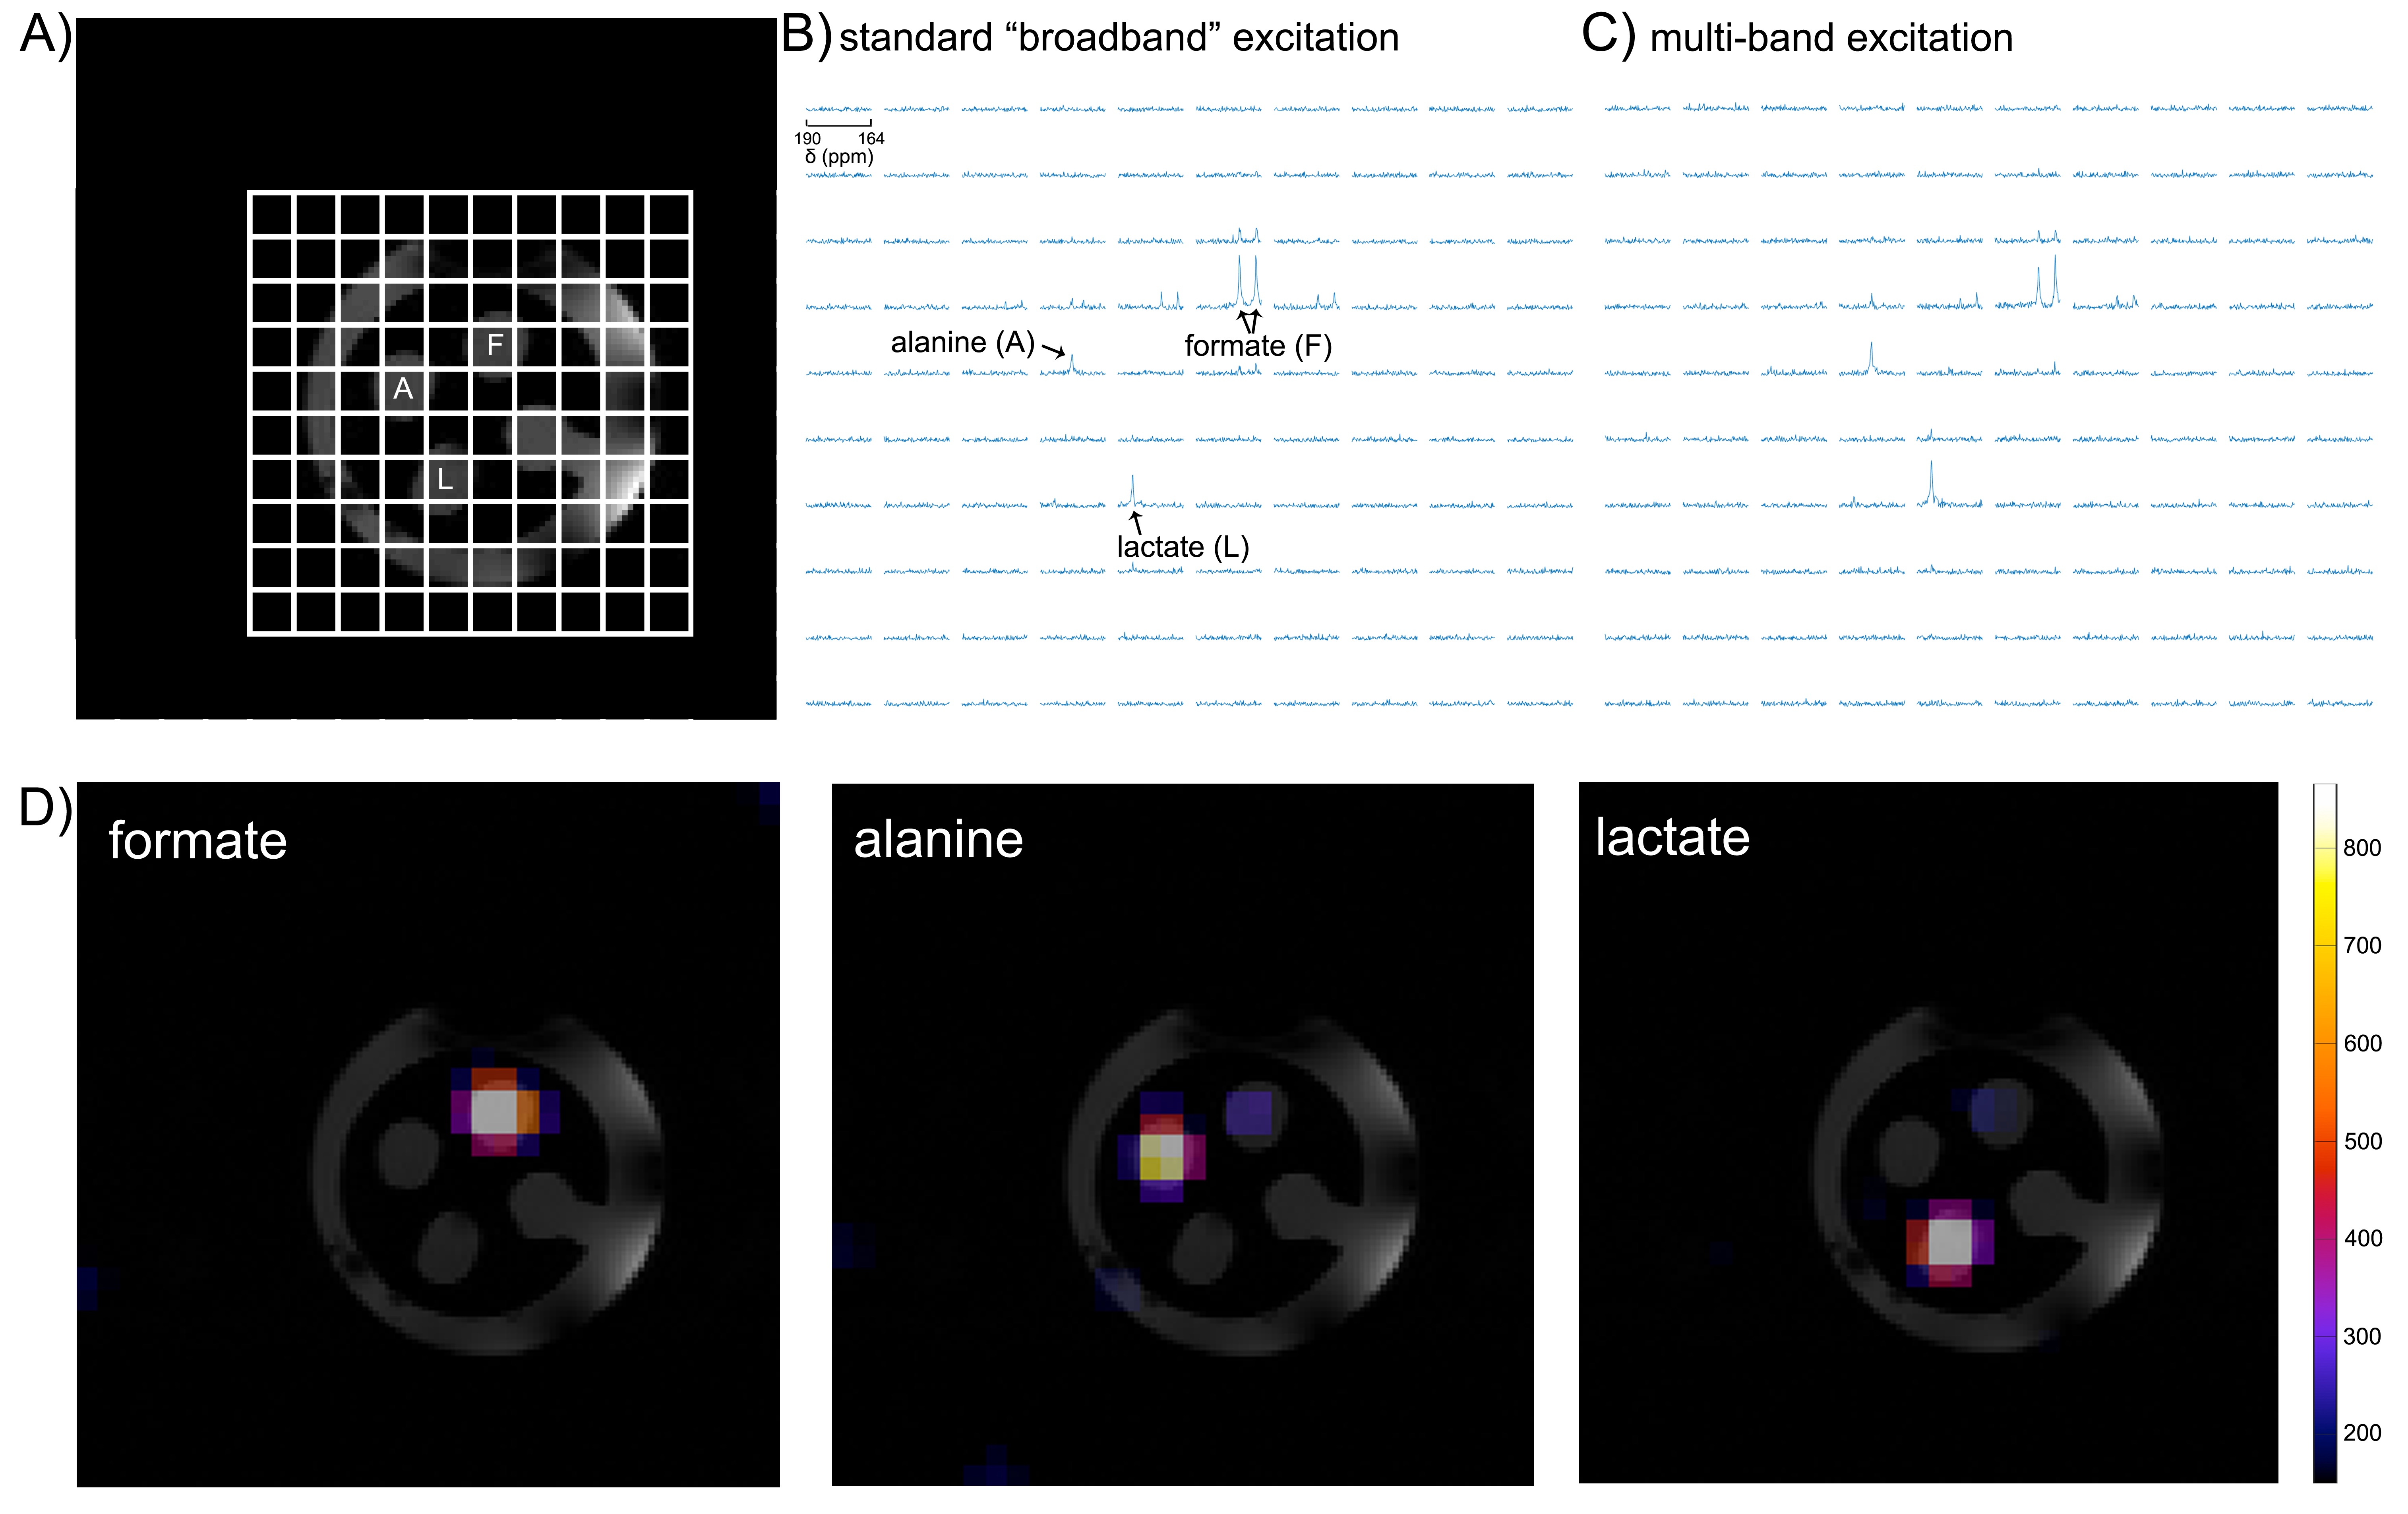
Figure 2. Testing multi-band 13C EPSI sequence in a custom 3D-printed multi-chamber phantom. 13C spectral grids are shown next to a corresponding cross-sectional 1H image through middle of phantom, with three compartments (F= [13C]formate, A= [1-13C]alanine, L= [1-13C]lactate). A) Spectral grid arising with standard “broadband” excitation. B&C) Spectral grids obtained using conventional vs tailored multi-band excitation, showing specifically increased lactate signal with tailored excitation. D) Metabolite maps.
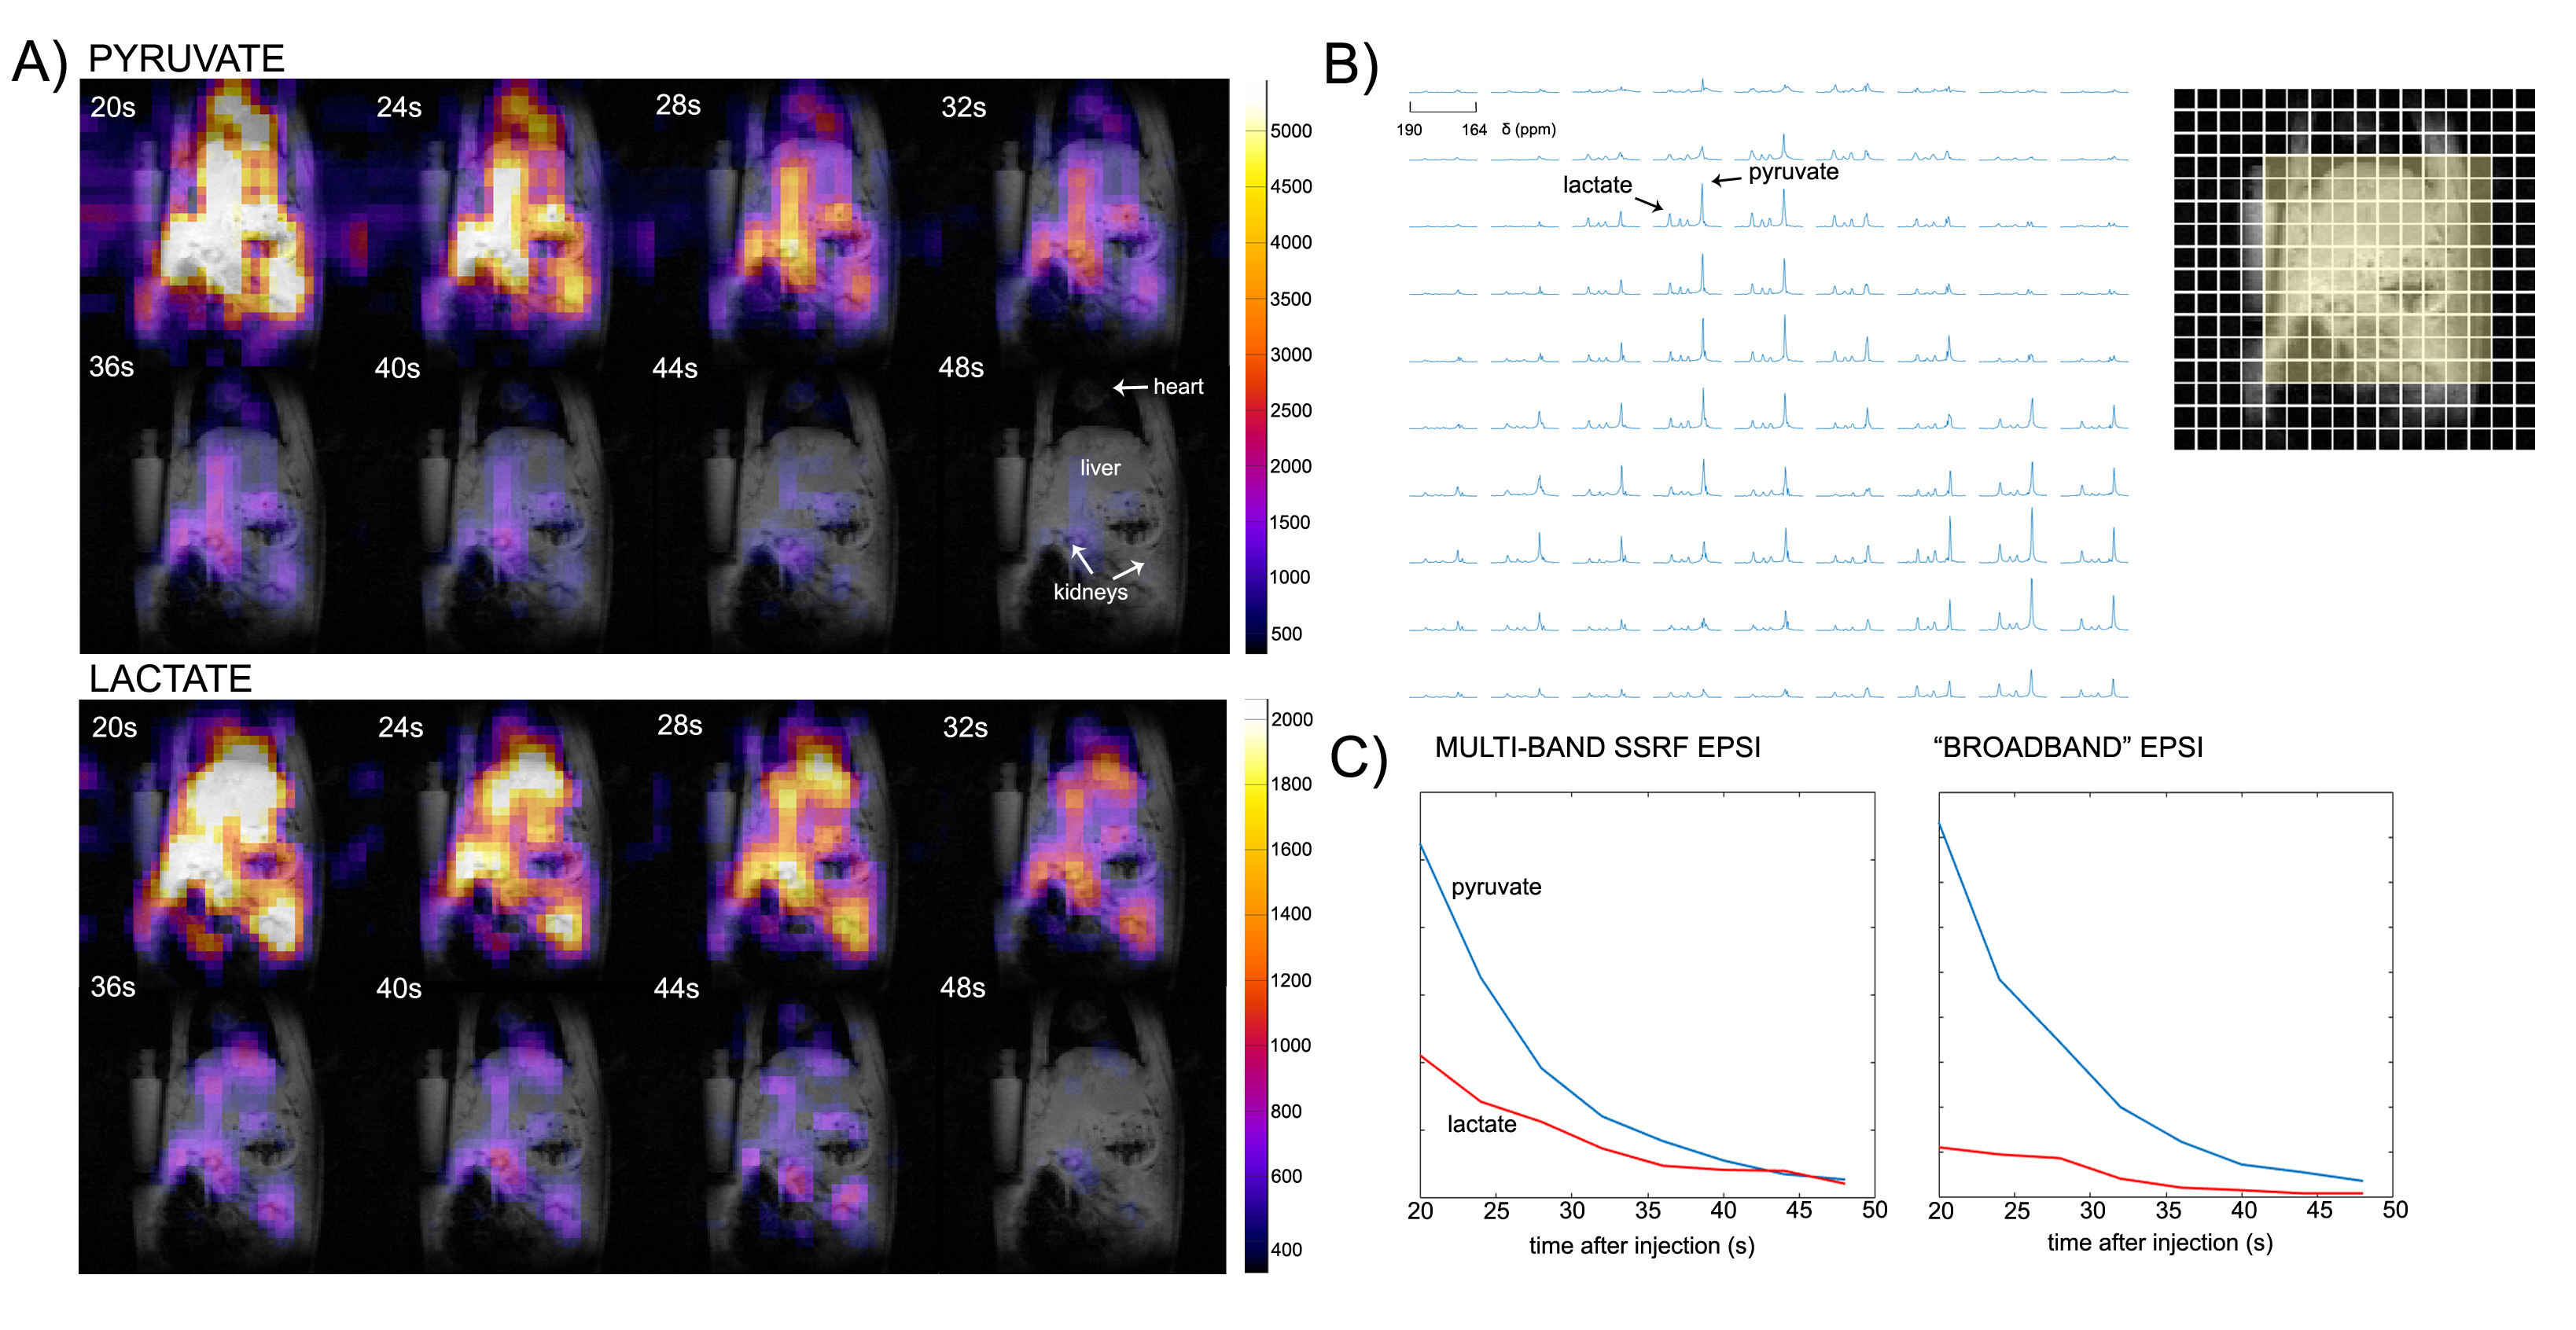
Figure 3. Multi-band SSRF EPSI imaging of HP [1-13C]pyruvate and downstream metabolite [1-13C]lactate in rat abdomen, for the first eight dynamic frames. A) Individual metabolite images shown in color overlaid on T1-weighted 1H images for anatomic reference (grayscale). B) Localized 13C spectral array corresponding to the yellow box, summed over the dynamic time points. C) Dynamic signal curves obtained for the multi-band SSRF EPSI acquisition as compared with conventional “broadband” EPSI, for a liver ROI.
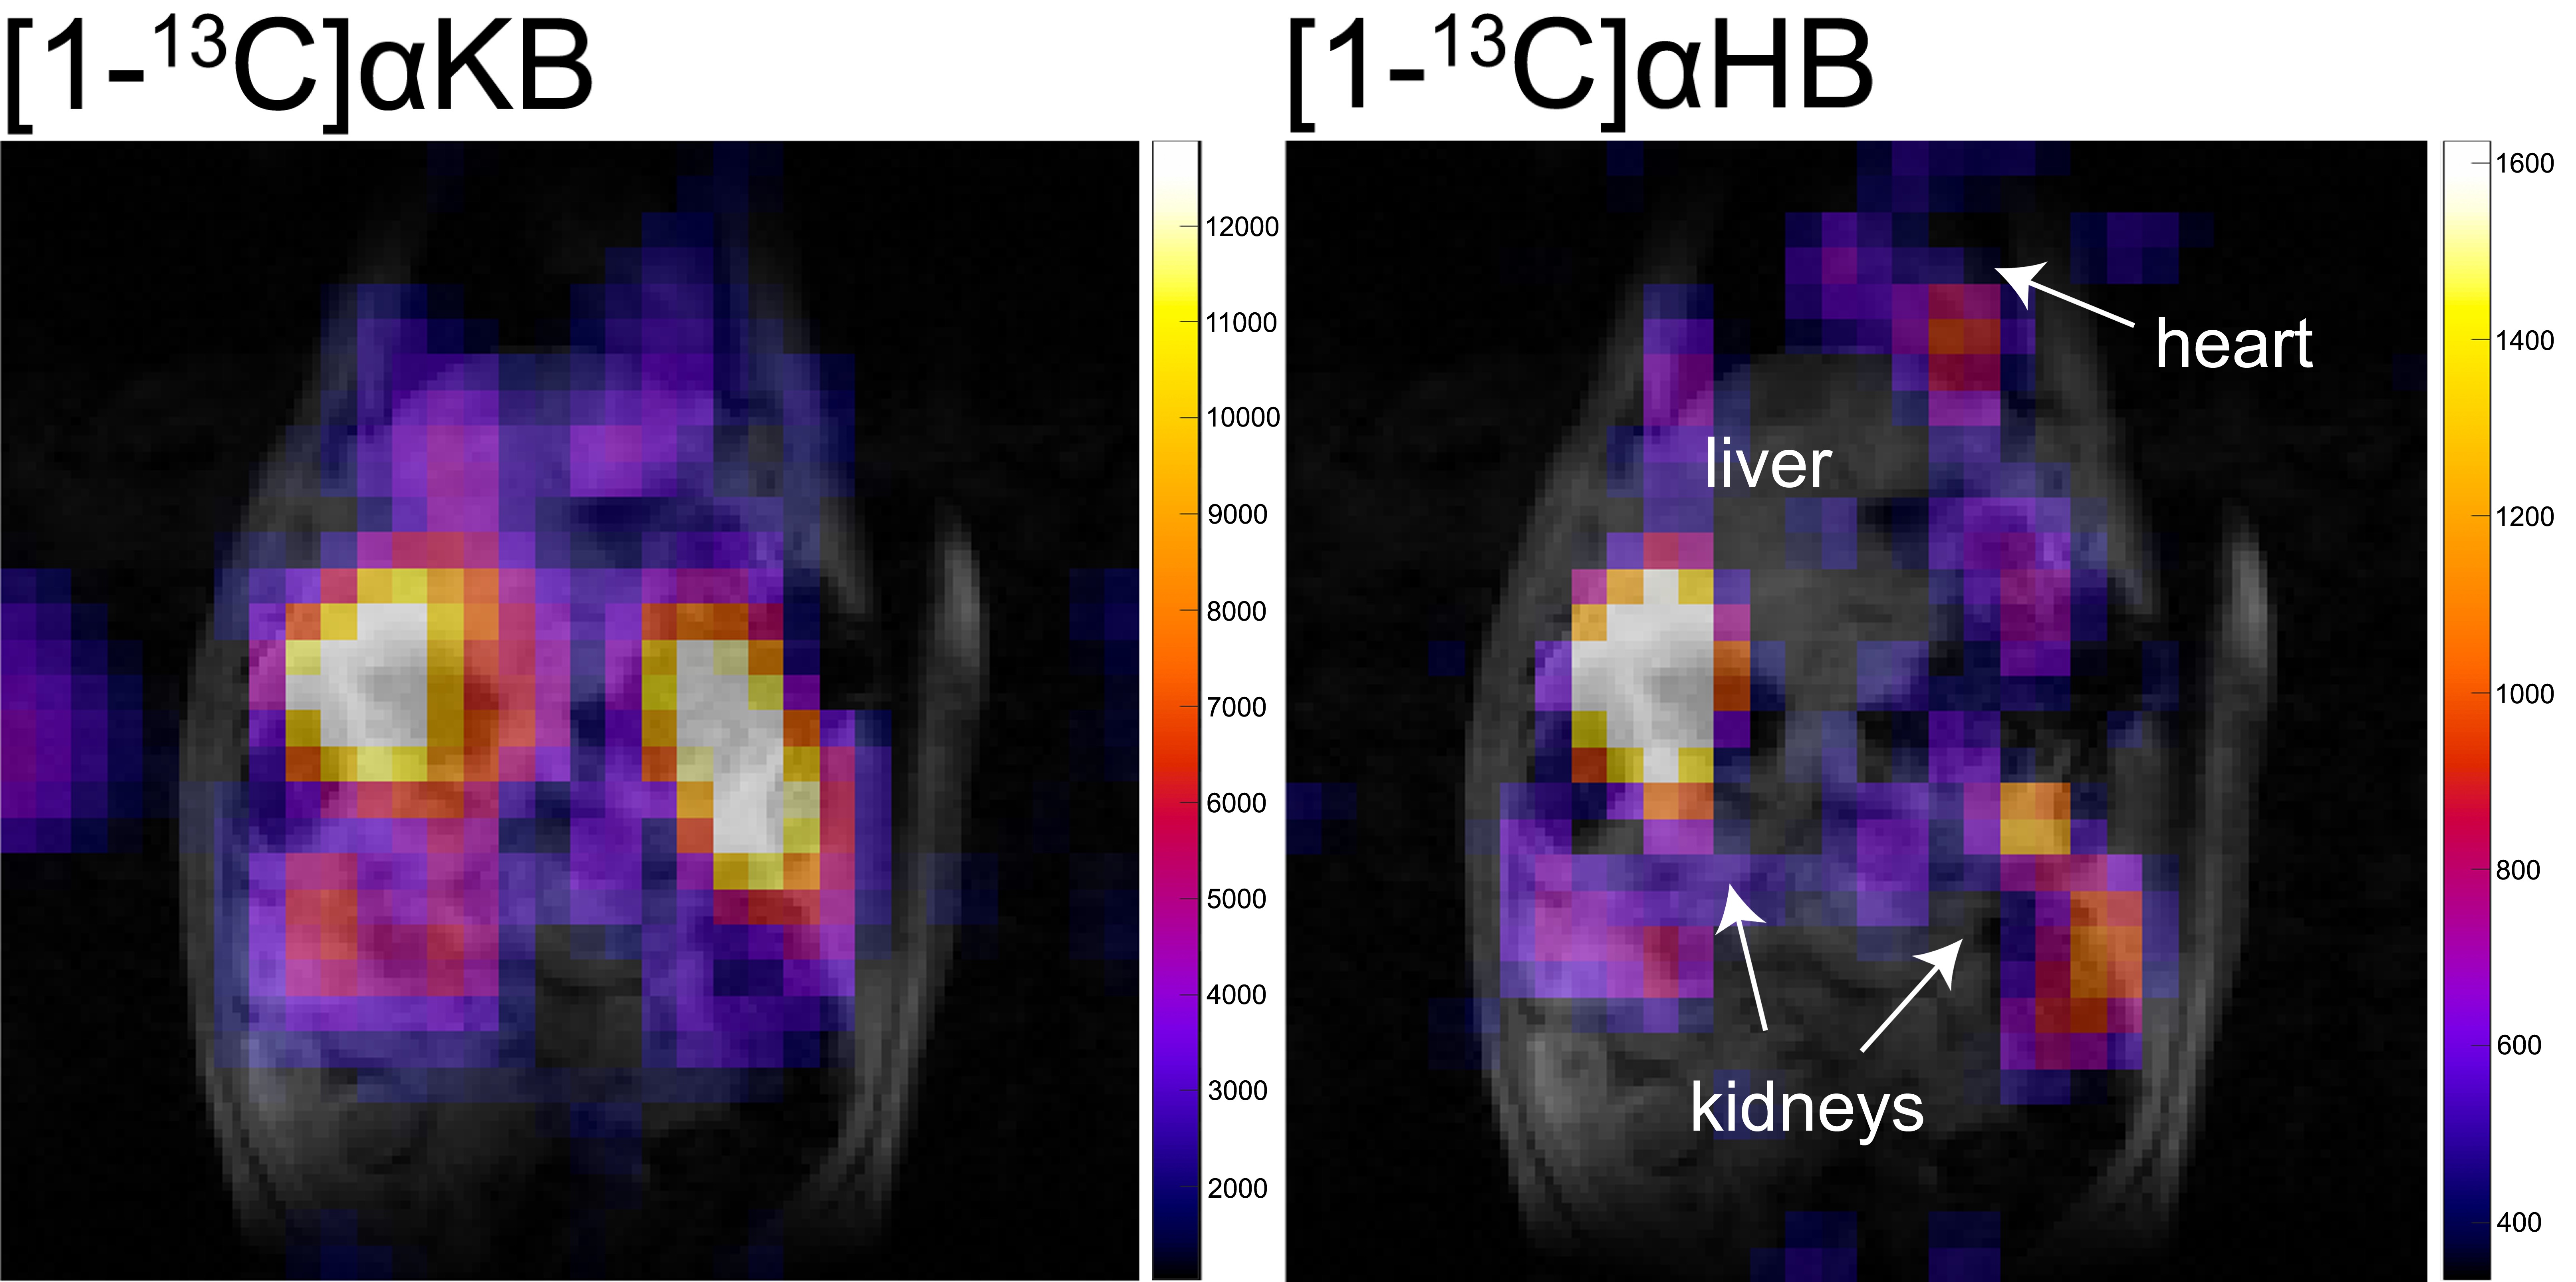
Figure 4. Multi-band SSRF EPSI imaging of HP pyruvate analog [1-13C]α-ketobutyrate (αKB) and its downstream metabolite α-hydroxybutyrate (αHB), in rat abdomen. Summed dynamic images are shown, overlaid on T1-weighted images for anatomic reference.
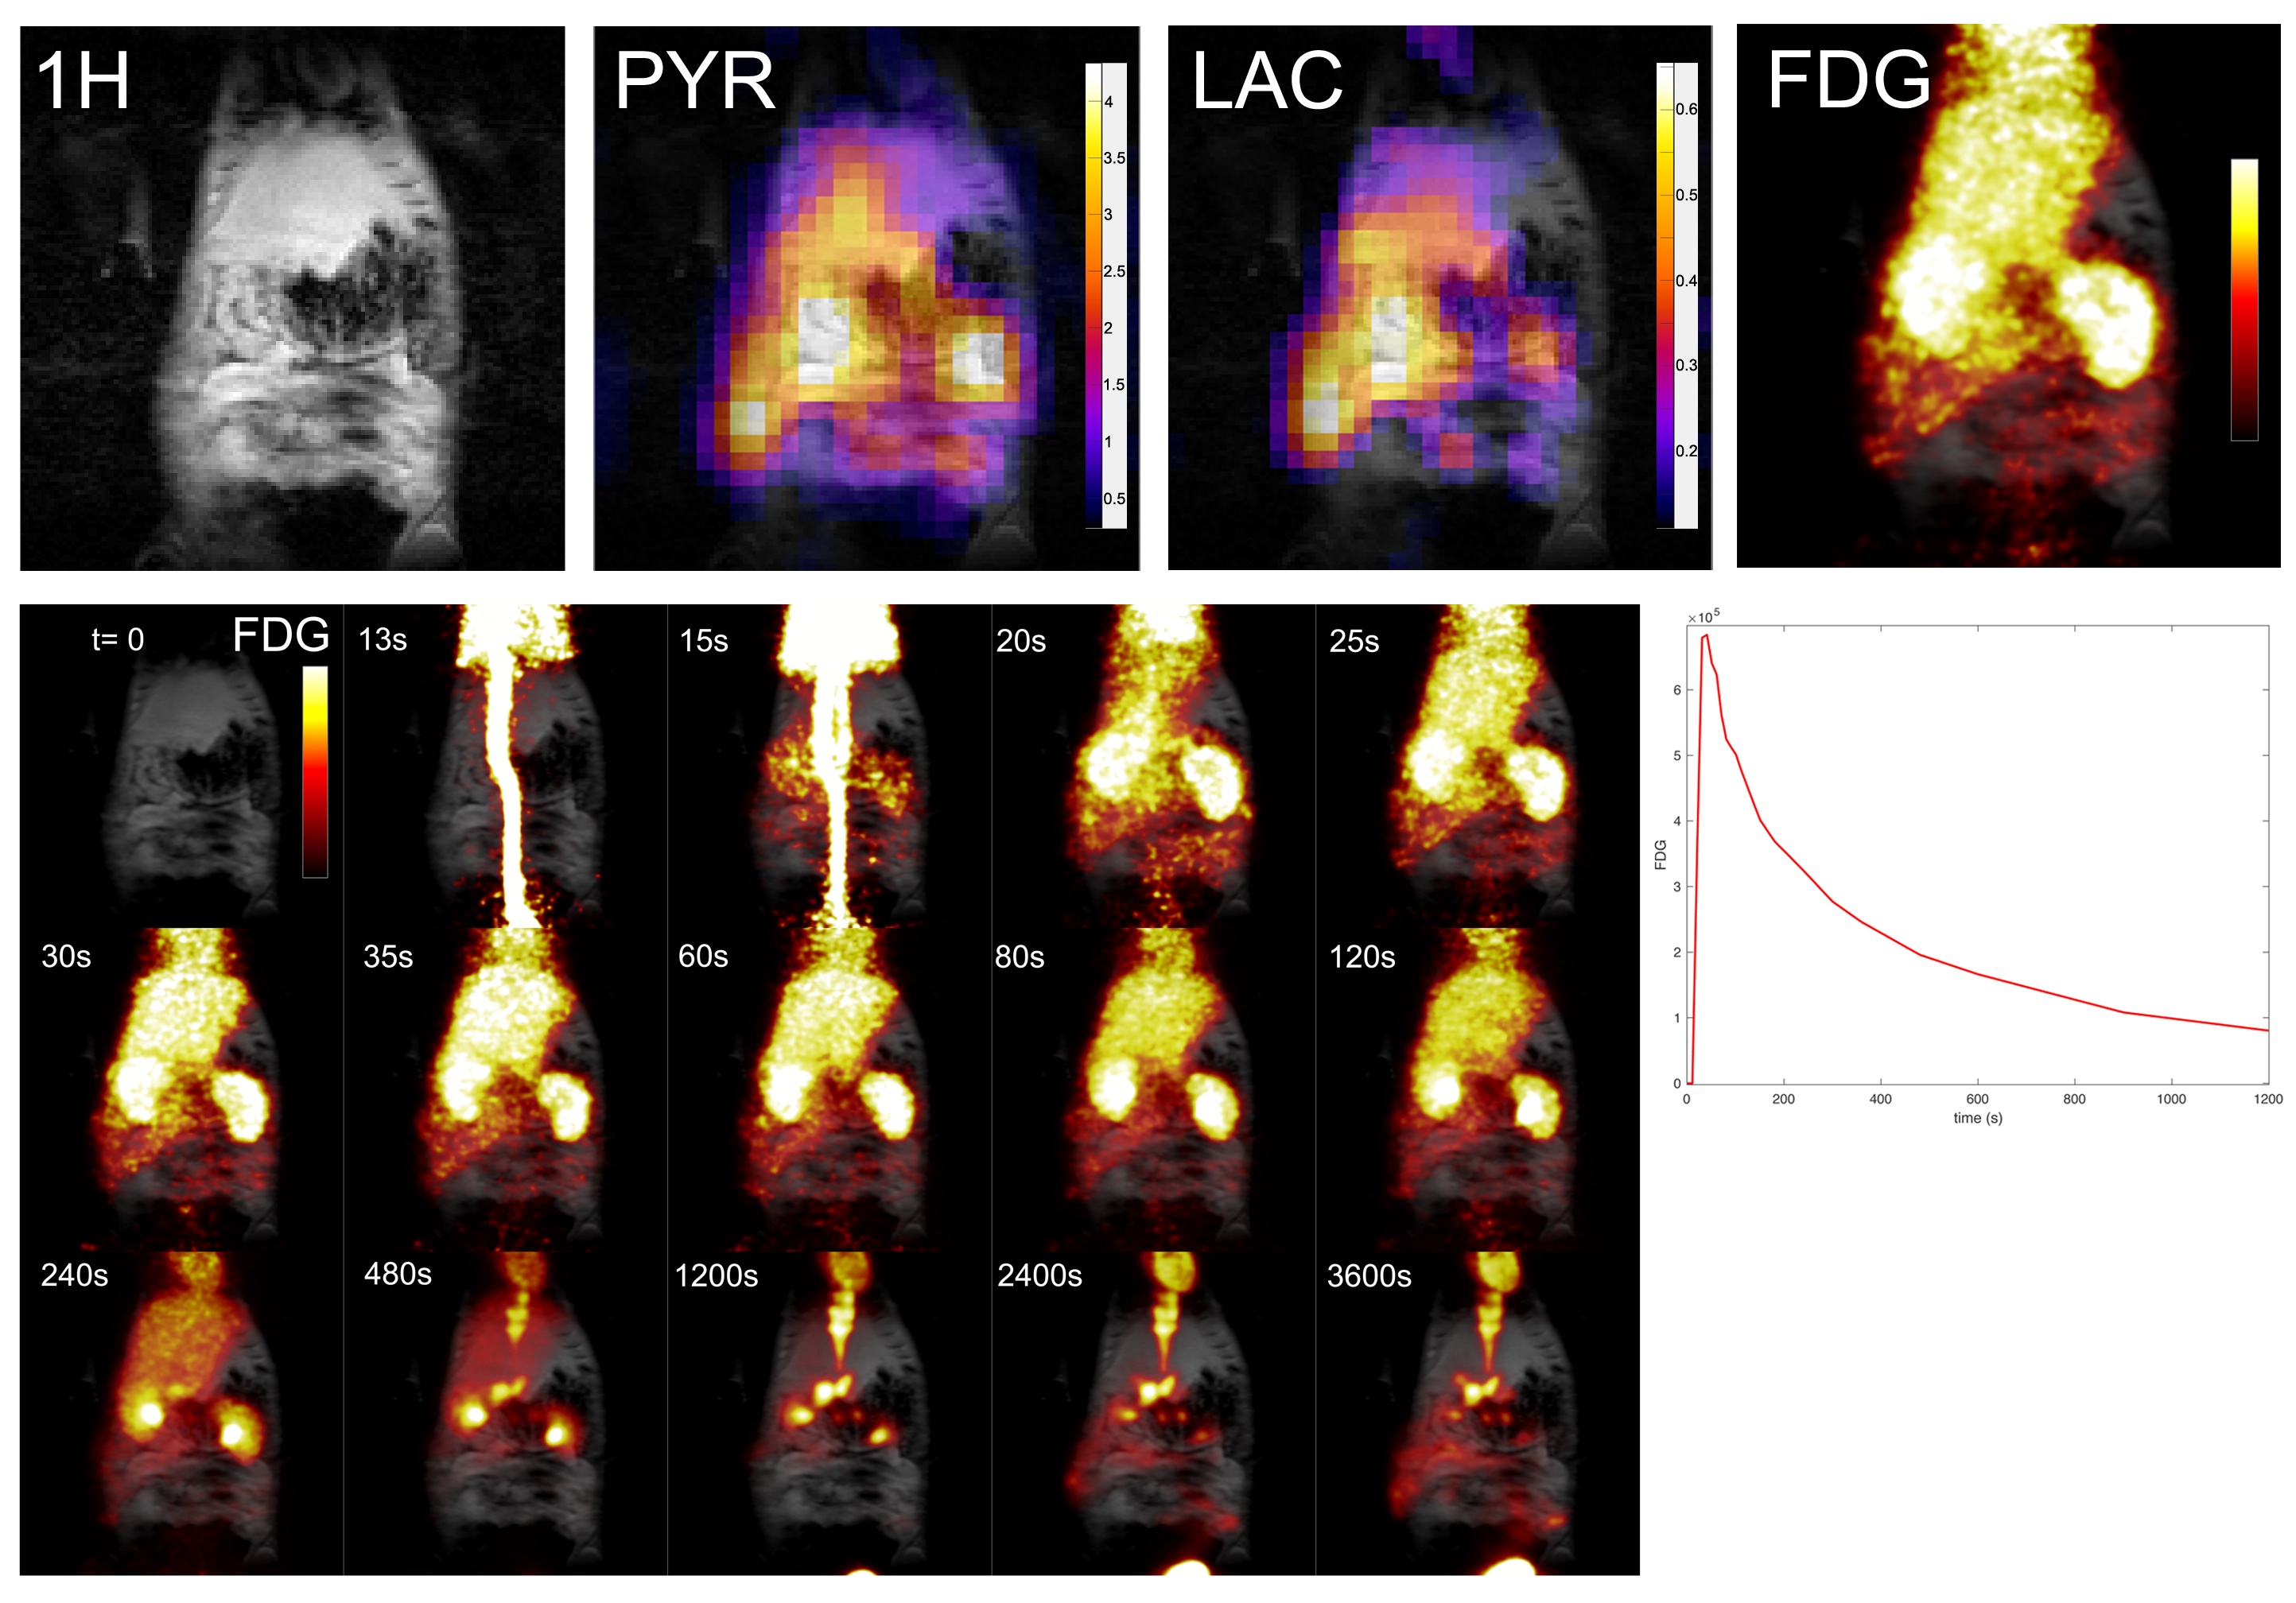
Figure 5. Multi-modal HP 13C and FDG-PET imaging of rat abdomen, from the same scan session. HP [1-13C]pyruvate and [1-13C]lactate are summed over the dynamic time course, while the FDG image is taken from the 40 s time point, similar to the HP results. PET data were maximum intensity projected to approximately match the 13C slice. Selected frames from dynamic FDG-PET series are shown below, with dynamic curve corresponding to liver ROI data, not corrected for tracer decay, over the first 20 min of data acquisition.