1795
Developing pattern recognition models to extract longitudinal network-based measures at an individual level
Elisa Colato1, Claudia AM Wheeler-Kingshott1,2,3, Douglas L Arnold4, Frederik Barkhof1,5,6,7, Olga Ciccarelli1,5, Declan Chard1,5, and Arman Eshaghi1,8
1Queen Square Multiple Sclerosis Centre, Department of Neuroinflammation, Queen Square Institute of Neurology, Faculty of Brain Sciences, University College London (UCL), London, United Kingdom, 2Brain MRI 3T Research Centre, C. Mondino National Neurological Institute, Pavia, Italy, 3Department of Brain and Behavioural Sciences, University of Pavia, Pavia, Italy, 4McConnell Brain Imaging Centre, Montreal Neurological Institute, McGill University, Montreal, QC, Canada, 5Institute for Health Research (NIHR), University College London Hospitals (UCLH) Biomedical Research Centre (BRC), London, United Kingdom, 6Department of Radiology and Nuclear Medici, VU medical centre, Amsterdam, Netherlands, 7Centre for Medical Image Computing (CMIC), Department of Medical Physics and Biomedical Engineering, University College London (UCL), London, United Kingdom, 8Centre for Medical Image Computing (CMIC), Department of Computer Science, University College London (UCL), London, United Kingdom
1Queen Square Multiple Sclerosis Centre, Department of Neuroinflammation, Queen Square Institute of Neurology, Faculty of Brain Sciences, University College London (UCL), London, United Kingdom, 2Brain MRI 3T Research Centre, C. Mondino National Neurological Institute, Pavia, Italy, 3Department of Brain and Behavioural Sciences, University of Pavia, Pavia, Italy, 4McConnell Brain Imaging Centre, Montreal Neurological Institute, McGill University, Montreal, QC, Canada, 5Institute for Health Research (NIHR), University College London Hospitals (UCLH) Biomedical Research Centre (BRC), London, United Kingdom, 6Department of Radiology and Nuclear Medici, VU medical centre, Amsterdam, Netherlands, 7Centre for Medical Image Computing (CMIC), Department of Medical Physics and Biomedical Engineering, University College London (UCL), London, United Kingdom, 8Centre for Medical Image Computing (CMIC), Department of Computer Science, University College London (UCL), London, United Kingdom
Synopsis
Network-based measures can outperform regional and whole-brain grey matter (GM) measures in explaining clinical disability in several neurodegenerative disorders. However, network measures are mostly estimated at the group level and require a re-estimation of model parameters when applied to new participants. Here, we introduce a new longitudinal network analysis paradigm to extract longitudinal ICA-like components at an individual level from a discovery cohort, applied machine learning to obtain individual-level network-based measure for a validation cohort, and used them to explain clinical disability in multiple sclerosis.
Introduction
Global assessment of changes in the pattern of grey matter (GM) volume loss is emerging as an alternative to region-based analysis of brain MRI1,2. These patterns, that are proxies for underlying brain networks, identify brain regions that share structural and pathophysiological variability3,4. Network-based measures can outperform regional and whole-brain GM measures in explaining clinical disability in neurodegenerative disorders1,5,6. Independent component analysis (ICA) is a well-established, data-driven technique that can be used to identify underlying covariations across variables, that are proxies for brain networks5,7. However, ICA networks are estimated at the group level, and when we apply ICA to new participants, we need to re-estimate the model parameters using the whole population, which is computationally cumbersome, and precludes network-based analysis in prospective and large datasets. Here we use multiple sclerosis (MS) clinical trials as an exemplar to show the utility and validity of a new set of models to address this key challenge. Most network-based studies in MS have been cross-sectional, while longitudinal network-based measures are needed to determine the longitudinal evolution of brain network organization and how these changes are related to the clinical disability over time.Purpose
We aimed to introduce a new longitudinal network analysis paradigm to extract longitudinal ICA-like components at an individual level, without the need to re-fit ICA each time on the whole population. Our secondary aim was to validate the resulting individualised model by assessing relationships between the estimated longitudinal network components with concomitant clinical changes.Methods
We used longitudinal MRI and clinical data from 5089 participants (22045 visits) with MS from 8 clinical trials8–14. We split the data into discovery (2674 participants, 1322 visits, five clinical trials) and validation (2235 participants, 8864 visits, three clinical trials) cohorts. We corrected T1 images for scanner inhomogeneities using N4 bias field correction toolbox15; filled T1 hypointensities to reduce segmentation error16–18, segmented the brain into 110 GM regions, and estimated the volume of each brain region (Figure 1). We applied the FastICA algorithm19 to identify patterns of covarying GM brain regions and obtain a network-based measure for each participant and each timepoint from the discovery cohort. We used machine learning (ML) by training a Lasso regression model on a train set (70% of discovery cohort) and cross-validated it on the remaining 30% of the discovery cohort by estimating network measures for each ICA pattern in this set. We used two evaluation metrics (Root Mean Squared Error [RMSE] and R2] to evaluate the model performance. RMSE represents the standard deviation residuals (i.e. distance between predicted network-based values and actual network-based values) and is a direct measure of prediction errors (i.e., the lower the values the better). R2 indicates the goodness of fit of the model, showing how close the values are to the regression line. We applied mixed effect models, where the expanded disability status scale (EDSS, a measure of disability in MS) score was the outcome variable, networks and the interaction between networks and time were fixed effects, and subject and time were the random effects. We used the R2 associated with each mixed effect model to determine the proportion of the variance in the EDSS explained by each model. We repeated the analysis for the validation cohort, using the network-based measures obtained through the ML model. We applied Bonferroni correction to account for multiple comparisons.Results
We found 20 patterns of covarying GM regions and obtained network-based measures for each participant and each timepoint of the discovery cohort (Figure 2).Lasso training performance had RMSE values between 2.21 and 28.34, and R2 > 0.99.
In the discovery cohort, seven networks of covarying GM volumes explained the clinical disability in MS (e.g. network 5: β = -0.16, se = 0.02, p < 0.0001). Higher disability (higher EDSS scores) was associated with lower GM network measures (lower GM volumes). Three networks (network 6, network 17, and network 20) could explain EDSS over time (respectively, β = -0.02, se = 0.004, p < 0.0001; β = -0.013, se = 0.004, p < 0.0005; β = -0.02, se = 0.04, p < 0.005). Models having these three networks and their interaction with time as fixed effect, and participants and time as random effects, explained the 93% of the variance in the EDSS.
Network-based measures were also clinically relevant in the validation cohort. Seven GM networks explained the clinical disability in MS (e.g., network 5: β = -0.22, se = 0.03, p < 0.0001), and network 4 did so also over time (β = -0.03, se = 0.01, p < 0.0005). The model having network 4 and its interaction with time as fixed effects, and participant and time as random effects, explained the 90% of the variance in the EDSS.
Network components can be extracted at an individual level without the need for re-fitting ICA in the whole population when new data is used. Our longitudinal network estimation model opens the possibility of using such network measures prospectively. These longitudinal network components may help in monitoring the disease and complement regional or whole brain MRI volume measurements.
Acknowledgements
This investigation was supported (in part) by (an) award(s) from the International Progressive MS Alliance, award reference number PA-1412-02420References
- Steenwijk MD, Geurts JJG, Daams M, et al. Cortical atrophy patterns in multiple sclerosis are non-random and clinically relevant. Brain. 2016;139(1):115-126. doi:10.1093/brain/awv337
- Bergsland N, Horakova D, Dwyer MG, et al. Gray matter atrophy patterns in multiple sclerosis: A 10-year source-based morphometry study. NeuroImage Clin. 2018;17(November 2017):444-451. doi:10.1016/j.nicl.2017.11.002
- Bullmore E, Sporns O. Complex brain networks: graph theoretical analysis of structural and functional systems. Nat Rev Neurosci. 2009;10(3):186-198. doi:10.1038/nrn2575
- Smith S, Duff E, Groves A, et al. Structural variability in the human brain reflects fine-grained functional architecture at the population level. J Neurosci. 2019;39(31):6136-6149. doi:10.1523/JNEUROSCI.2912-18.2019
- Colato E, Stutters J, Tur C, et al. Predicting disability progression and cognitive worsening in multiple sclerosis with gray matter network measures Radiological advances i (NAIMS/MAGNIMS). Mult Scler J. 2020;26(3 SUPPL):22-23. doi:10.1136/jnnp-2020-325610
- Pardini M, Yaldizli Ö, Sethi V, et al. Motor network efficiency and disability in multiple sclerosis. Neurology. 2015;85(13):1115-1122. doi:10.1212/WNL.0000000000001970
- Pichet Binette A, Gonneaud J, Vogel JW, et al. Morphometric network differences in ageing versus Alzheimer’s disease dementia. Brain. 2020;143(2):635-649. doi:10.1093/brain/awz414
- Spain R, Powers K, Murchison C, et al. Lipoic acid in secondary progressive MS. Neurol Neuroimmunol NeuroInflammation. 2017;4(5). doi:10.1212/NXI.0000000000000374
- Montalban X, Hauser SL, Kappos L, et al. Ocrelizumab versus placebo in primary progressive multiple sclerosis. N Engl J Med. 2017;376(3):209-220. doi:10.1056/NEJMoa1606468
- Chataway J, De Angelis F, Connick P, et al. Efficacy of three neuroprotective drugs in secondary progressive multiple sclerosis (MS-SMART): a phase 2b, multiarm, double-blind, randomised placebo-controlled trial. Lancet Neurol. 2020;19(3):214-225. doi:10.1016/S1474-4422(19)30485-5
- Hawker K, O’Connor P, Freedman MS, et al. Rituximab in patients with primary progressive multiple sclerosis: Results of a randomized double-blind placebo-controlled multicenter trial. Ann Neurol. 2009;66(4):460-471. doi:10.1002/ana.21867
- Gold R, Kappos L, Arnold DL, et al. Placebo-Controlled Phase 3 Study of Oral BG-12 for Relapsing Multiple Sclerosis. N Engl J Med. 2012;367(12):1098-1107. doi:10.1056/nejmoa1114287
- Hauser SL, Bar-Or A, Comi G, et al. Ocrelizumab versus Interferon Beta-1a in Relapsing Multiple Sclerosis. N Engl J Med. 2017;376(3):221-234. doi:10.1056/nejmoa1601277
- Kapoor R, Ho PR, Campbell N, et al. Effect of natalizumab on disease progression in secondary progressive multiple sclerosis (ASCEND): a phase 3, randomised, double-blind, placebo-controlled trial with an open-label extension. Lancet Neurol. 2018;17(5):405-415. doi:10.1016/S1474-4422(18)30069-3
- Tustison NJ, Avants BB, Cook PA, et al. N4ITK : Improved N3 Bias Correction. Published online 2010:1310-1320.
- Carass A, Roy S, Jog A, et al. Longitudinal multiple sclerosis lesion segmentation data resource. Data Br. 2017;12:346-350. doi:10.1016/j.dib.2017.04.004
- Sudre CH, Cardoso MJ, Bouvy WH, Biessels GJ, Barnes J, Ourselin S. Bayesian Model Selection for Pathological Neuroimaging Data Applied to White Matter Lesion Segmentation. IEEE Trans Med Imaging. 2015;34(10):2079-2102. doi:10.1109/TMI.2015.2419072
- Prados F, Cardoso MJ, Kanber B, et al. A multi-time-point modality-agnostic patch-based method for lesion filling in multiple sclerosis. Neuroimage. 2016;139:376-384. doi:10.1016/j.neuroimage.2016.06.053
- Hyvärinen A, Oja E. Independent Component Analysis: Algorithms and Applications. Vol 13.; 2000.
Figures
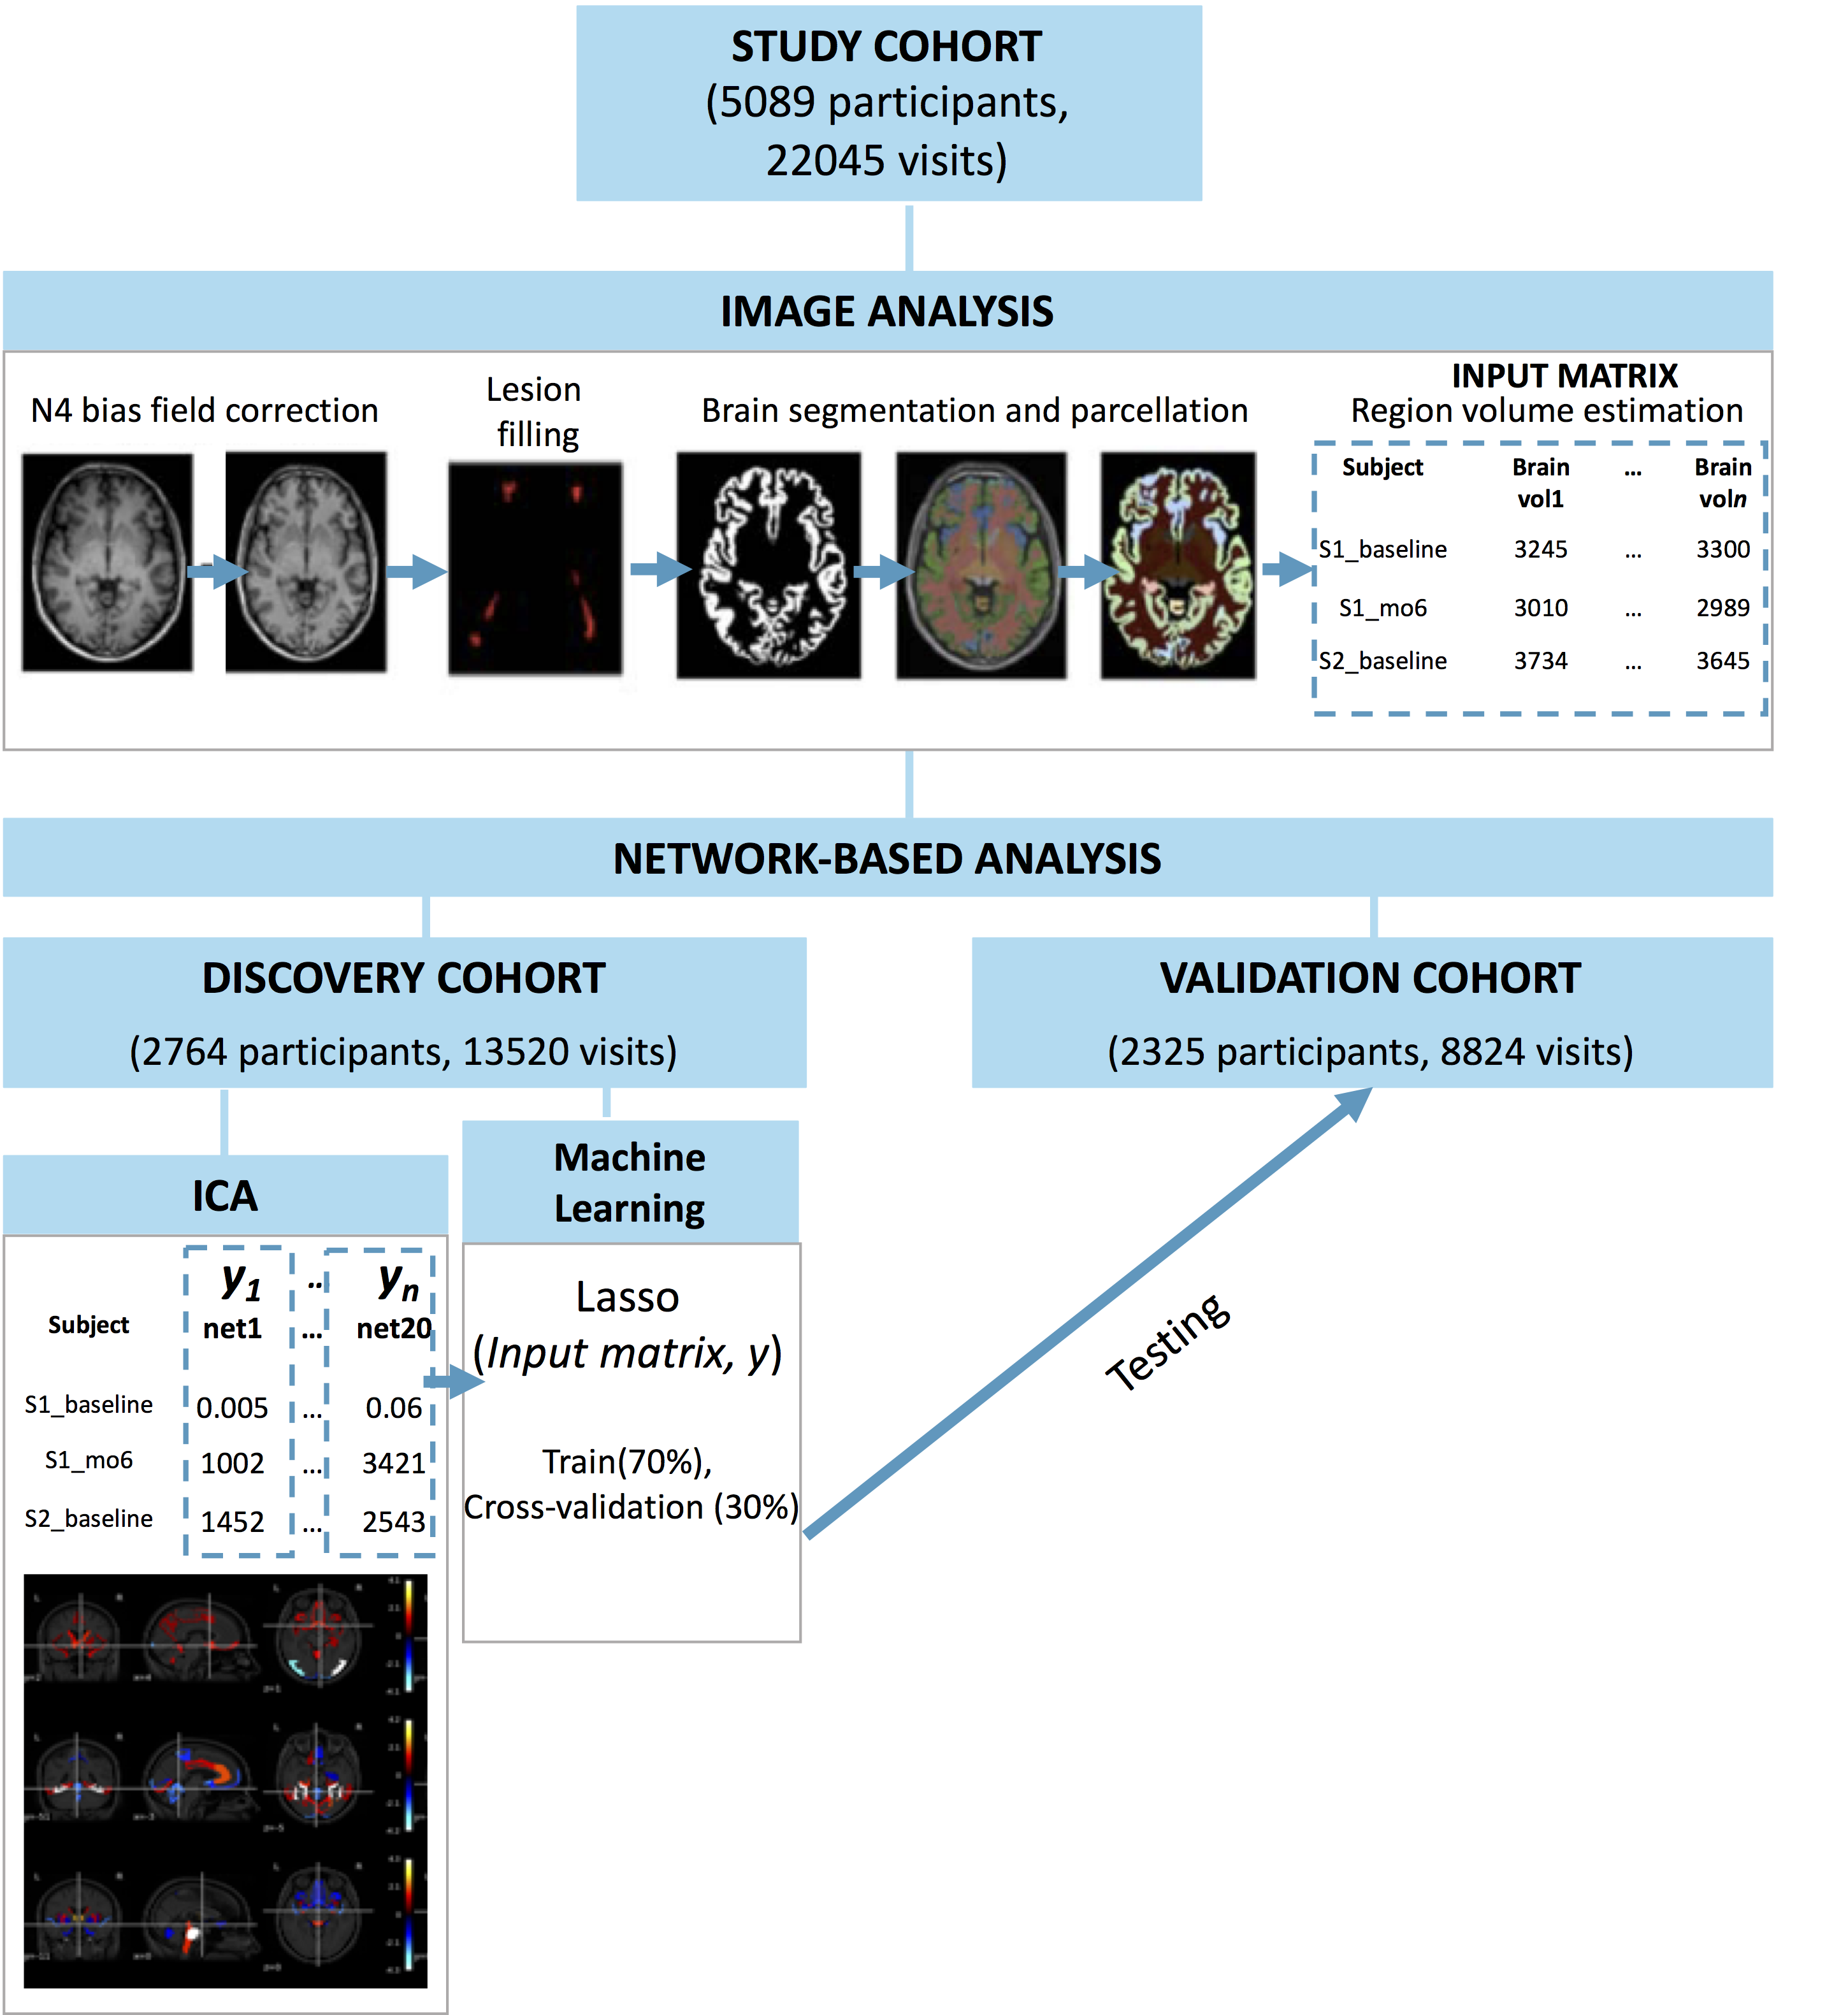
Figure 1. Visual
representation of our study design. We applied spatial ICA to extract
longitudinal network-based measures from GM regional volumes. We used a machine
learning model (Lasso) to obtain individual-level network-based measures for
participants from the validation cohort.
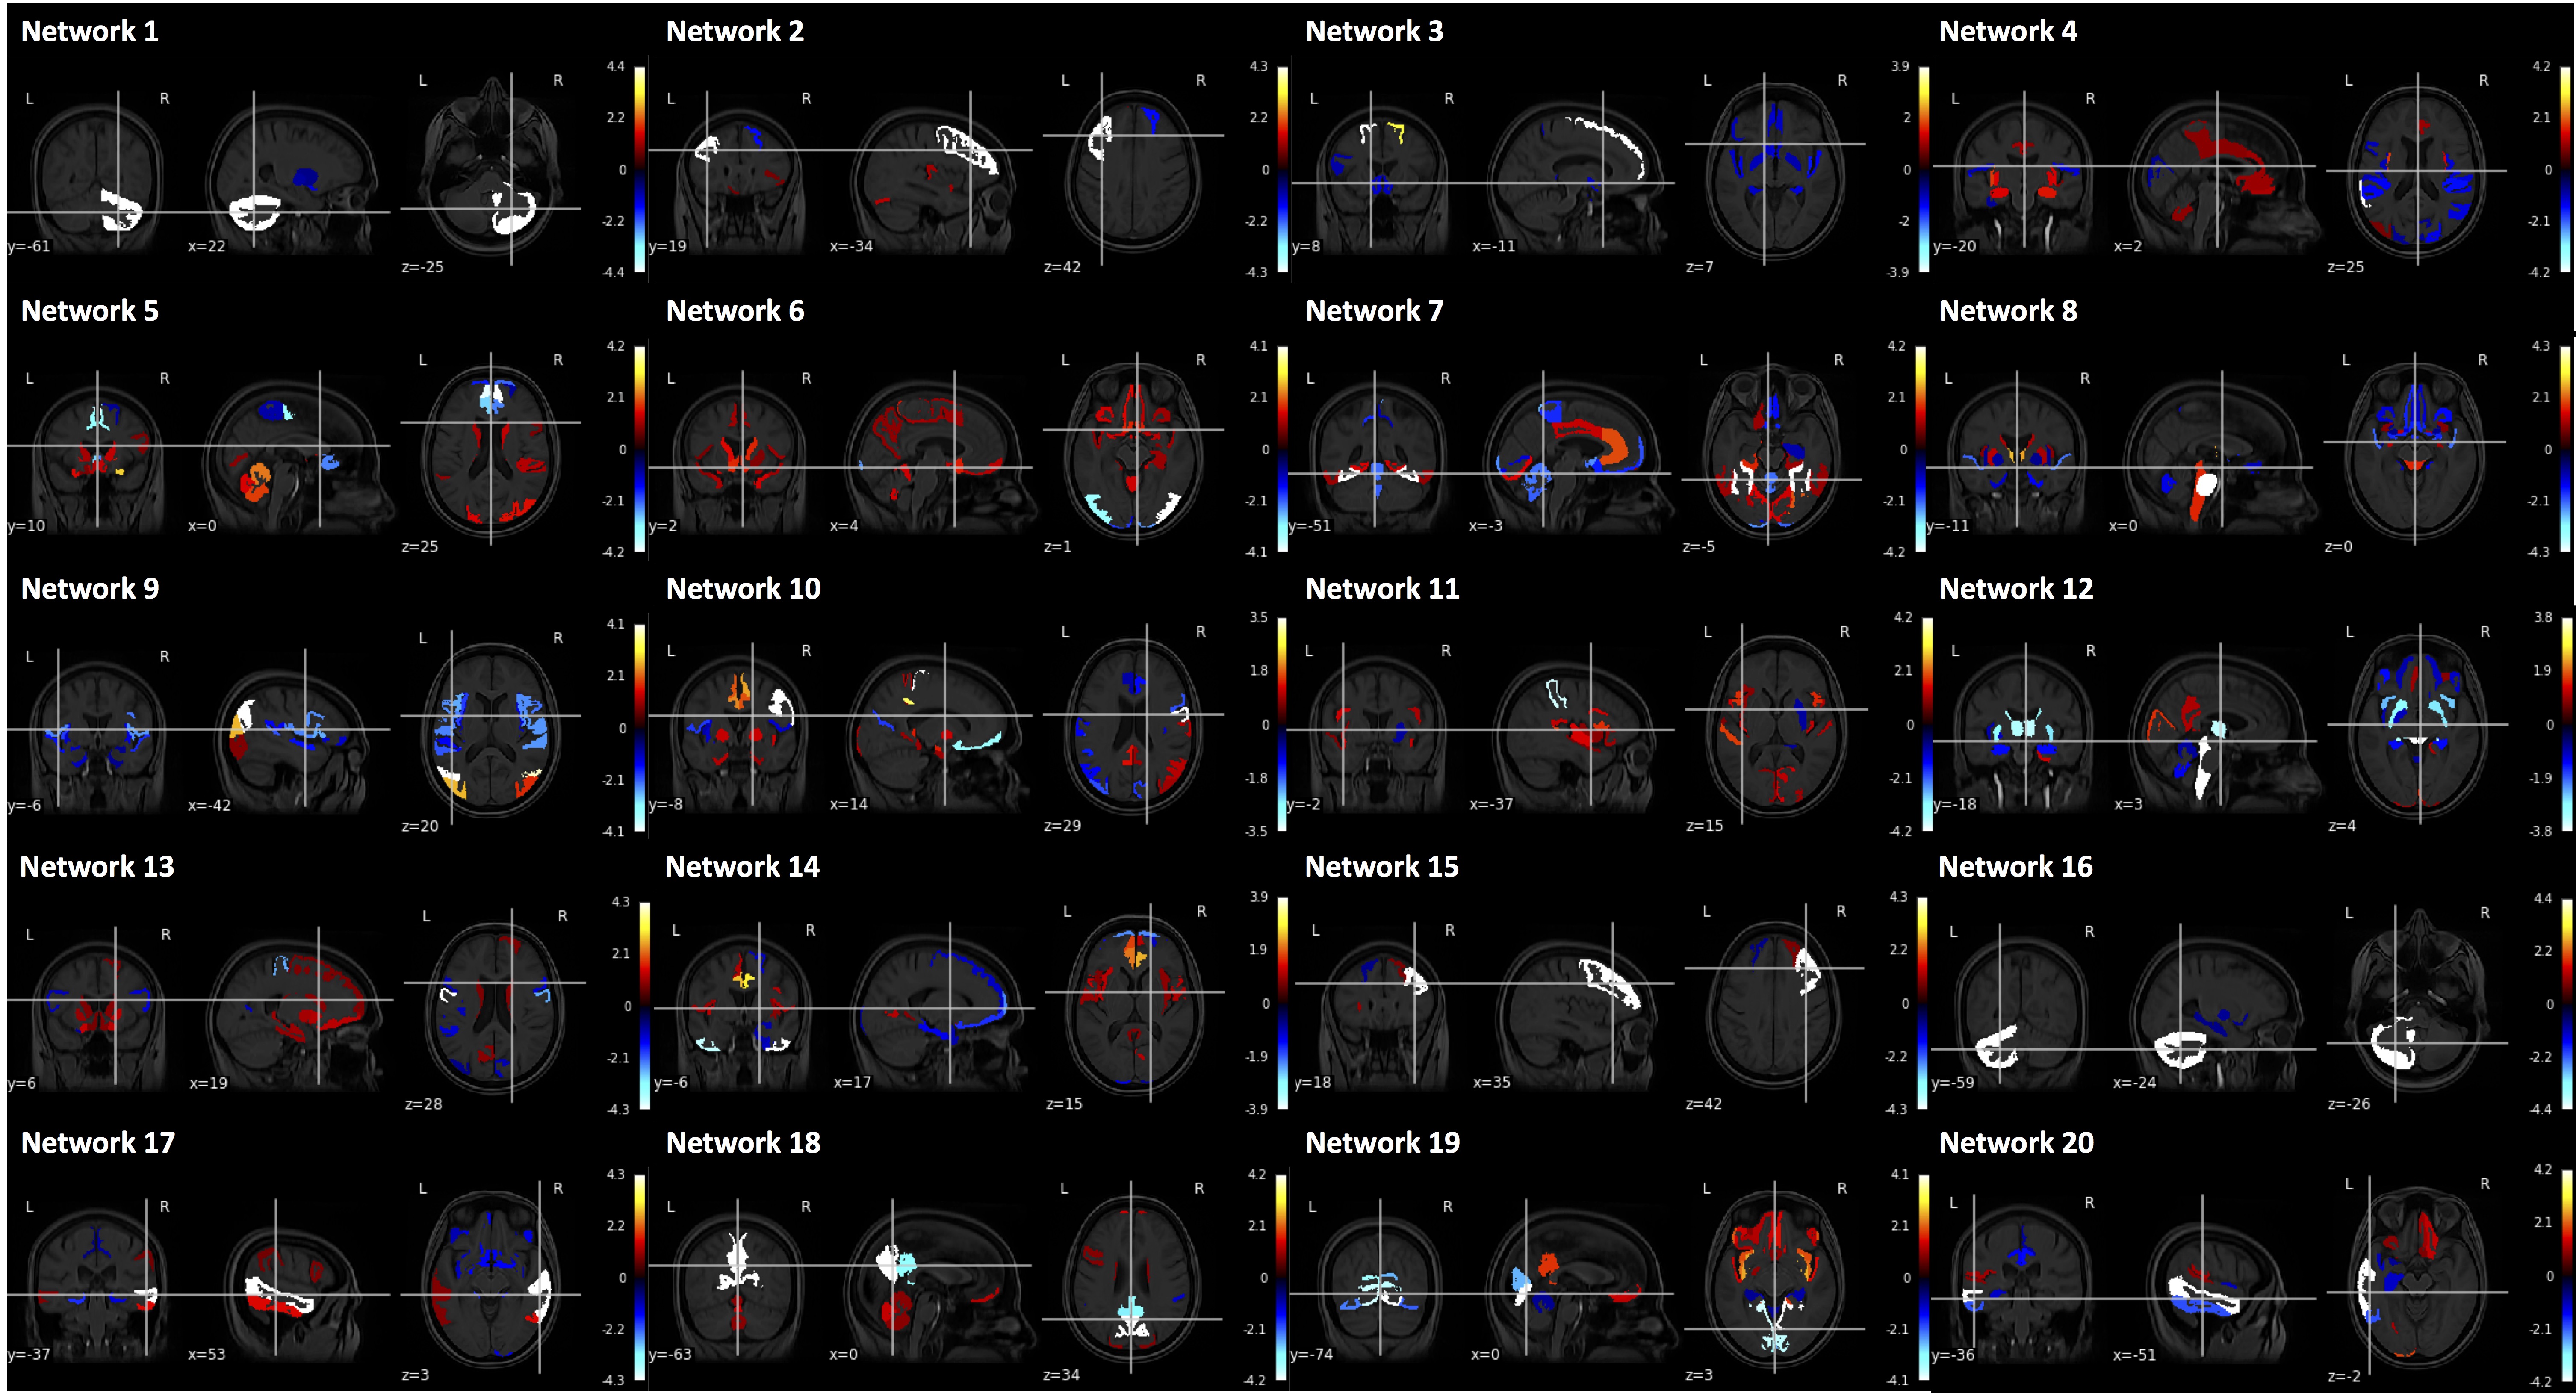
Figure 2. 20 networks of
covarying GM regions.
DOI: https://doi.org/10.58530/2022/1795