1792
Grey Matter Connectome Data Analysis and Classification of Multiple Sclerosis Clinical Profiles1CREATIS (UMR5220 CNRS & U1294 INSERM, Université Claude Bernard-Lyon1 & INSA-Lyon, France, Villeurbanne, France, 2R&D Department CGnal Milan, Italy, Villeurbanne, France, 3KU Leuven, Leuven, Belgium, 4CREATIS (UMR5220 CNRS & U1294 INSERM), Université Claude Bernard-Lyon1 & INSA-Lyon, France, Villeurbanne, France
Synopsis
Multiple Sclerosis (MS) is an autoimmune inflammatory disease characterized by white matter (WM) lesions and gray matter (GM) degeneration leading to cognitive and physical impairments. Recently, brain connectivity techniques were developed to better characterize such brain damages in association with the clinical profiles of MS patients. In this study, we proposed a complete automated pipeline to first extract global graph metrics from the morphological brain connectivity based on GM tissue thickness and second to train a higher-level ensemble of four machine learning models for the classification of MS clinical profiles using only the T1-weighted image modality.
Introduction
Multiple sclerosis (MS) is an autoimmune inflammatory disease characterized by demyelination and neurodegeneration processes of the central nervous system, leading to cognitive and physical impairments and it represents one of the most disabling conditions in young adults1. Brain connectivity constitutes a new important approach for characterizing brain networks given its capability to represent complex relations among different areas of the brain2. Although fMRI and DTI represent the most common modalities for connectome data analysis, these acquisitions are often missing in clinical routines due to long acquisition time and complex processing techniques. More recently, immunohistochemical studies have provided compelling evidence that grey matter (GM) alteration in MS is extensive and clinically relevant3. Therefore, we propose in this work to exploit the power of connectome approaches to measure the morphological connectivity based on GM thickness using anatomical T1-weighted images. In this context, nodes represent cortical areas obtained from the GM parcellation, while edges represent a degree of (dis)-similarity between two GM regions. This new paradigm was exploited in this study for the classification of MS clinical profiles using global connectome graph features as input for training an ensemble of four Machine Learning (ML) models.Methods
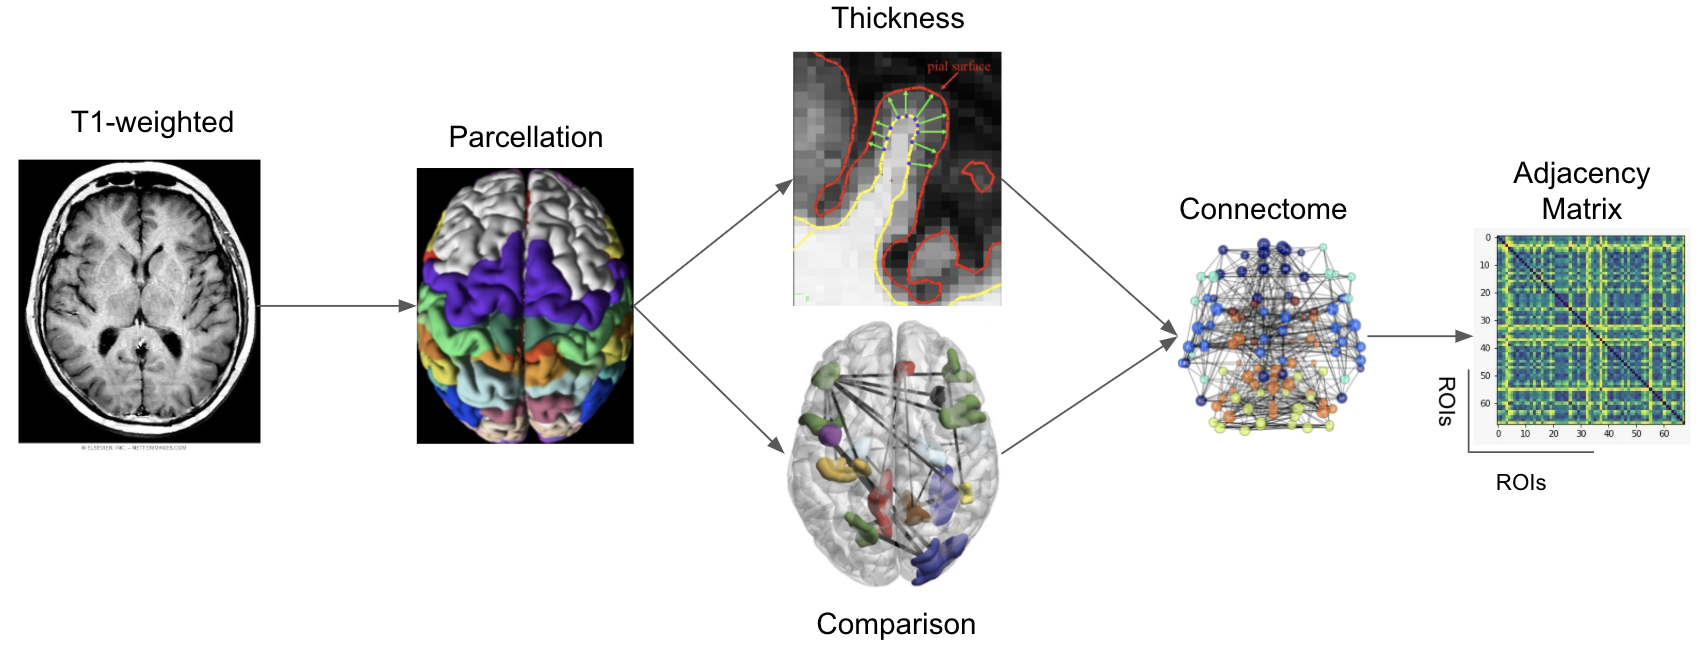
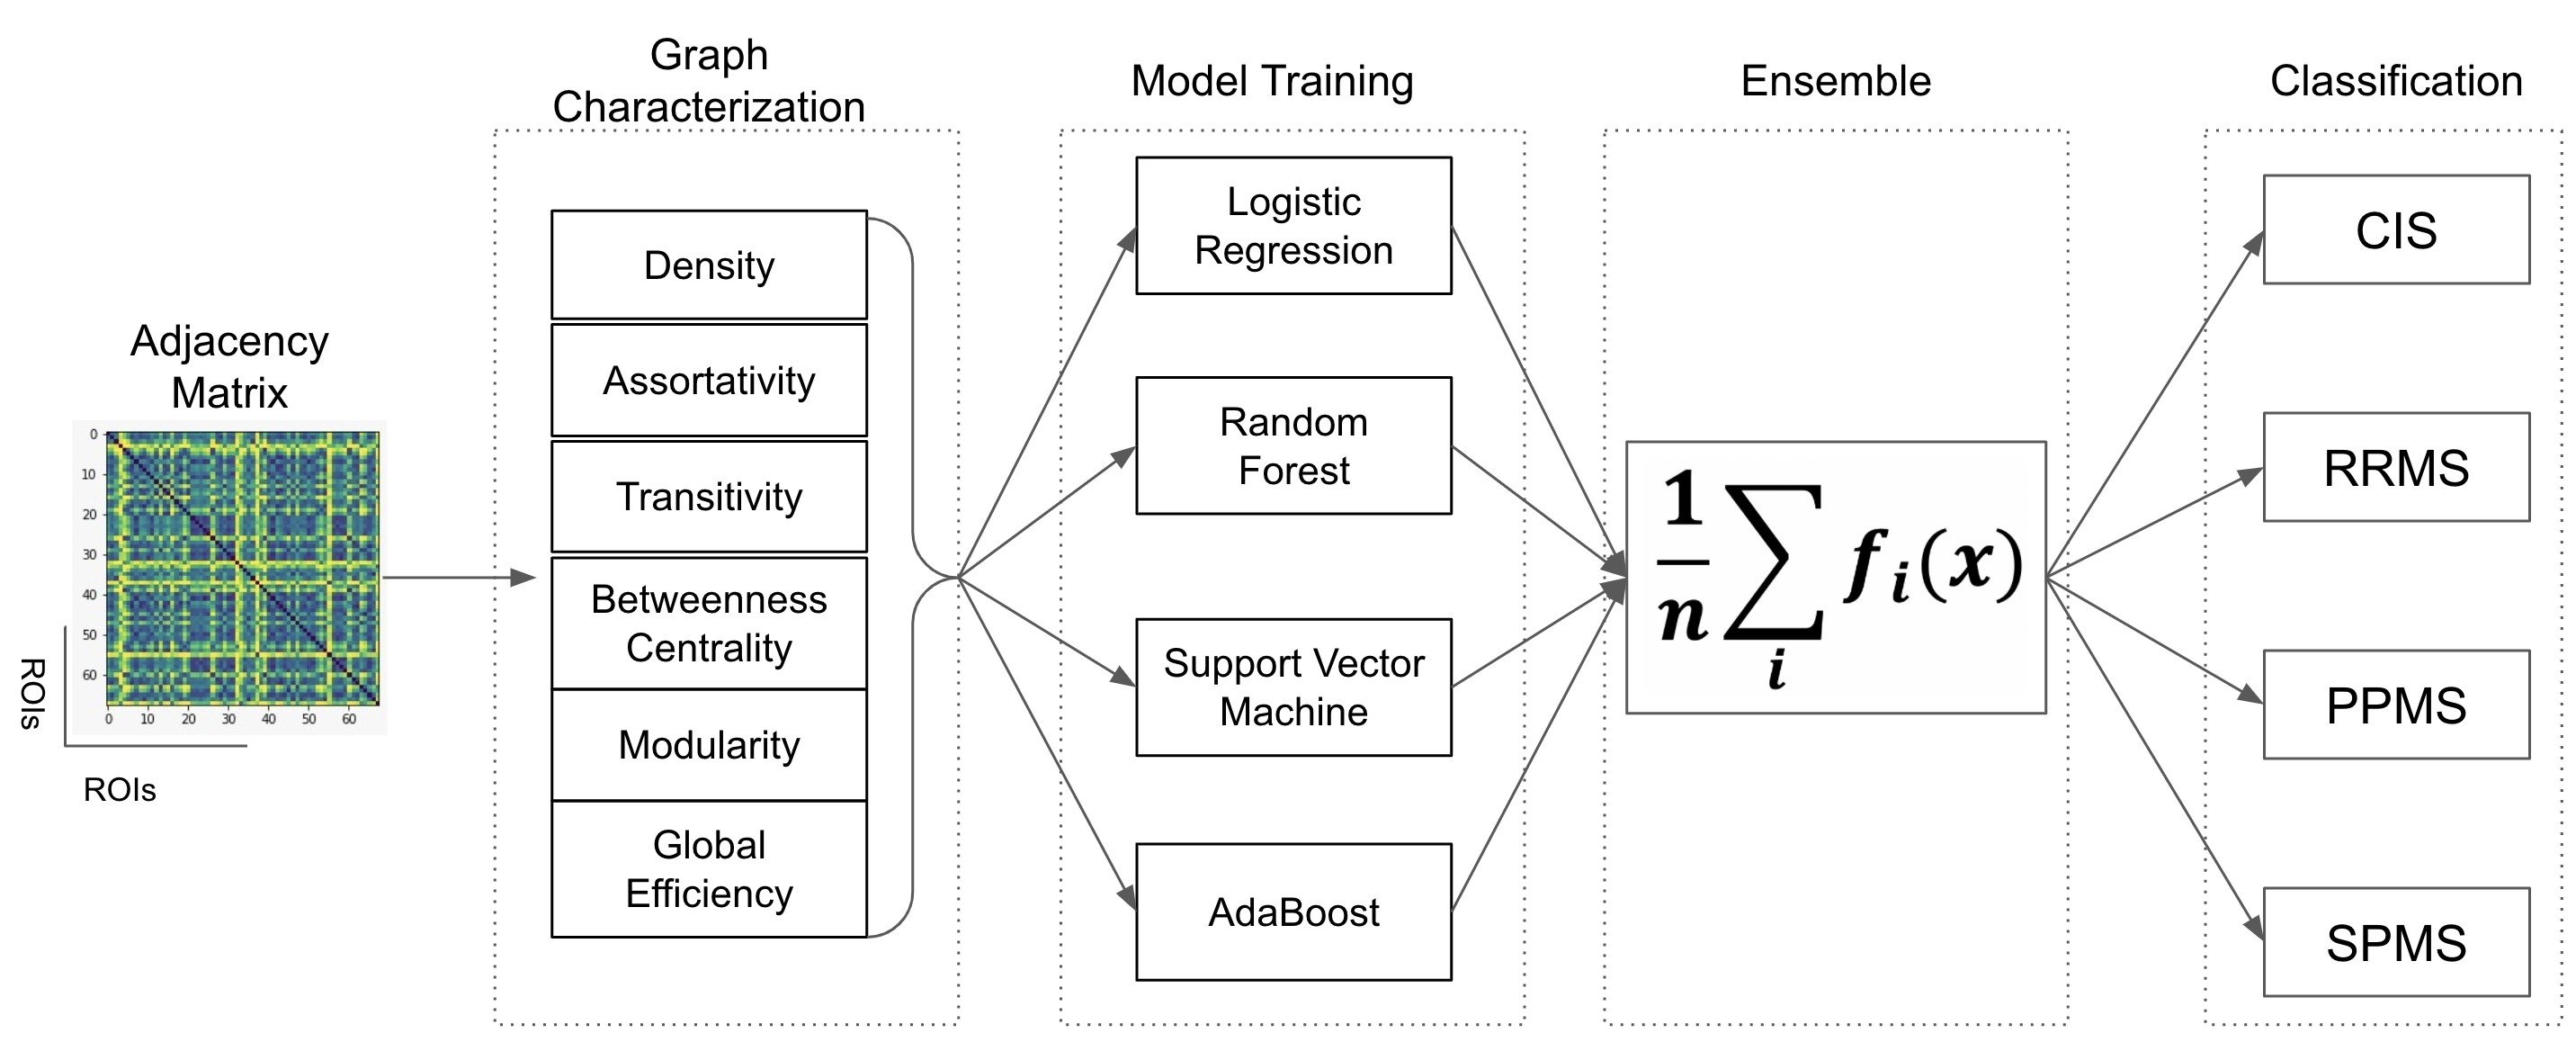
Ninety patients, distributed in four clinical profiles (12 CIS, 30 RRMS, 28 SPMS, 20 PPMS) underwent an MR examination on a 1.5T Siemens Sonata system (Siemens Medical Solution, Erlangen, Germany). The MRI protocol was composed of a 3-dimensional T1-weighted MPRAGE sequence with repetition time/echo time/time for inversion (TR/TE/TI) = 1970/3.93/1100 ms, flip angle = 15°, voxel size = 1×1×1. After pre-processing, the parcellation task was performed using the FSAverage atlas4, yielding 64 regions in total. Afterward, each voxel was classified into four classes [WM, cortical GM, sub-cortical GM, cerebrospinal fluid (CSF)] and the thickness morphometric feature was calculated using Freesurfer image analysis suite5. The connectome data was obtained comparing all GM regions, employing the Manhattan distance as dissimilarity metric6 (Figure 1). From the GM graphs, six global graph metrics were extracted, such as Graph Density (D), Assortativity (r), Transitivity (T), Global Efficiency (Eg), Betweenness Centrality (BC) and Modularity (Q). Additionally, four different ML methods (Logistic Regression (LR), Random Forest (RF), Support Vector Machine (SVM) and Adaptive Boosting Machine (AdaBoost)) were combined together, forming a higher-level ensemble model by averaging their prediction results and used for the classification task of MS clinical profiles (Figure 2).Results
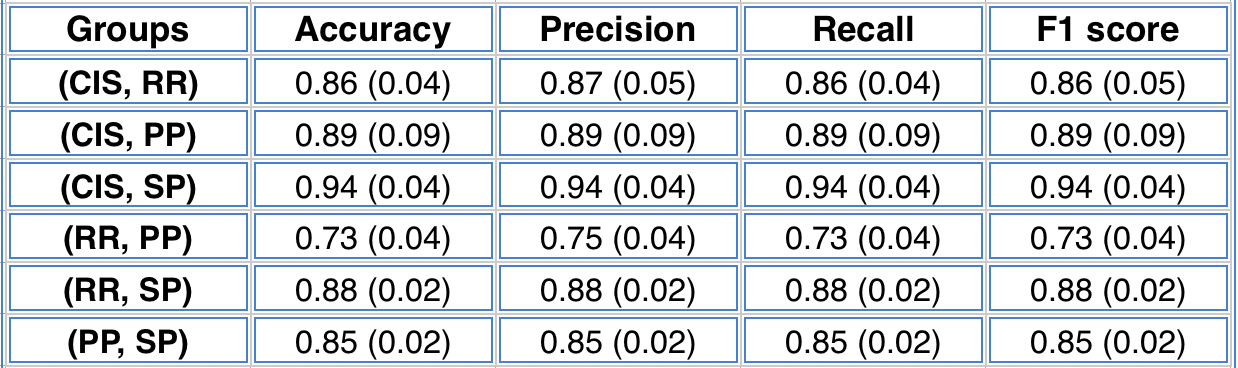
From the proposed approach, interesting levels of classification scores were observed. The ensemble model provided classification performances higher than 0.7 for all MS binary comparisons (Table 1). The highest classification score was obtained comparing CIS and SPMS groups with an F1 score of 0.94. The lowest value was observed comparing RRMS and PPMS, with an F1 score of 0.73.Discussion
Good levels of classification performances were obtained combining ML models with connectome data representation of the human brain. The highest classification score was obtained comparing CIS and SPMS, as CIS represents the initial phase and SPMS the most advanced phase of the disease. The observed reduced node centrality and modularity are probably characterizing progressive courses with the highest level of brain damage7. Conversely, the lower discrimination between RRMS and PPMS could be explained by the varying inflammatory and demyelination processes characterizing these two starting MS forms8. Additionally, our results were coherent with a previous study9, increasing the confidence in the proposed approach.Conclusion
Although MS is mainly considered as an inflammatory and demyelinating WM disease, it also exhibits extensive GM involvement and neurodegenerative processes. The use of ML models, combined with the power of brain connectomics, can provide an important advantage for the classification of MS clinical phenotypes when only T1w images are available.Acknowledgements
This study was funded by the following projects: European Research Council within the grant 813120-2018 of Marie Sklodowska-Curie Innovative Training Networks (ITN) of the Horizon 2020 through the INSPiRE-MED project. French National Research Agency (ANR) within the national program “Investissements d’Avenir” through the OFSEP project (ANR-10-COHO-002). Also, this research received funding from the Flemish Government (AI Research Program). SVH is affiliated to KU Leuven institute for AI, B-3000, Leuven, Belgium. This material is based upon work done on the PILoT facility (PILoT, INSA LYON, Bât. L. de Vinci, 21 Av. Jean Capelle 69621 Villeurbanne)References
1. Fisher E., Lee J.C., Nakamura K. Gray matter atrophy in multiple sclerosis: a longitudinal study. Ann Neurol. 2008. 64(3): 255-65
2. Kocevar G., Stamile C., Hannoun S., et al., Graph theory-based brain connectivity for automatic classification of multiple sclerosis clinical courses, Frontiers in neuroscience. 2016. 10:478
3. Lassmann H. Multiple Sclerosis Pathology. Cold Spring Harb Perspect Med. 2018. 8(3):a028936
4. Rosenke M., Weiner K.S., Barnett M., et al. A cross-validated cytoarchitectonic atlas of the human ventral visual stream. NeuroImage. 2017.
5. Reuter M., Schmansky N. J., Rosas, H. D., et. al. Within-subject template estimation for unbiased longitudinal image analysis. Neuroimage. 2012. 61:1402–1418.
6. Raamana, P., Strother, S. graynet: single-subject morphometric networks for neuroscience connectivity applications. Journal of Open Source Software 3. 2018. 30:924
7. He Y., Dagher A., Chen Z., et al., Impaired small-world efficiency in structural cortical networks in multiple sclerosis associated with white matter lesion load, Brain. 2009. 132(12):3366–79.
8. Hou Y., Jia Y., Hou, J. Natural Course of Clinically Isolated Syndrome: A Longitudinal Analysis Using a Markov Model. Sci Rep. 2018. (8):10857.
9. Muthuraman M., Fleischer V., Kolber P., et al., Structural Brain Network Characteristics Can Differentiate CIS from Early RRMS, Frontiers in neuroscience. 2016. 10(14).
Figures