1787
Optimal Phase-Encoding Schemes for Regional Bias and Reproducibility of Diffusion MRI derived Measures1QMI, NIBIB/NIH, Bethesda, MD, United States
Synopsis
Our goal is to determine whether diffusion MRI acquisitions with different phase-encoding directions (PEDs) result in comparable quantitative measures in different regions of the human brain, or whether PEDs introduce a bias. Additionally, we aim to determine if for a given region, a set of PEDs has better reproducibility. For several regions, PA phase-encoding direction resulted in values that were significantly different than the other three. LR/RL phase-encoding was more reproducible compared to AP/PA in most brain regions, with frontal white matter being the exception. The main source of these reproducibility variations was identified as ghosts overlapping with brain regions.
Introduction
given that diffusion weighted images are susceptible to artifacts and distortions along the phase-encoding direction (PED). Advanced processing pipelines effectively remove most misalignments and distortions, however, residual distortions in regions of high susceptibility and artifacts such as fat or SENSE ghosts might still be present in the data. Given that the locations of such artifacts depend on the PED of the acquisition, data acquired with different PEDs can be hypothesized to have different dMRI metric values and different reproducibility in affected regions. Kennis et al. previously showed a systematic difference in FA between AP and PA PEDs without attributing the difference to an artifact1. In this work, we analyze the effects of all four phase-encoding directions on Fractional Anisotropy (FA) and Trace (TR) DTI metrics. We aim to determine the optimal phase-encoding schemes for a given brain region, both in terms of the derived measures and their variability (reproducibility). We hypothesize that if a significant difference exists between the values derived from one PED and the other three in a region, this is an indication of an artifact in this region and dMRI measures might be unreliable.Materials
Datasets: DMRI data was collected from seven healthy subjects (age: 28±3.6) six times over the course of two months, using a Philips Achieva 3T system. Acquisition parameters were: TE/TR: 92/12875ms, SENSE=2, res=2mm isotropic. For each phase-encoding direction, i.e. anterior-posterior (AP), PA, left-right (LR), and RL, 21 DWI volumes were acquired with the maximum b-value of 1100 s/mm2. Fat-suppressed T2W-TSE image was also acquired.Pre-Processing: DWI pre-processing was performed separately for each PED dataset using the TORTOISE pipeline2. The susceptibility distortion differences between different PEDs were virtually eliminated3, leaving only ghost artifacts present in the data . All DWIs were rigidly aligned to the T2W structural of the subject’s first scan session.Post-Processing: For each PED, average and standard deviation (SD) maps were computed for FA and TR over the longitudinal scans of each subject. A diffusion tensor based registration4 was then performed on all DTI data to generate a template. The individual SD and mean maps were subsequently warped on this template space and averaged, to generate population level average SD and average mean maps. Six WM ROIs from the Desikan atlas5 and nine GM ROIs from the IIT atlas6 were used to extract regional values.Analysis: To determine whether a specific PED biased a region’s FA/TR values, a one-factor ANOVA was carried out to test $$$H_0:\mu_{AP}=\mu_{PA}=\mu_{RL}=\mu_{LR}$$$. If the NULL hypothesis was rejected ($$$\alpha=0.005$$$), K-means clustering was performed (K=2) to determine PEDs with similar behaviors.SD maps were used to assess reproducibility, with lower variability in a region indicating better reproducibility for the PED. K-means clustering with two clusters was performed and thresholded to determine significantly “more reproducible” and “less reproducible” PEDs for a given ROI.Results
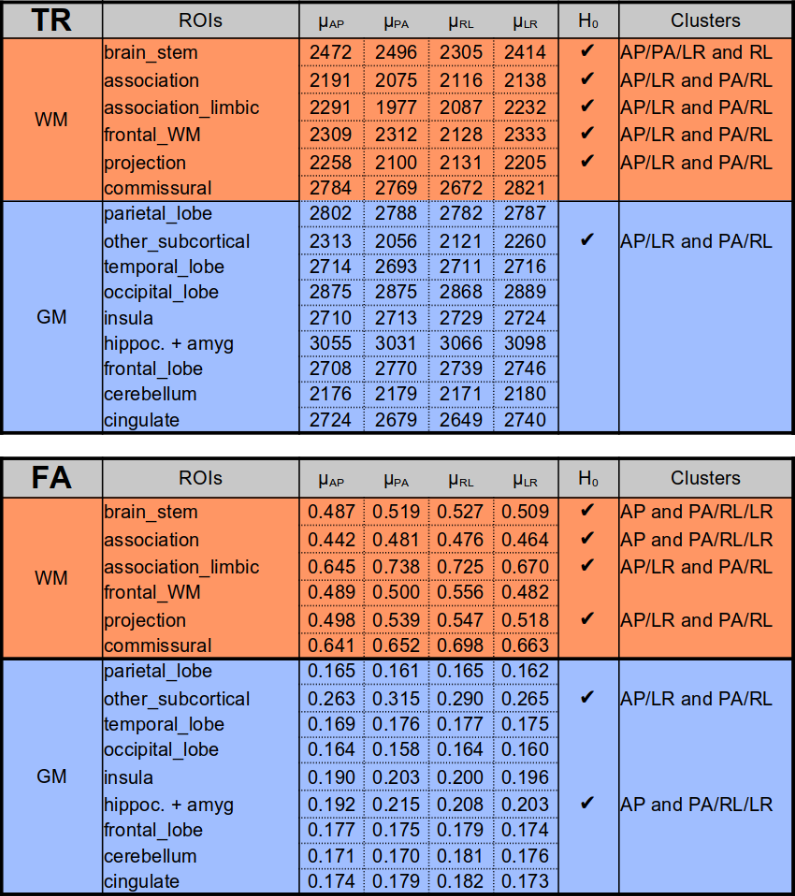
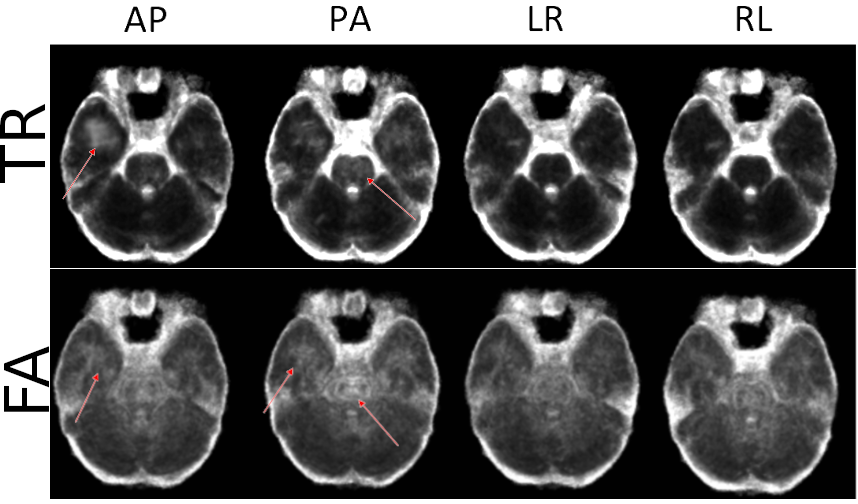
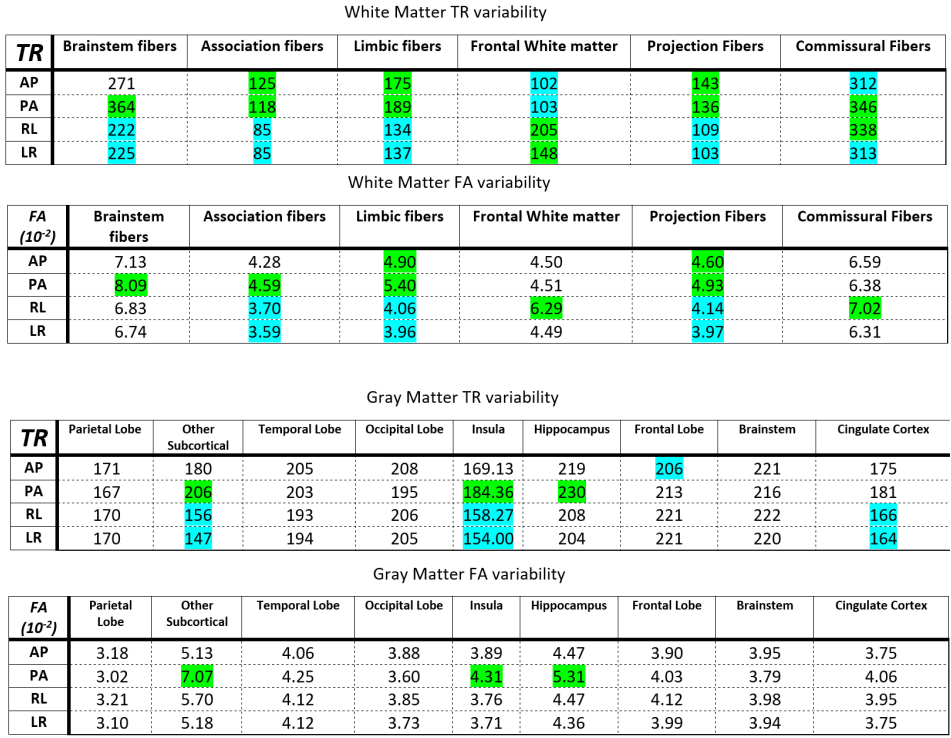
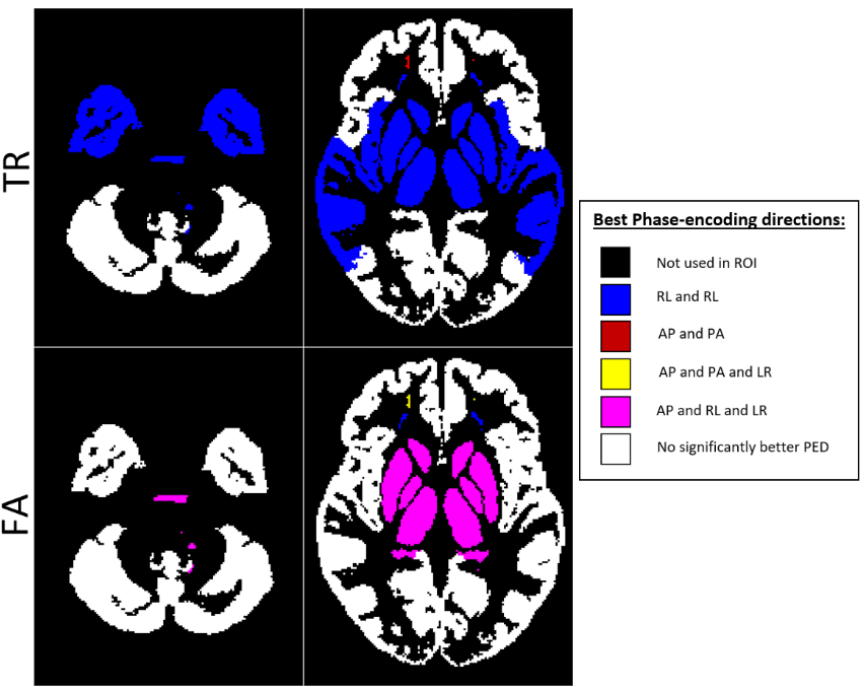
Table 1 displays the region-wise summary of population-averaged Trace and FA values. PEDs had a significant impact on both TR and FA in white matter regions. Their effects were less prominent for GM. The effect of PED was found to be even more pronounced than in [1] with both FA and TR values varying by up to 10% among PEDs, (such as TR in the association_limbic pathways). Interestingly, AP and LR PEDs resulted in more similar values to each other than their orientational counterparts. AP direction was found to be artifactual for the brain_stem and association pathways for FA.Figure 2 displays the population-level variability maps for TR and FA for each PED. Reproducibility is also regionally varying and dependent on the PED. The high variability in the temporal lobes with AP is due to the ghosts of the eyes reflecting into this region. The reproducibility was more orientation dependent: LR/RL did not exhibit high variability in the temporal lobes or the Pons as in AP/PA. Additionally, LR/RL had lower whole-brain variability as indicated by the brightness levels of these maps.Figure 3 quantifies the observations of Figure 2. For TR, RL/LR encodings resulted in significantly more reproducible values in four WM and three GM ROIs (teal highlights). For WM, AP/PA encodings resulted in significantly less reproducible values in three ROIs (green) and were more reproducible than RL/RL in only the frontal white matter.Figure 4 displays a map for regional optimal encoding schemes. For TR, RL/LR encoding is the most reproducible PED set for most regions. For FA, PA direction was found to be more artifactual, therefore AP/RL/RL directions are the suggested PEDs.Conclusion
Our examinations indicated that different regions have different optimal phase-encoding sets. Given that for accurate distortion correction, a dual phase-encoding is needed, LR/RL phase-encoding has been shown to be the most reproducible PED, and therefore, is the suggested PED scheme for most brain regions. However, for studies focusing on the frontal lobe, AP/PA encodings are preferred. An acquisition scheme utilizing all four PEDs with intelligent, region-based data combination would be beneficial to achieve high reproducibility in all brain regions7. A future study will extend this work to multiple scanner platforms to determine whether the patterns observed in this work apply to different scanner manufacturers and models.Acknowledgements
This research was supported by the Intramural Research Program of the National Institute of Biomedical Imaging and Bioengineering and National Institute of Neurological Disorders and Stroke in the National Institutes of Health. The contents of this work do not necessarily reflect the position or the policy of the government, and no official endorsement should be inferred. The authors would also like to thank Susan Fulton and Steven Newman for their efforts in subject recruitment.References
1. Kennis M, van Rooij SJH, Kahn RS, Geuze E, Leemans A. Choosing the polarity of the phase-encoding direction in diffusion MRI: Does it matter for group analysis?. Neuroimage Clin. 2016;11:539-547.
2. Pierpaoli C, Walker L, Irfanoglu MO, Barnett AS, Chang LC, Koay CG, et al. TORTOISE: An integrated software package for processing of diffusion MRI data. In: Proceedings of International Society of Magnetic Resonance in Medicine; 2010. p. 1597.
3. Irfanoglu MO, Modi P, Nayak A, Hutchinson EB, Sarlls J, Pierpaoli C. DR-BUDDI: (Diffeomorphic Registration for Blip-Up blip-Down Diffusion Imaging) method for correcting echo planar imaging distortions. Neuroimage 2015;106:284–289
4. Irfanoglu MO, Nayak A, Jenkins J, Hutchinson EB, Sadeghi N, Thomas CP, et al. DR-TAMAS: Diffeomorphic Registration for Tensor Accurate Alignment of Anatomical Structures. NeuroImage 2016;132:439 – 454
5. Zhang, S. & Arfanakis, K. Evaluation of standardized and study-specific diffusion tensor imaging templates of the adult human brain: Template characteristics, spatial normalization accuracy, and detection of small inter-group FA differences. Neuroimage 172, 40–50
6. Desikan, R. S. et al. An automated labeling system for subdividing the human cerebral cortex on MRI scans into gyral based regions of interest. Neuroimage 31, 968–980
7. Irfanoglu MO, Sadeghi N, Sarlls J, Pierpaoli, C, Improved Reproducibility of Diffusion MRI of the Human Brain with a Four-way Blip-up and Down Phase-Encoding Acquisition Approach, Magnetic Resonance in Medicine, 2020.
Figures