1786
Evaluation of Multicoil SENSE Reconstruction of Undersampled Data using a Human Observer Model of Signal Detection1Mathematics Department, Manhattan College, Riverdale, NY, United States, 2Roy J. Carver Department of Biomedical Engineering, University of Iowa, Iowa City, IA, United States
Synopsis
We evaluated undersampling in MRI using a multicoil SENSE reconstruction with no regularization based the detection of signals by humans. We used a sparse difference-of-Gaussians (S-DOG) model to predict human performance in the detection of a small and large signal in anatomical backgrounds. The prediction was then validated using human observer two-alternative forced choice (2-AFC) tasks. Our model predicted a decrease in performance for both the small and large signal from 4X to 5X acceleration. Our observer study validated that prediction. This approach may lead to a way of assessing image quality that predicts human performance with fewer observer studies.
Purpose
Undersampling of magnetic resonance imaging (MRI) can be used to reduce the time required for a patient to be in the scanner. Ideally the undersampling would not result in a loss of diagnostic information. A surrogate for diagnostic information is the performance of human observers in simple detection tasks. We use task-based assessment of image quality1 by conducting human observer studies and implementing a sparse difference-of-Gaussians (S-DOG)2 observer model to evaluate the detectability of small and large signals in accelerated MRI using multicoil SENSE. The objective is to be able to predict human performance with fewer time-consuming human observer studies.Methods
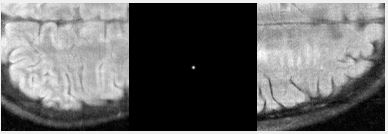
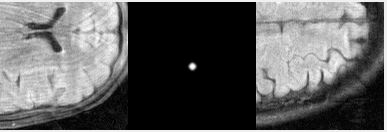
The multi-coil brain data used in this study were from fluid-attenuated inversion recovery (FLAIR) data sets from the fastMRI open source dataset3. All the data sets used had nky = 320, nkx = 640 and nc = 20. We carried out one-dimensional undersampling where we kept 16 k-space lines around the zero frequency (5% of the data) and everywhere else collected every kth line. For simplicity, we refer to this acquisition as a kX undersampling. The SENSE reconstructions were done in the BART4 environment with coil maps estimated via the sum of squares approach using the central 16 k-space lines5. In order to generate the images with the signals, the multi-coil k-space data of the small signal (disk with radius = 0.25 pixels blurred by a Gaussian kernel, σ=1 pixel) and the large signal (disk with radius = 3.5 pixels blurred by a Gaussian kernel, σ=1 pixel) was added to the background image data before undersampling and reconstruction. The amplitude of the signals was chosen to be on the threshold of being visible to better evaluate the effect of undersampling.Three human observers were trained in performing two-alternative forced-choice (2-AFC) studies (Figures 1 and 2), in which the observer determines which sub-image (128 x 128) contains the signal. From these studies, the percentage of images the user identifies as correctly (PC) containing the signal is obtained and used for quantifying image quality. The 2-AFC trials were performed by all observers on a Barco MDRC 2321 monitor in a dark room. Observers were instructed to stay approximately 50 cm away from the monitor, a marker at 50 cm was provided for reference. For each condition every observer did 200 2-AFC trials from which their percent correct was obtained.
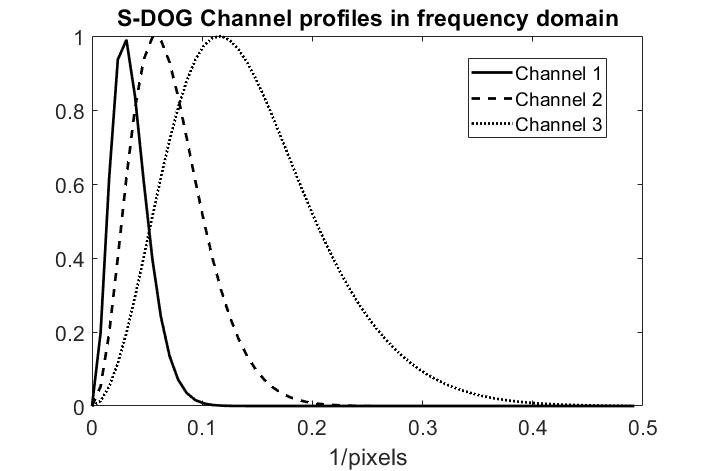
The S-DOG model uses frequency channels (Figure 3) and an internal noise model to model detection by humans2. The S-DOG model has also been used to predict the detection performance in human observer studies due to total variation regularization6. The level of internal noise was chosen to match the average human performance at 4X acceleration for both the small and large signal. For the small signal, a small amount of internal noise was needed (0.1% of background variability) but a larger amount of internal noise was needed for the large signal (13.6% of the background variability). All other accelerations were estimated with those resulting models.
Results & Discussion
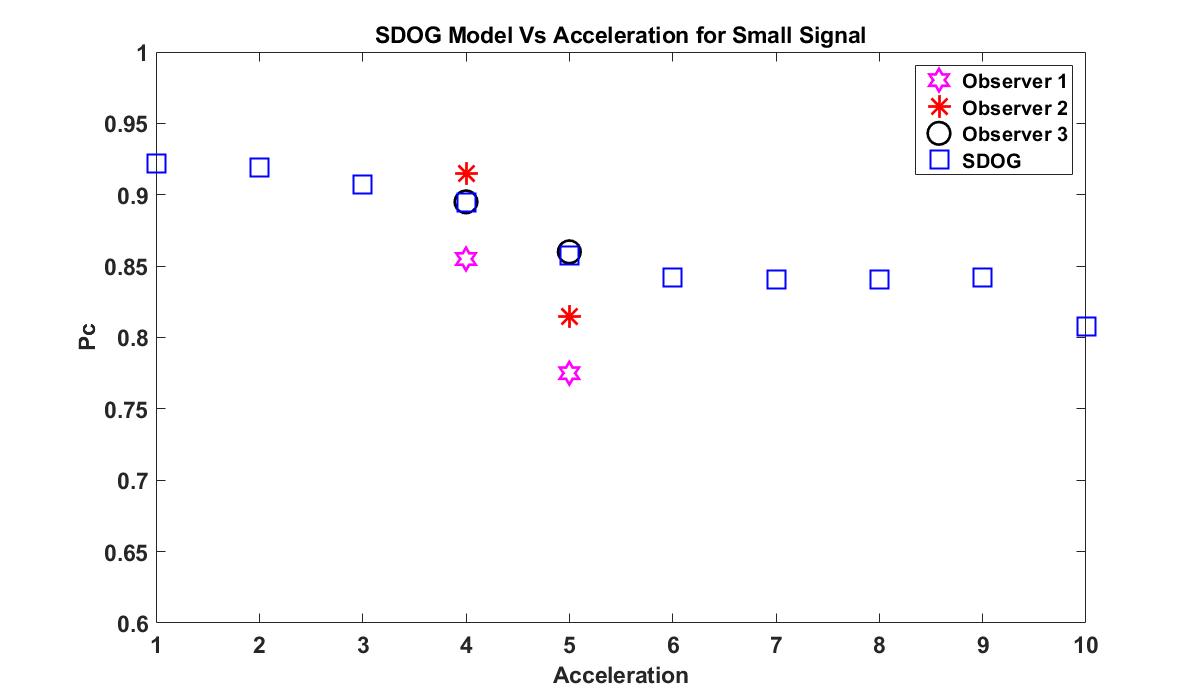
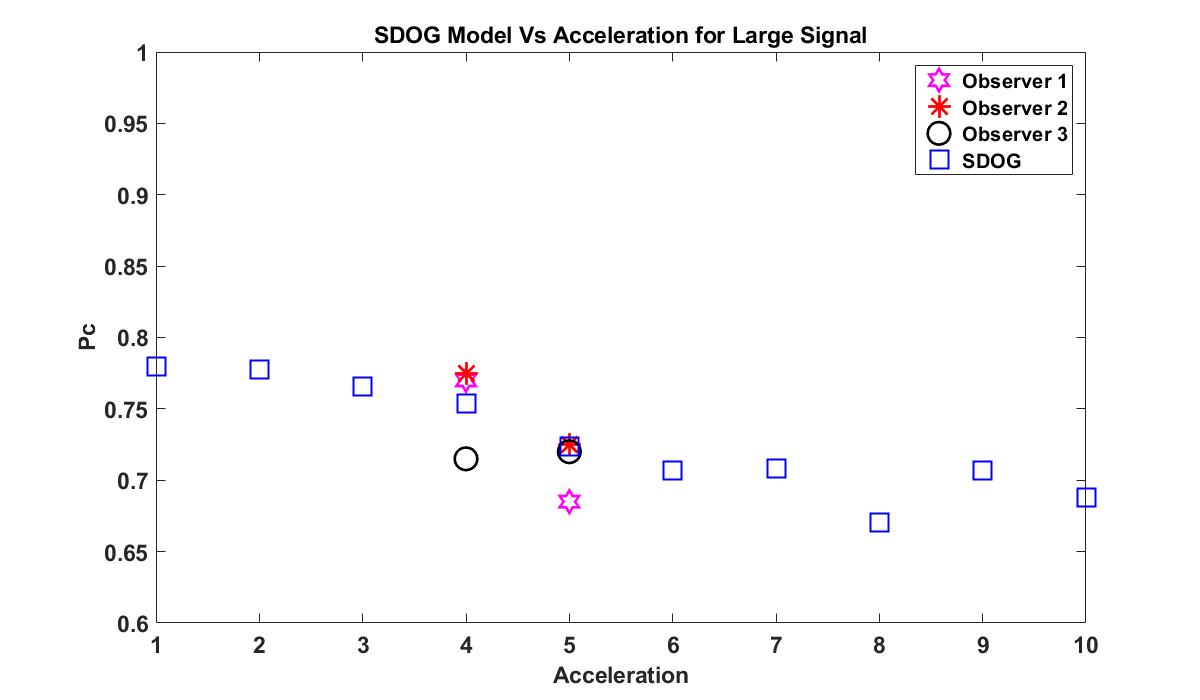
The results for the small signal (Figure 4) show a prediction from the S-DOG model observer that the first large drop in performance in the detection task would occur between the 4X and 5X accelerations. This prediction was validated by a subsequent observer study. The predicted drop by the S-DOG model was 0.04 and the drop in average human performance was 0.07. Similarly, for the large signal (Figure 5), the model observer predicted the first large drop in performance between the 4X and 5X acceleration which was verified by an observer study. The predicted drop by the S-DOG model was 0.03 and the drop in average human performance was 0.04. While in both cases the S-DOG underestimated the drop in human performance, it provided an indication of the change occurring at those acceleration factors. As expected the acceleration affected the detection of the small signal more than the detection of the large signal. Future work will include the use of more human observers and test conditions to better understand the limits of both this model observer and the 2-AFC task used.Conclusion
The S-DOG channel was able to predict a drop in human detection performance from the 4X to 5X acceleration which was validated by human observers.Acknowledgements
We acknowledge support from NIH R15-EB029172, the Manhattan College Faculty Development Grant and the Kakos Center for Scientific Computing. The authors also thank Dr. Krishna S. Nayak, and Dr. Craig K. Abbey for their helpful insights.References
1. HH Barrett and KJ Myers 2004 Foundations of Image Science (Hoboken, NJ: Wiley)
2. CK Abbey, HH Barrett, "Human-and model-observer performance in ramp-spectrum noise: effects of regularization and object variability", JOSA A, 18: 1237-1242 (1994)
3. J Zbontar, F Knoll, A Sriram, et al, "fastMRI: An Open Dataset and Benchmarks for Accelerated MRI", arXiv: 1811.08839v1 (2018)
4. M Uecker, F Ong, JI Tamir, et al, "Berkeley Advanced Reconstruction Toolbox", Proc. Intl. Soc. Mag. Reson. Med, 23, 2486 (2015)
5. K Pruessmann, M Weiger, M Scheidegger, P Boesiger, “SENSE:Sensitivity Encoding for Fast MRI”, Magn Reson Med, 42:952-962 (1999)
6. AG O’Neill, EL Valdez, SG Lingala, AR Pineda, “Modeling human observer detection in undersampled magnetic resonance imaging (MRI)”, Proc. of SPIE Medical Imaging 2021, 115990. 115990H.
Figures