1782
Self-Gated Zero Echo Time Imaging of the Lung
Hanna Frantz1, Tobias Lobmeyer1, Patrick Metze1, Thomas Hüfken1, Kilian Stumpf1, Julien Rivoire2, Hizami Murad2, and Volker Rasche1
1Department of Internal Medicine II, Ulm University Medical Center, Ulm, Germany, 2RS2D, Mundolsheim, France
1Department of Internal Medicine II, Ulm University Medical Center, Ulm, Germany, 2RS2D, Mundolsheim, France
Synopsis
Zero echo time (ZTE) imaging is an established approach for three-dimensional imaging of tissues and materials with ultrashort T2* relaxation times. An intrinsic disadvantage of this approach are missing data points in the center region of k-space due to hardware limitations. These missing points are often retrospectively interpolated or subsequently acquired using single-point imaging approaches or additional ZTE acquisitions with decreased resolutions. The presented approach relies on an interleaved combination of ZTE read-outs with different resolutions in combination with Compressed Sensing, to acquire the k-space center, thus enabling k-space based self-gating.
Introduction
Magnetic resonance imaging (MRI) of tissues or samples with ultrashort T2* relaxation times such as e.g. lung1 or bone2 requires imaging approaches with short echo times (TE). Zero echo time (ZTE) enables data acquisition with almost negligible TE by application of the excitation pulse during the presence of a static read-out gradient. Since data cannot be acquired during playing out the RF pulse, missing data points in the center of k-space are one of the major limitations of ZTE, especially on clinical scanners.Several approaches have been introduced to acquire or estimate missing data points3, including algebraic reconstruction of the oversampled data, or additional acquisitions based on low-resolution ZTE or Cartesian single-point imaging sequences. While algebraic reconstructions are limited to dead time durations of a few Nyquist dwells4, additional acquisitions lead to prolonged scan durations and therefore to an increased patient discomfort.
We have introduced a concept for interfacing an independent receive unit to a clinical scanner, thus minimizing front-end switching times down to some µs5. However, the long excitation pulses on clinical systems still limit the application of ZTE even with T/R switch time in the µs range. The proposed method exploits the concept of the ZTE sequence. But instead of performing additional acquisitions, every n-th gradient is played out with a decreased amplitude (lower resolution), to ensure coverage of the k-space center without any scan time penalties. Additionally, every m-th excitation is performed without gradients, to measure the DC component (k0) in the steady-state, which is used for gating purposes. Rising aliasing artifacts are addressed by non-linear reconstruction techniques.
Methods
All lung images were acquired during free-breathing with a 3 T whole-body clinical imaging system (Ingenia 3.0T CX, Philips Healthcare, Best, The Netherlands) with an independent spectrometer (MRI Console Cameleon, RS2D, Mundolsheim, France), allowing for faster T/R switching, as well as for higher readout bandwidths. A custom-built rectangular single-loop coil with a size of 200 mm x 200 mm was used for signal reception.The sequence is based on a kooshball trajectory6 but modified such that every n-th read-out gradient is executed with ¼ of its initial amplitude, presented in further detail in7. Additionally, every 50-th excitation is performed without any read-out gradient, to measure the center of k-space, in order to acquire a self-gating signal for multi-phase lung imaging. To ensure sufficient respiration induced k0 signal variation, the self-gating signal was acquired simultaneously via the Philips receive path with an additional Flex-S (Philips Healthcare, Best, The Netherlands), placed on the lung-liver-interface.
For image reconstruction, an in-house built reconstruction framework, implemented in MATLAB (The MathWorks, Natick, Massachusetts, USA) was used. The k-space density functions were calculated using a Voronoi tessellation8. A Compressed Sensing reconstruction was used in combination with TV sparsity transform to compensate artifacts arising from undersampling in the outer regions of k-space and due to the respiratory gating.
Power spectrum analysis was used to identify cut-off frequencies used for bandpass filtering of the DC-amplitudes. The navigator signal was then used to sort the acquired data into equidistant bins for 3 different respiratory stages.
The suggested approach was evaluated for lung imaging on healthy volunteers after obtaining written informed consent. All relevant scan parameters are listed in table 1.
Results
Figure 1 shows a power spectrum obtained from k0 data, which was acquired after every 50-th excitation (dt = 150 ms). The respiratory frequencies, used for self-gating are marked in yellow and can be clearly located between 0.2 Hz and 0.3 Hz.Figure 2 shows coronal (A-C), sagittal (D-F) and axial (G-I) slices of the lung of a healthy volunteer. The data was acquired during free-breathing and reconstructed with respiratory gating of 3 stages, namely inspiration (A,D,G), expiration (C,F,I) and an intermediate state (B,E,H). As common for ZTE sequences, the coil can be seen in the axial view, due to the characteristic of imaging materials with ultrashort T2* relaxation times.
Furthermore, figure 2 shows the position of the lung-liver-interface in the coronal slices, marked by the turquoise line for expiration and by the orange line for inspiration. The difference in the respiratory amplitude was measured to be (2.89 ± 0.25) mm.
Discussion and Conclusion
Replacing ZTE read-outs with lower resolution gradients yields additional information, missing in conventional ZTE acquisitions, within the center region of k-space without any increase in total scan duration. Furthermore, the introduction of gradient-free read-outs poses the possibility of obtaining k-space center data that can be used for self-gating of lung data. The presented approach yields qualitative ZTE images within the same acquisition duration as a standard ZTE acquisition since no additional acquisitions or prospective triggering is required.Since the sensitivity of the single-loop coil is clearly a limiting factor concerning image quality, the technique could be further improved by choosing another coil setup. Adequate image quality would enable quantitative analysis of functional values, such as fractional ventilation or proton density.
Acknowledgements
The authors thank the Ulm University Center for Translational Imaging MoMAN for its support. This work was supported by DFG RA1660/9-1. Technical support from Philips Healthcare is gratefully acknowledged.References
- Wild JM, Marshall H, Bock M, et al. MRI of the lung (1/3): methods. Insights Imaging. 2012;3(4):345-53.
- Wehrli FW. Magnetic resonance of calcified tissues. J Magn Reson. 2013;229:35-48.
- Froidevaux R, Weiger M, Brunner DO, et al. Filling the dead-time gap in zero echo time MRI: Principles compared. Magn Reson Med. 2018;79(4):2036-2045.
- Weiger M, Brunner DO, Tabbert M, et al. Exploring the bandwidth limits of ZTE imaging: Spatial response, out-of-band signals, and noise propagation. Magn Reson Med. 2015;74(5):1236-47.
- Eder M, Horneff A, Paul J, et al. A Signal Acquisition Setup for Ultrashort Echo Time Imaging Operating in Parallel on Unmodified Clinical MRI Scanners Achieving an Acquisition Delay of µs. IEEE Trans Med Imaging. 2020;39(1):218-225.
- Wong ST, Roos MS. A strategy for sampling on a sphere applied to 3D selective RF pule design. Magn Reson Med. 1994;32(6):776-84.
- Frantz H, Huefken T, Metze P, et al. Zero Echo Time Imaging Using Low Resolution k-Space Interleaves. Poster presented at: 2021 ISMRM & SMRT Annual Meeting & Exhibition; May 17, 2021; Vancouver, Canada.
- Rasche V, Proksa R, Sinkus R, et al. Resampling of data between arbitrary grids using convolution interpolation. IEEE Trans Med Imaging. 1999;18(5):385-92
Figures
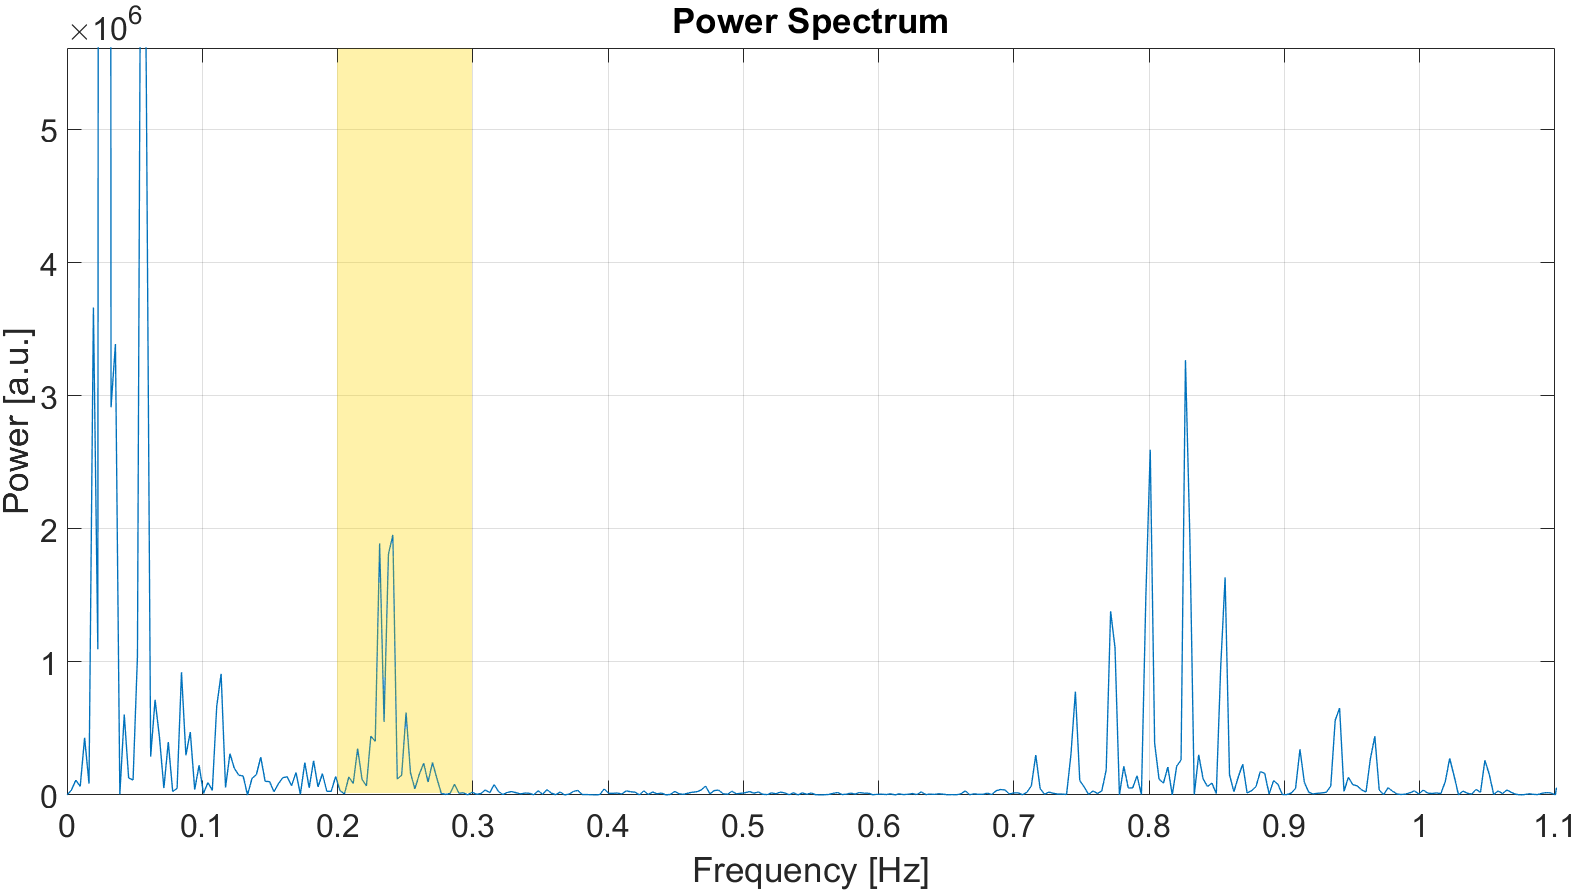
Figure 1: Power spectrum of the center of
k-space (k0). The DC-data was obtained for every 50-th spoke (dt = 150ms),
during which no gradient was played out. The spectrum was used to obtain the
bandpass frequencies for k-space based self-gating, which are marked in yellow.
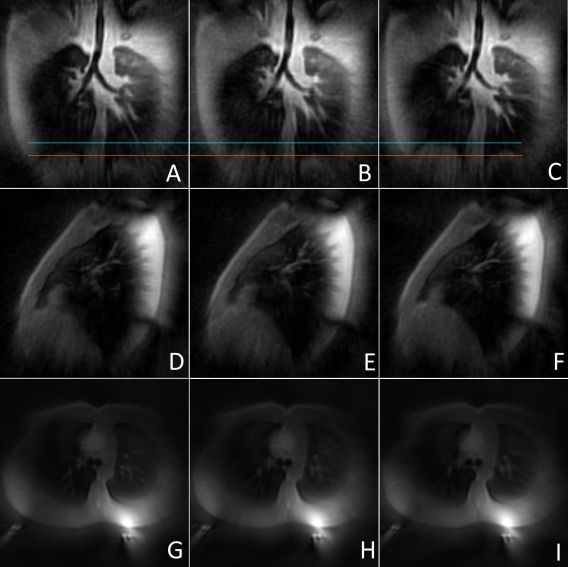
Figure 2: Coronal (A-C), sagittal (D-F)
and axial (G-I) slices of a free-breathing lung ZTE acquisition. The data was
reconstructed using self-gating for an inspiratory stage (A,D,G), an expiratory
stage (C,F,I) and an intermediate stage (B,E,H).In the coronal slices, the lung-liver-interface
is marked in orange for the inspiratory state and in turquoise for expiration.
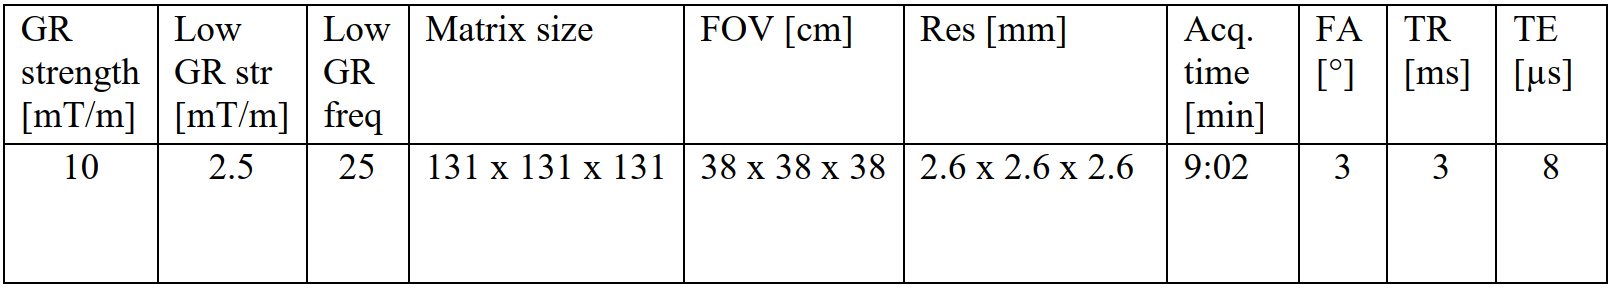
Table 1: Scan parameters.
DOI: https://doi.org/10.58530/2022/1782