1778
The origins of BOLD signal fluctuations in non-gas-inhalation CVR mapping: an fMRI-EEG study1Department of Diagnostic Radiology and Nuclear Medicine, University of Maryland School of Medicine, Baltimore, MD, United States, 2Department of Radiology, Johns Hopkins University School of medicine, Baltimore, MD, United States, 3Department of Biomedical Engineering, College of Biomedical Engineering & Instrument Science, Zhejiang University, Hangzhou, China
Synopsis
Cerebrovascular reactivity (CVR) is typically measured with hypercapnic challenges, which require considerable subject cooperation. Recent CVR mapping approaches using resting-state BOLD data are promising, but their sensitivity is low in subjects with minimal spontaneous changes in breathing pattern. Performed in conjunction with resting-state BOLD scans, intermittent breath modulation enhances variations in breathing pattern while requiring minimal subject compliance, and is a promising tool for CVR mapping without gas inhalation. Here we conducted simultaneous fMRI-EEG experiments to investigate origins of the global BOLD signal fluctuations during intermittent breath modulation, to verify the validity of this new approach.
INTRODUCTION
Cerebrovascular reactivity (CVR) is a measure of the dilatory function of cerebral blood vessels. CVR mapping is typically performed using hypercapnic gas inhalation or breath-holding methods1, which require considerable subject cooperation. Recently, a new method combining a resting-state BOLD scan with intermittent breath modulation was proposed to provide a CVR mapping approach without CO2 inhalation, which offers several advantages including improved comfort and minimal requirements for subject compliance, as well as a high contrast-to-noise ratio (CNR) in the CVR data4. This method uses the filtered global BOLD signal as the surrogate regressor of blood CO2 fluctuation, to generate the CVR map. However, it is known that the origins of the global BOLD signal include many components. This study aims to evaluate the contributions of major components to the global BOLD signal, including end-tidal CO2 (EtCO2), neural activity and respiration. Experiments with simultaneous fMRI-EEG recordings were conducted to examine the extent to which the filtered global BOLD signal measured under intermittent breath modulation, reflects CO2 variations.METHODS
Study design: Seven healthy adults (3M/4F, 26±5 yrs) were enrolled and studied on a Siemens 3T scanner with 64-channel head coil. For each subject, a simultaneous BOLD fMRI-EEG scan was performed with intermittent breath modulation, in which the subject was asked to follow a visual cue to perform paced breathing (3s breathe-in/3s breathe-out for two cycles) in a jittered fashion (30-60s interval)5. The imaging parameters of the BOLD scan were: field-of-view (FOV) 208×208x160mm3, TR/TE/FA=400ms/37ms/90º, multiband factor=8, duration=15min). EEG signals were recorded simultaneously using a MRI-compatible EEG system (Brain Product) with a 32-channel cap. During the scan, EtCO2, the CO2 concentration in the lung, which approximates that in the arterial blood, was recorded using a capnograph device (Philips Healthcare). Respiration was monitored with a respiratory belt.Data analysis: BOLD fMRI and EtCO2 data analyses were conducted as described previously5. Briefly, the BOLD images were motion corrected, smoothed by 8mm, detrended, and averaged within the whole brain to generate the global BOLD time course. The EtCO2 time course was temporally shifted to synchronize with the global BOLD signal time course to account for the arrival and response delays5. EEG data was preprocessed using EEGLAB toolbox6. After gradient and motion artifacts removal, a global EEG amplitude spectrum signal was created by taking the root-mean-square (rms) across all channels, and then filtered into four frequency bands (delta=1-4Hz, theta=4-7Hz, alpha=7-13Hz, and beta=13-30Hz). The resulting timeseries were convolved with hemodynamic response function to yield the EEG time courses6. From the respiratory belt recording, the respiration volume per unit time (RVT) was computed by dividing the amplitude difference between the maximum and minimum of each breath by its duration7. The resulting RVT time course was then convolved with the respiratory response function to obtain the respiration time course8. Regression analyses were then conducted by bandpass filtering the four types of time courses into a total of 120 different frequency ranges4, and evaluating the association between the filtered global BOLD time-course and each of the three components (EtCO2, EEG and respiration). Multilinear regressions with the global BOLD time-course as a dependent variable and all three types of time-courses as independent variables were also performed. In all regression analyses, motion vectors were included as covariates, and R2 values determined.
RESULTS and DISCUSSION
Figure 1 shows the processed time courses from a representative subject. Figures 2A-C show the R2 matrix of different frequency ranges between the global BOLD signal and each of the component time-courses. EtCO2 showed the highest R2 over most frequency ranges, suggesting that EtCO2 explains more variance in the global BOLD signal than neural activity and respiration. Figure 2D shows the R2 matrix of different frequency ranges from the multilinear regression analysis. It can be seen that more than 80% of the variance in global BOLD signal can be explained by EtCO2, neural activity and respiration all together. As shown in Figure 3, the ratio of the global BOLD variance explained by EtCO2 alone (>60%), to the total variance explained by all three components was significantly higher than the ratio of EEG (~25%) and respiration (~11%) at the frequency ranges used in resting-state CVR mapping (0-0.08Hz4, p<0.038, or 0-0.1164Hz3, p<0.032). This suggests that EtCO2 is the major contributor to the variance in the global BOLD signal in these frequency ranges. Neural activity and respiration also contribute to the global BOLD signal as previously reported7, but the degree of contribution is much less than the EtCO2 contribution. Figure 4 shows the resulting CVR map obtained from a representative subject.CONCLUSION
Our results show that in resting-state BOLD scans with intermittent breath modulation, EtCO2 fluctuations which reflect blood CO2 content, are the dominant contributor to global BOLD signal fluctuations in the frequency ranges used in CVR mapping. Therefore, the use of the filtered global BOLD signal as the regressor for voxel-wise CVR mapping is a good estimator of vascular responses to blood CO2 fluctuations with intermittent breath modulation.Acknowledgements
This work is supported by NIH grants R21 NS100006 and R21 EY028353.
References
1) Liu P, De Vis JB, Lu H. Cerebrovascular reactivity (CVR) MRI with CO2 challenge: A technical review. Neuroimage. 2019;187:104-115.
2) Golestani AM, Wei LL, Chen JJ. Quantitative mapping of cerebrovascular reactivity using resting-state BOLD fMRI: Validation in healthy adults. Neuroimage 2016;138:147–163.
3) Liu P, Li Y, Pinho M, Park DC, Welch BG, Lu H. Cerebrovascular reactivity mapping without gas challenges. Neuroimage. 2017;146:320-326.
4) Liu P, Liu G, Pinho MC, Lin Z, Thomas BP, Rundle M, Park DC, Huang J, Welch BG, Lu H. Cerebrovascular Reactivity Mapping Using Resting-State BOLD Functional MRI in Healthy Adults and Patients with Moyamoya Disease. Radiology. 2021;299(2):419-425.
5) Liu P, Xu C, Lin Z, Sur S, Li Y, Yasar S, Rosenberg P, Albert M, Lu H. Cerebrovascular reactivity mapping using intermittent breath modulation. Neuroimage. 2020;215:116787.
6) Wong CW, Olafsson V, Tal O, Liu TT. The amplitude of the resting-state fMRI global signal is related to EEG vigilance measures. Neuroimage. 2013;83:983-90.
7) Birn RM, Smith MA, Jones TB, Bandettini PA. The respiration response function: the temporal dynamics of fMRI signal fluctuations related to changes in respiration. Neuroimage. 2008;40(2):644-654.
8) Chang C, Glover GH. Relationship between respiration, end-tidal CO2, and BOLD signals in resting-state fMRI. Neuroimage. 2009 Oct 1;47(4):1381-93.
Figures
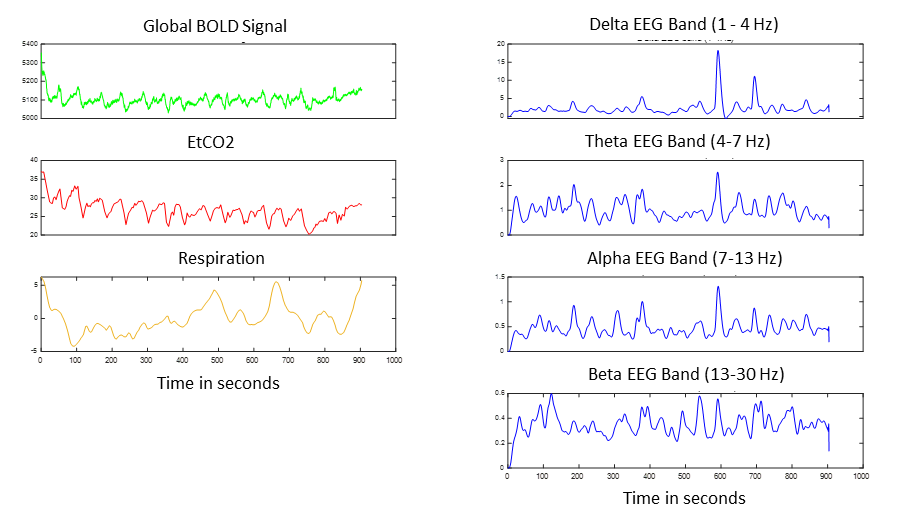
Figure 1. Example time courses of global BOLD signal, EtCO2, respiration, and four EEG band power spectrum signals from a representative subject.
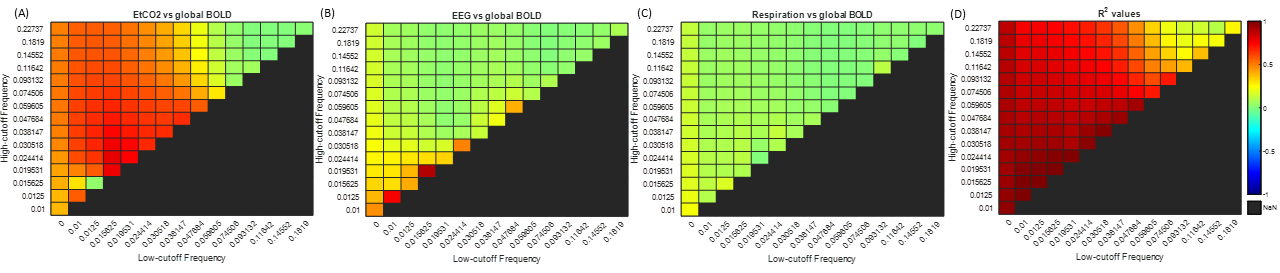
Figure 2. R2 values from the regression analyses in all frequency ranges. (a) R2 between EtCO2 and global BOLD time courses. (b) R2 between all four EEG bands and global BOLD time courses. (c) R2 between respiration and global BOLD time courses. (d) R2 between all three types of contributors and global BOLD time courses.
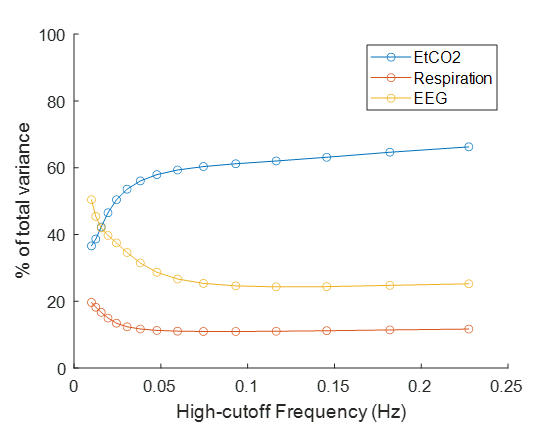
Figure 3. Ratios between the variance explained by EtCO2, EEG (all four bands together) and respiration alone and that explained by all three together at low-cutoff frequency of 0Hz.
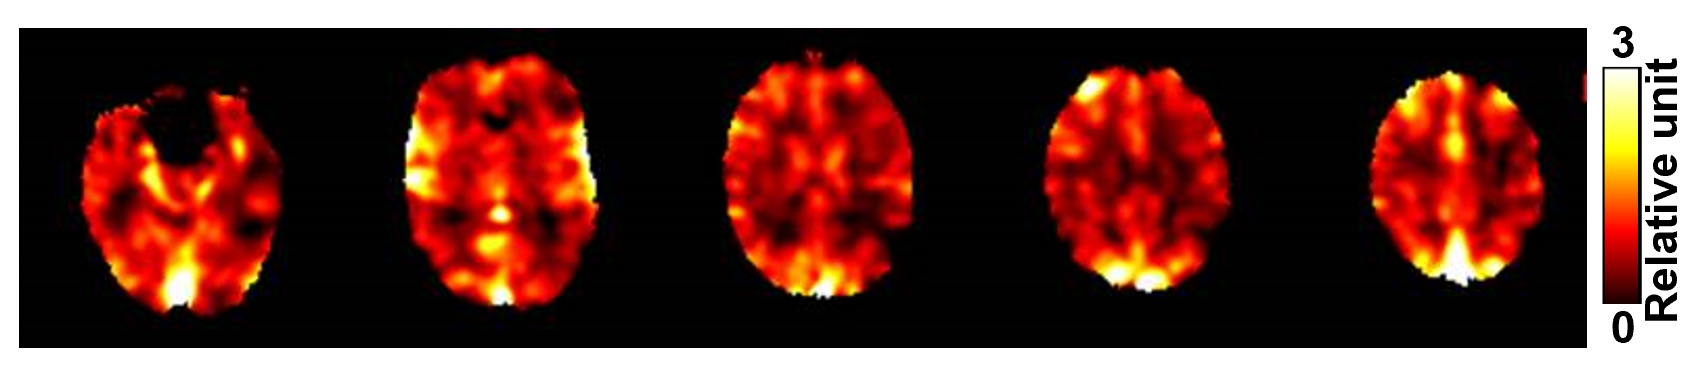
Figure 4. Resting-state CVR map form a representative subject.