1772
Disruptions of functional and structural networks in classic trigeminal neuralgia patients1Department of Magnetic Resonance, Lanzhou University Second Hospital, Lanzhou, China, 2Philips Healthcare, Xi'an, China
Synopsis
Classic trigeminal neuralgia (CTN) has been proven related to functional or morphological alterations in critical brain regions. To test the simultaneous changes of the topological properties of structural networks (SN), functional networks (FN), as well as their couplings, we constructed SN using diffusion tensor imaging (DTI) data and FN using resting-state functional magnetic imaging (rs-fMRI) data from 29 CTN patients and 34 healthy controls (HCs). The patients showed the wide disruptions of global and local topological organizations in SN and FN, together with the abnormal coupling relationships. Our findings may provide novel perspectives for understanding the pathophysiological mechanisms of CTN.
Introduction
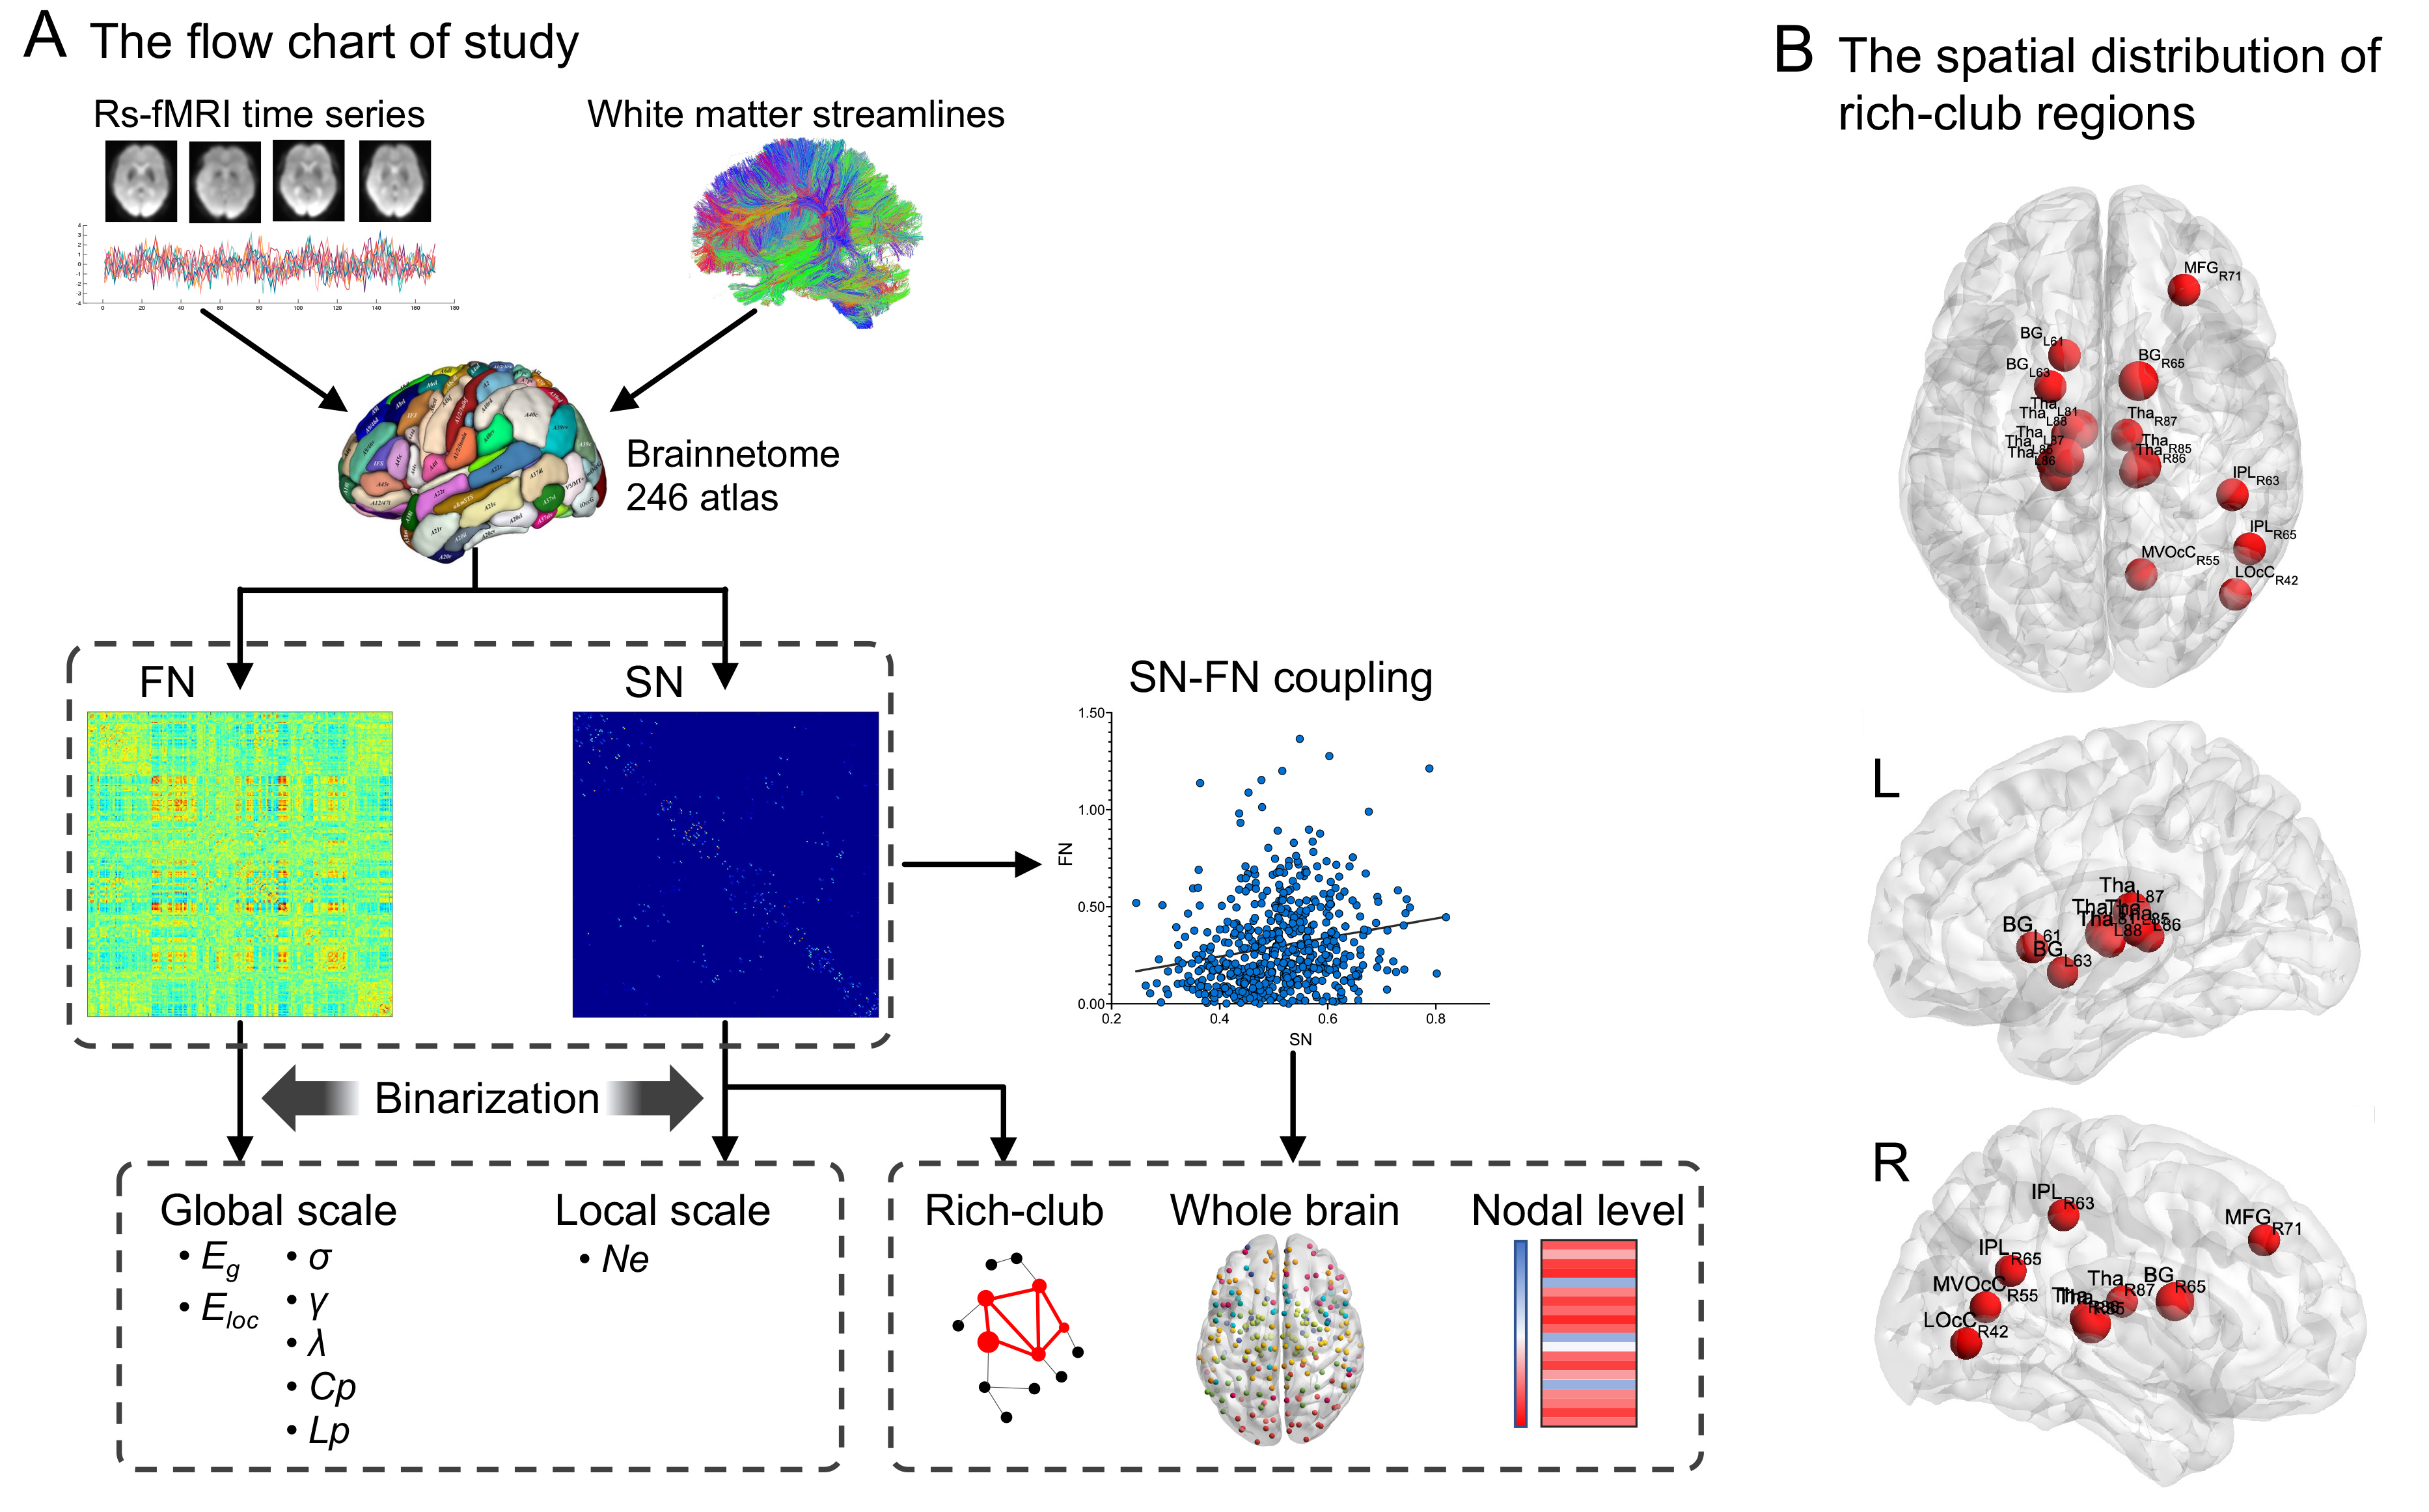
Accumulating studies have indicated a wide range of brain alterations with respect to the structure and function of classic trigeminal neuralgia (CTN). However, the simultaneous alterations of the topological organization of FN, SN, as well as their couplings in patients remain unknown. Hence, we investigated the topological properties of both SN and FN, and further explored the relationships between them by calculating coupling degree in whole brain, rich-club and nodal levels.Methods
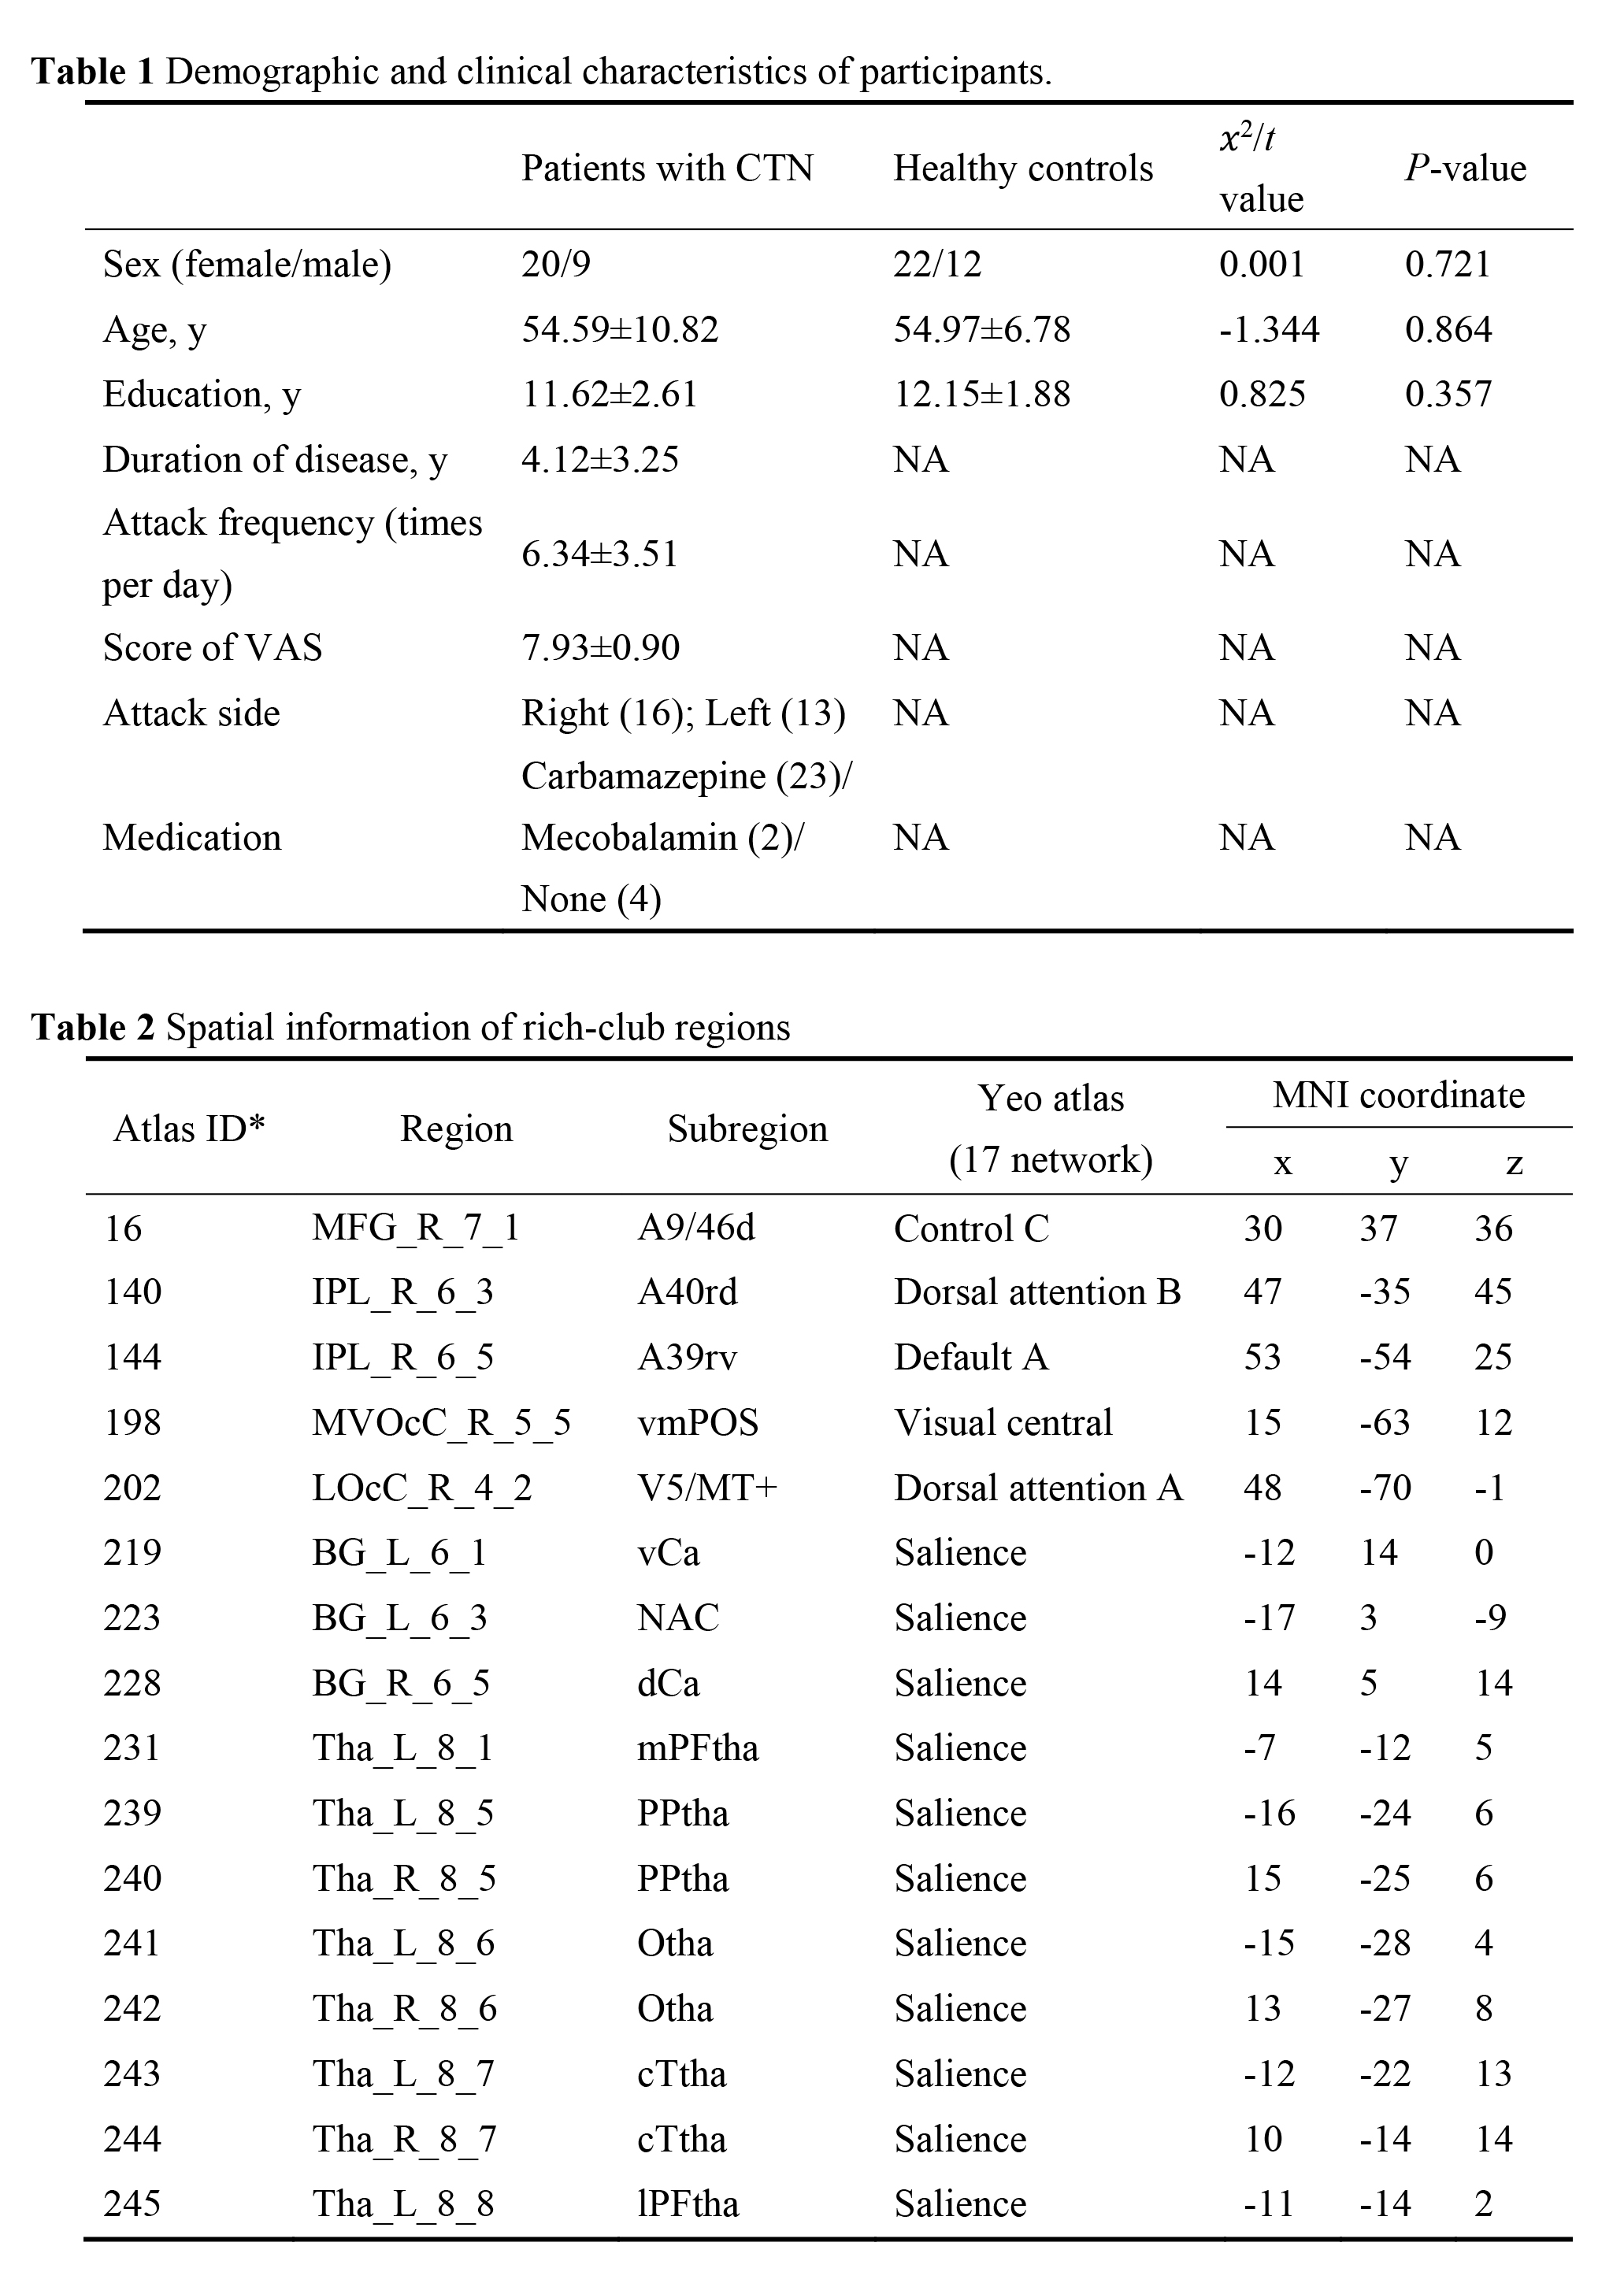
This study included 29 patients with CTN from Lanzhou University Second Hospital, and 34 HCs age, sex, education matched. All participants were right handed (Table 1). Structural MRI and resting state functional MRI (rs-fMRI) data were acquired on a 3.0T scanner (Ingenia CX, Philips healthcare, the Netherlands) with an 32-channel head coil. Rs-fMRI images were acquired by EPI sequence (180 volumes; 36 contiguous slices; FOV: 220×220 mm2; matrix: 64×64; TR: 2000 ms; TE: 30 ms). Single shot SE-EPI sequence was used for DTI acquisition(FOV: 256×256×150 mm2, matrix: 128×128×50; 64 gradient directions at b=1000 s/mm2, and one image with b=0). High-resolution iso-voxel structural images were acquired as well. Rs-fMRI data were preprocessed by DPABI1. The DTI preprocessing were carried out using the PANDA toolbox2. The FN and SN were constructed using Brainnetome (BN) template3. Edges of FN were measured by Fisher-z transformed Pearson’s correlation coefficients between ROI time series. For SN, the connection density (calculated as same as previous studies4,5) was defined as the weight between the ROIs with at least 3 streamlines. The SN and FN were both binarized for topological analysis, including small-worldness (σ, γ, λ, Cp, Lp), global and local efficiency (Eg and Eloc), as well as nodal efficiency (Ne). The p=0.017×10⁻⁴ was used as threshold (FDR corrected for all connections) for FN binarization and only positive connectivity was considered. Based on SN, we also calculated rich-club coefficient and detected the rich-club nodes in the group-averaged SN, the network that had connections presenting in at least 75% subjects. Furthermore, we evaluated the coupling between SN and FN at 3 levels: (1) whole brain; (2) rich-club; (3) nodal level-calculated as the number of common edges of FN and SN. For the former two levels, the nonzero edges of SN and the corresponding FN edges were extracted as vectors and then resampled structural vector into a gaussian distribution with the mean of 0.5 and the standard deviation of 0.15. The coupling was defined by the Pearson correlation between vectors. Nonparametric permutation tests (10,000 repetitions) were used with age and sex as covariates to examine between-group differences in topological properties and coupling degree. FDR corrections were used in the nodal level analysis (246 comparisons for each parameter). We further performed Spearman partial correlation analysis.Results
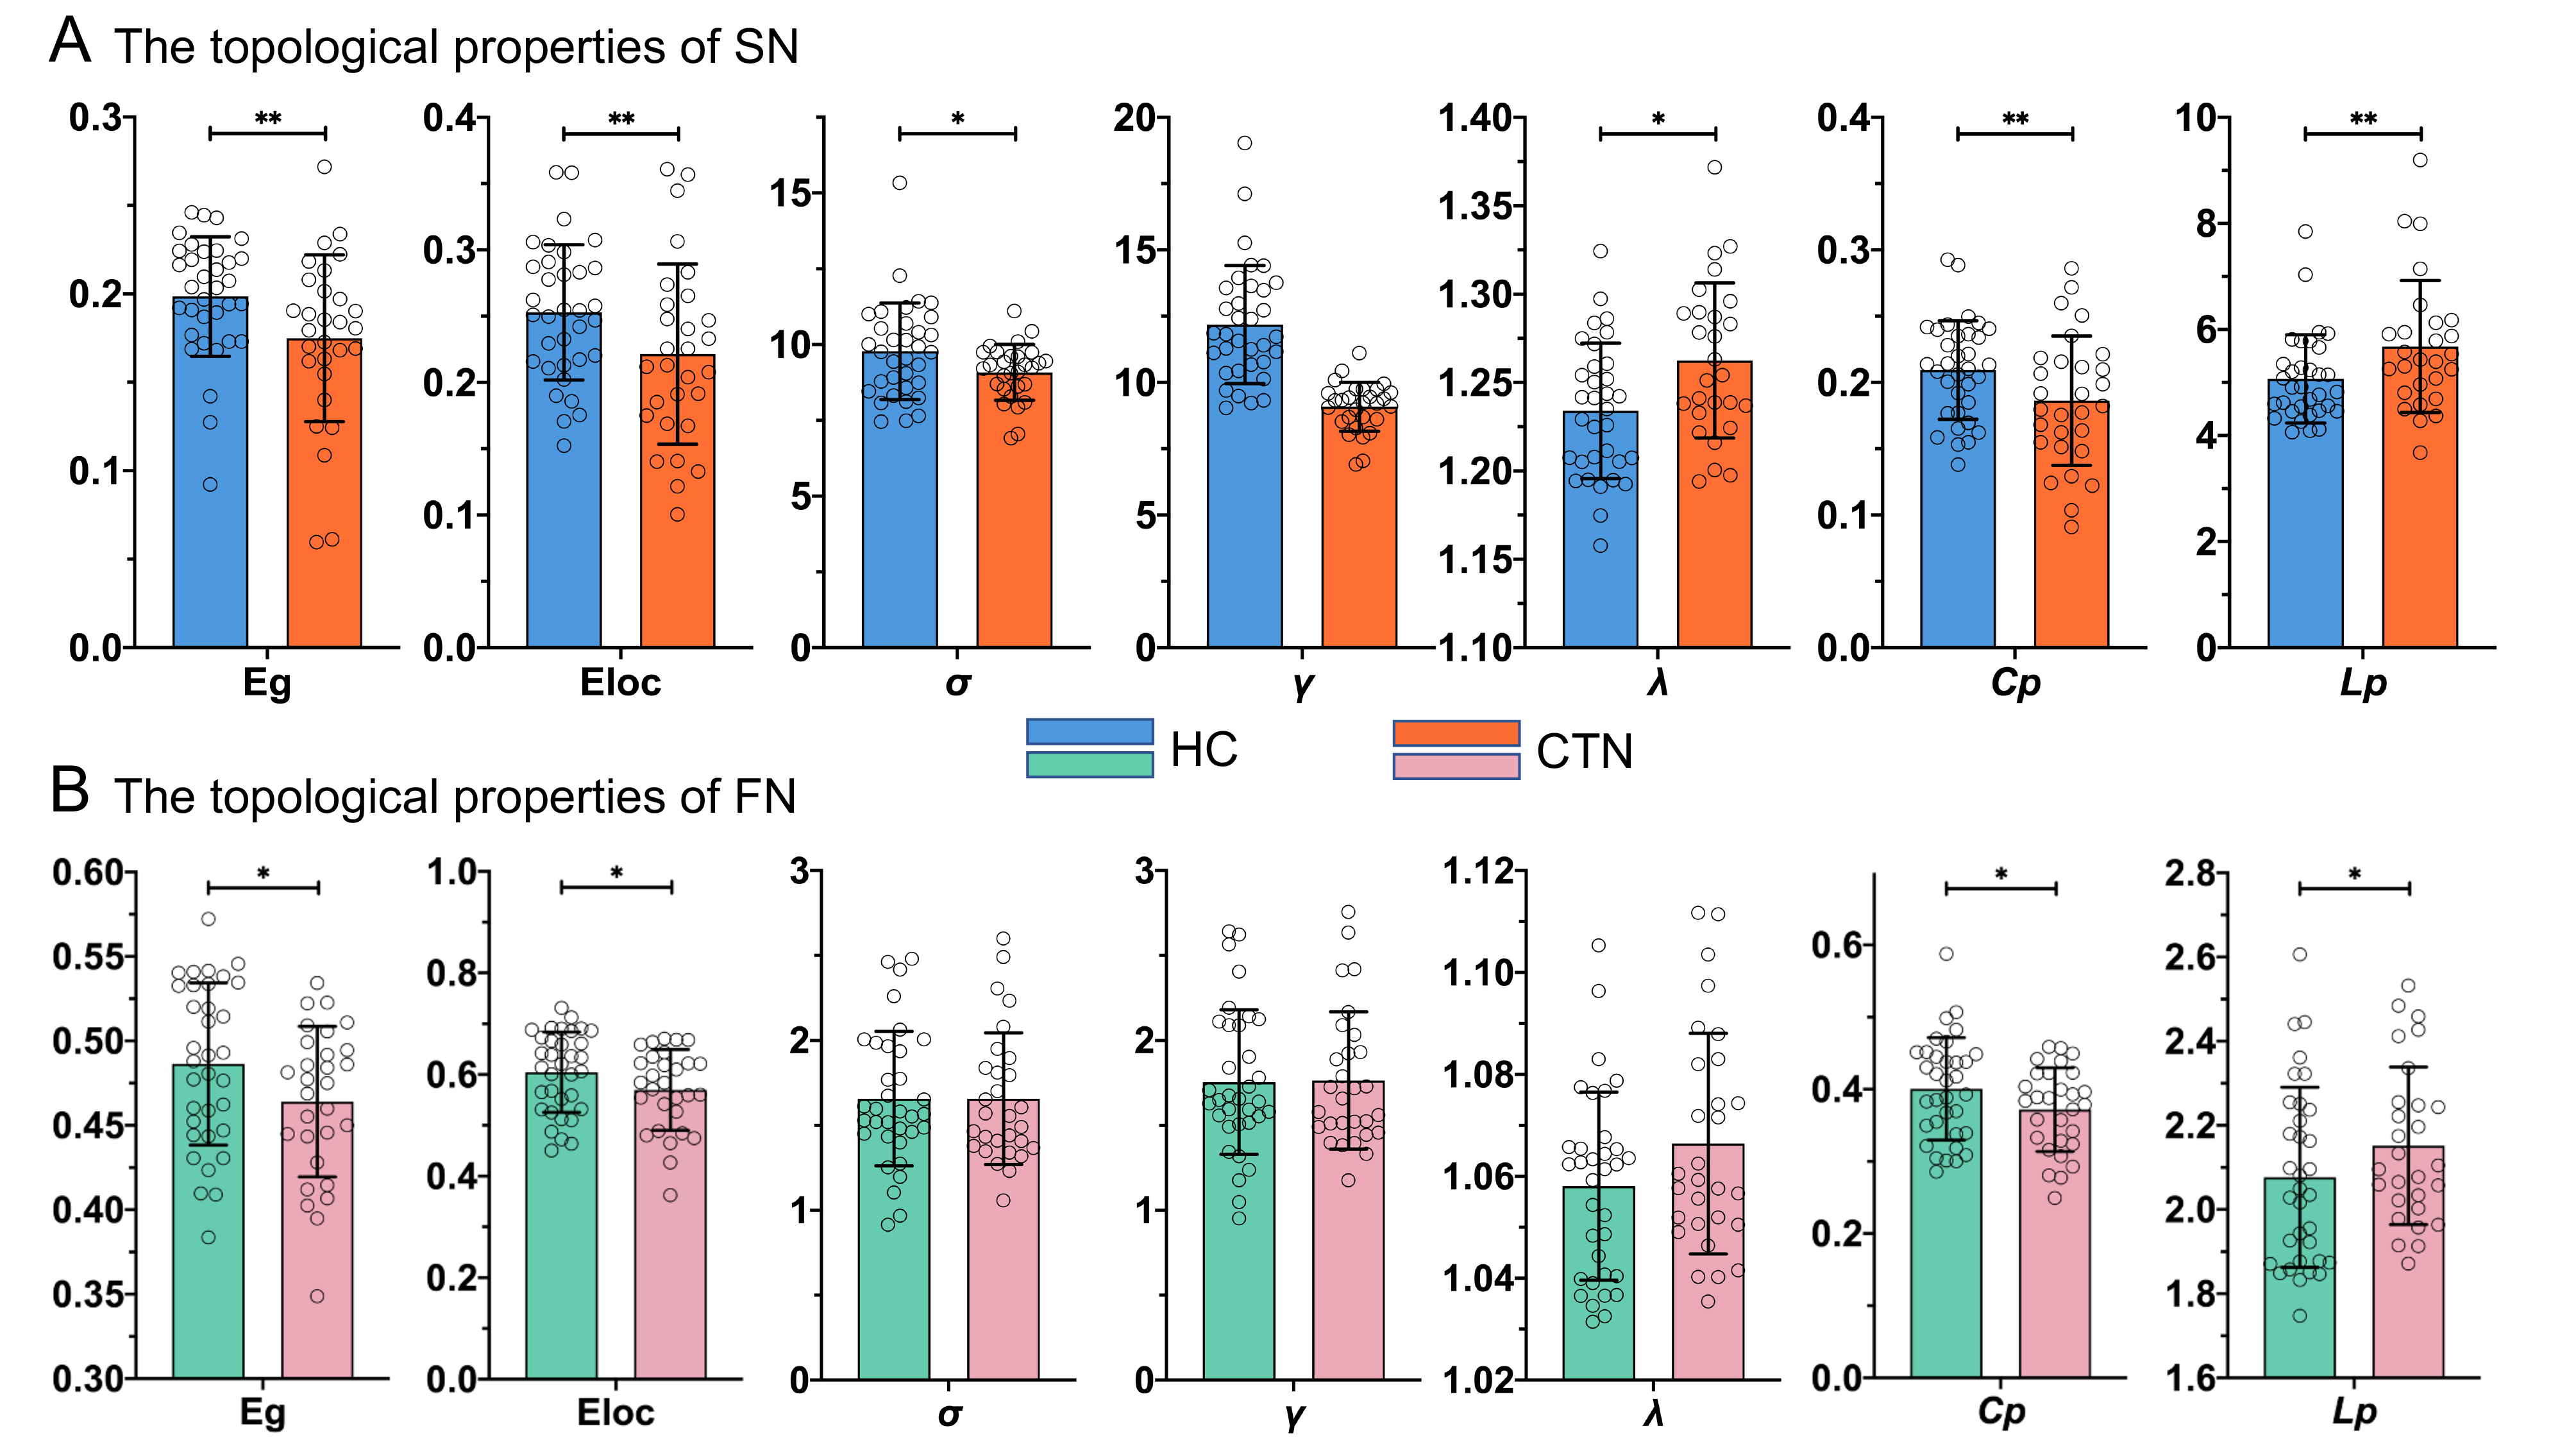
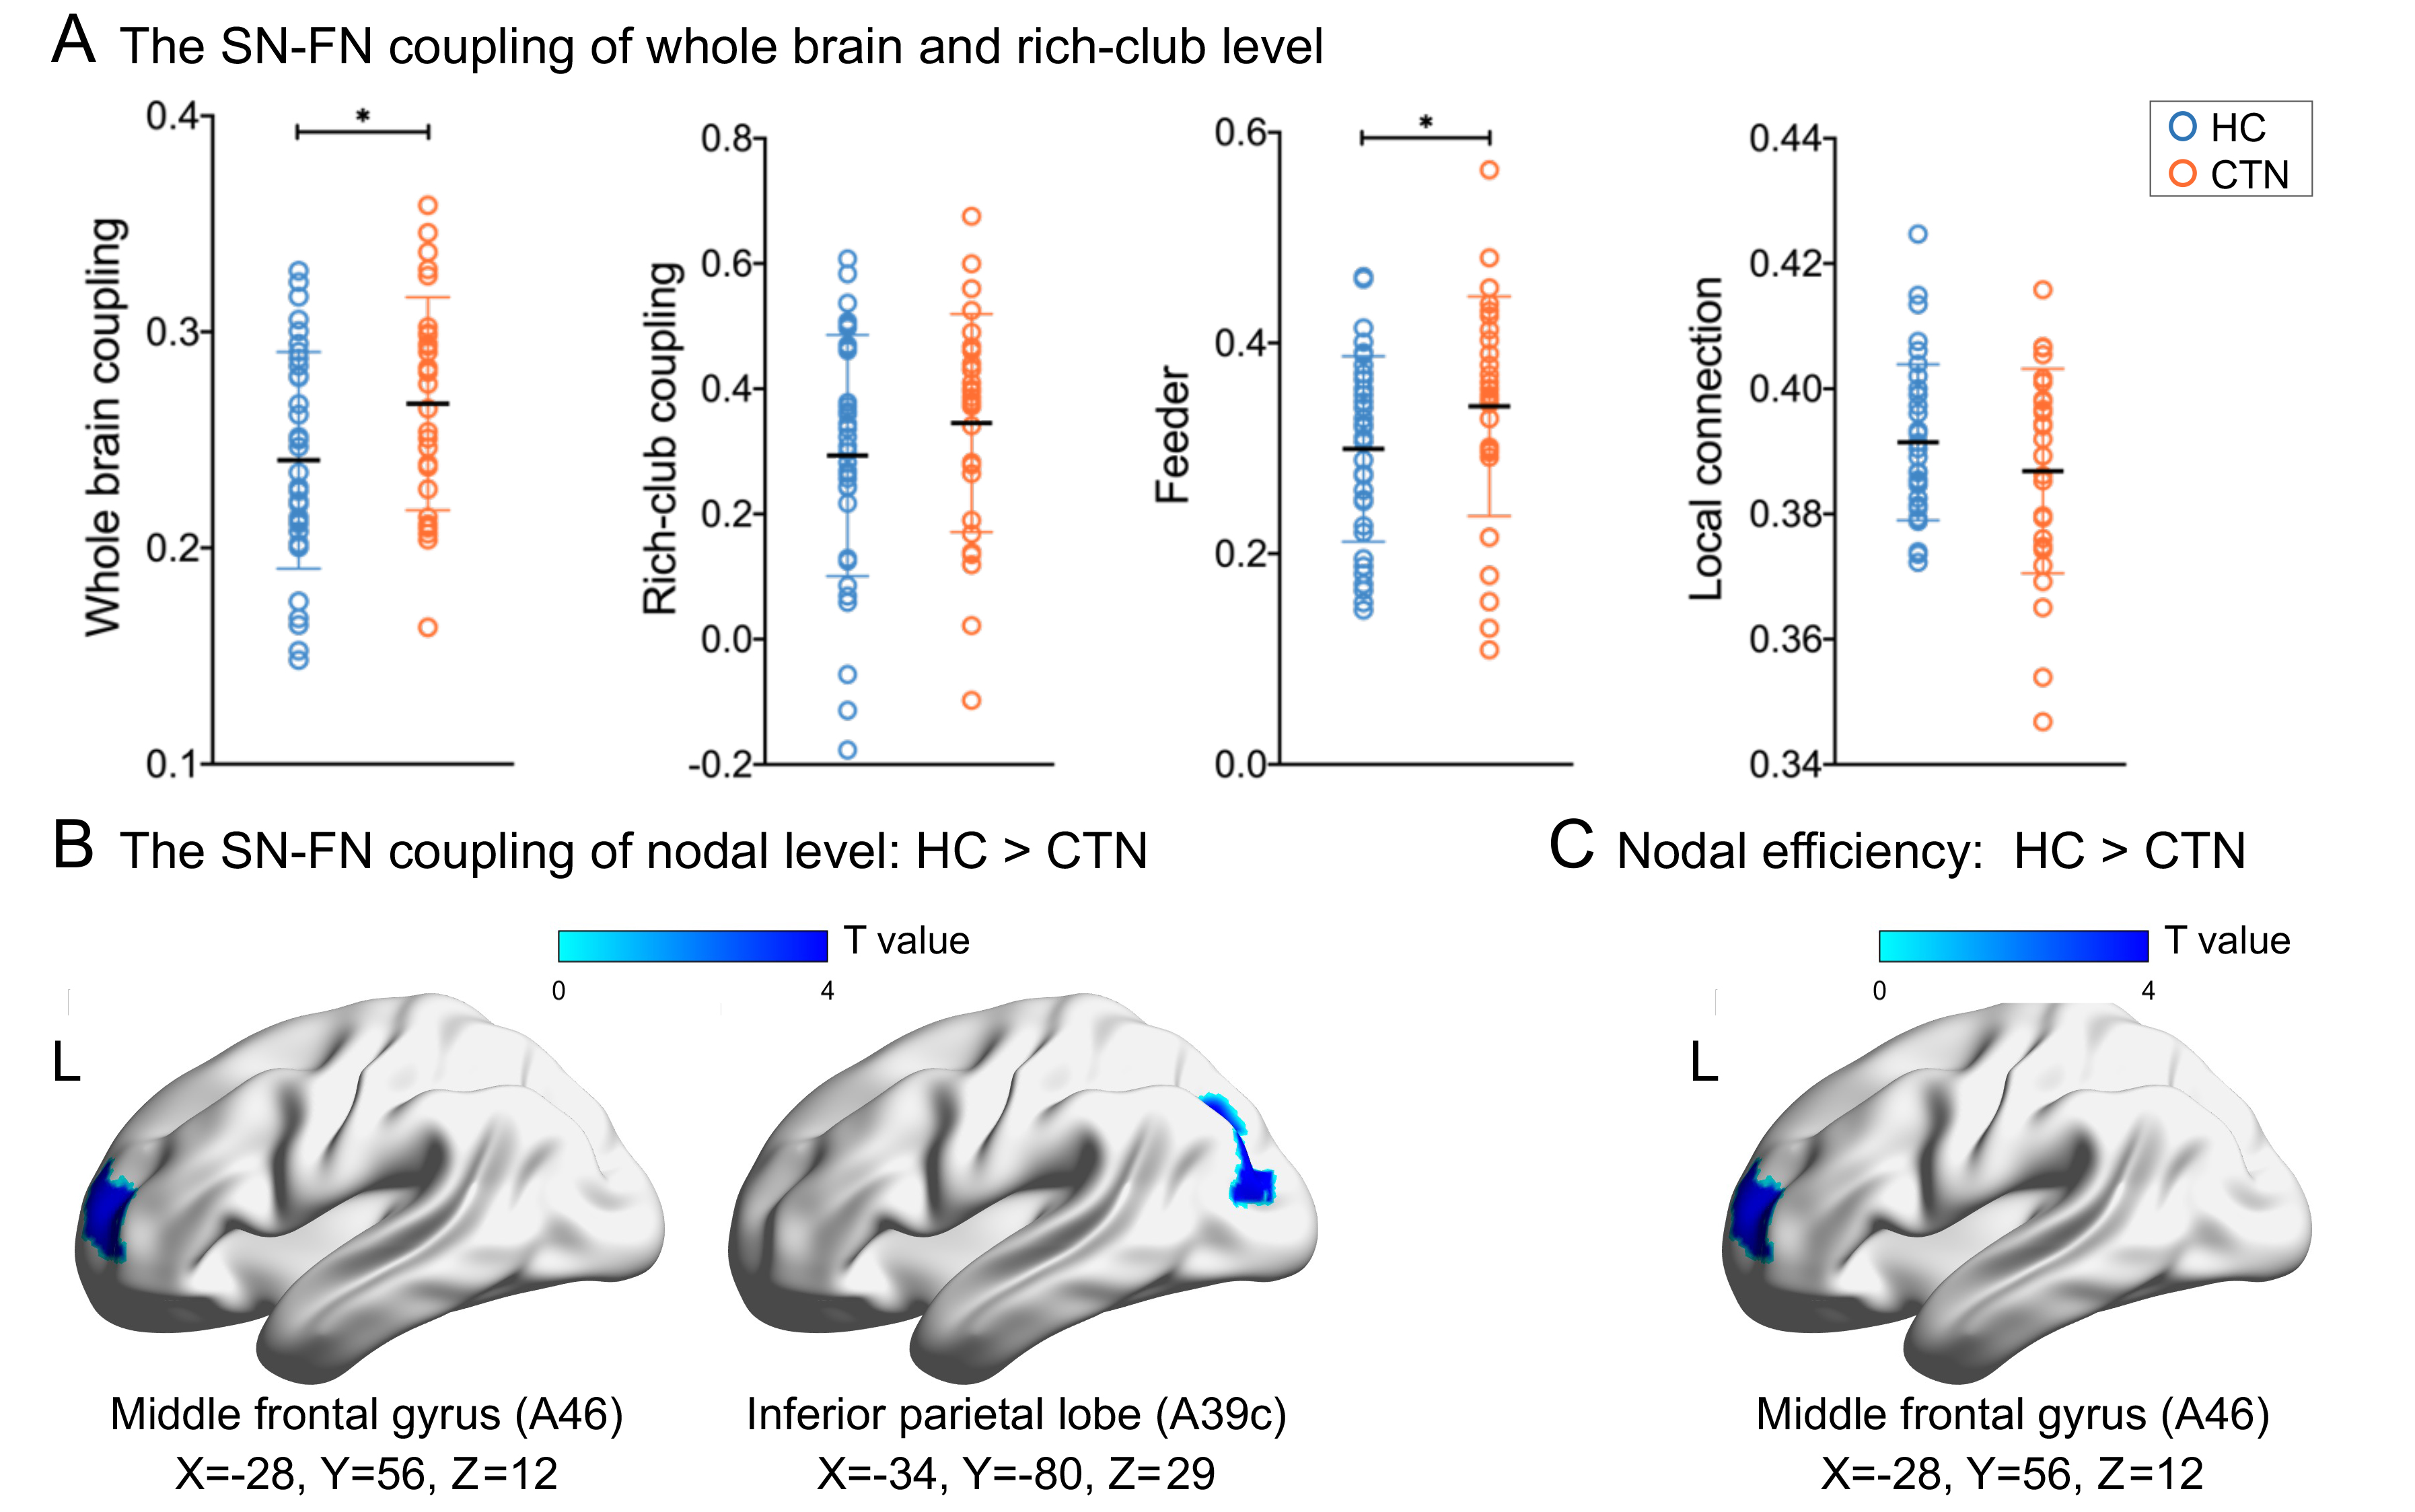
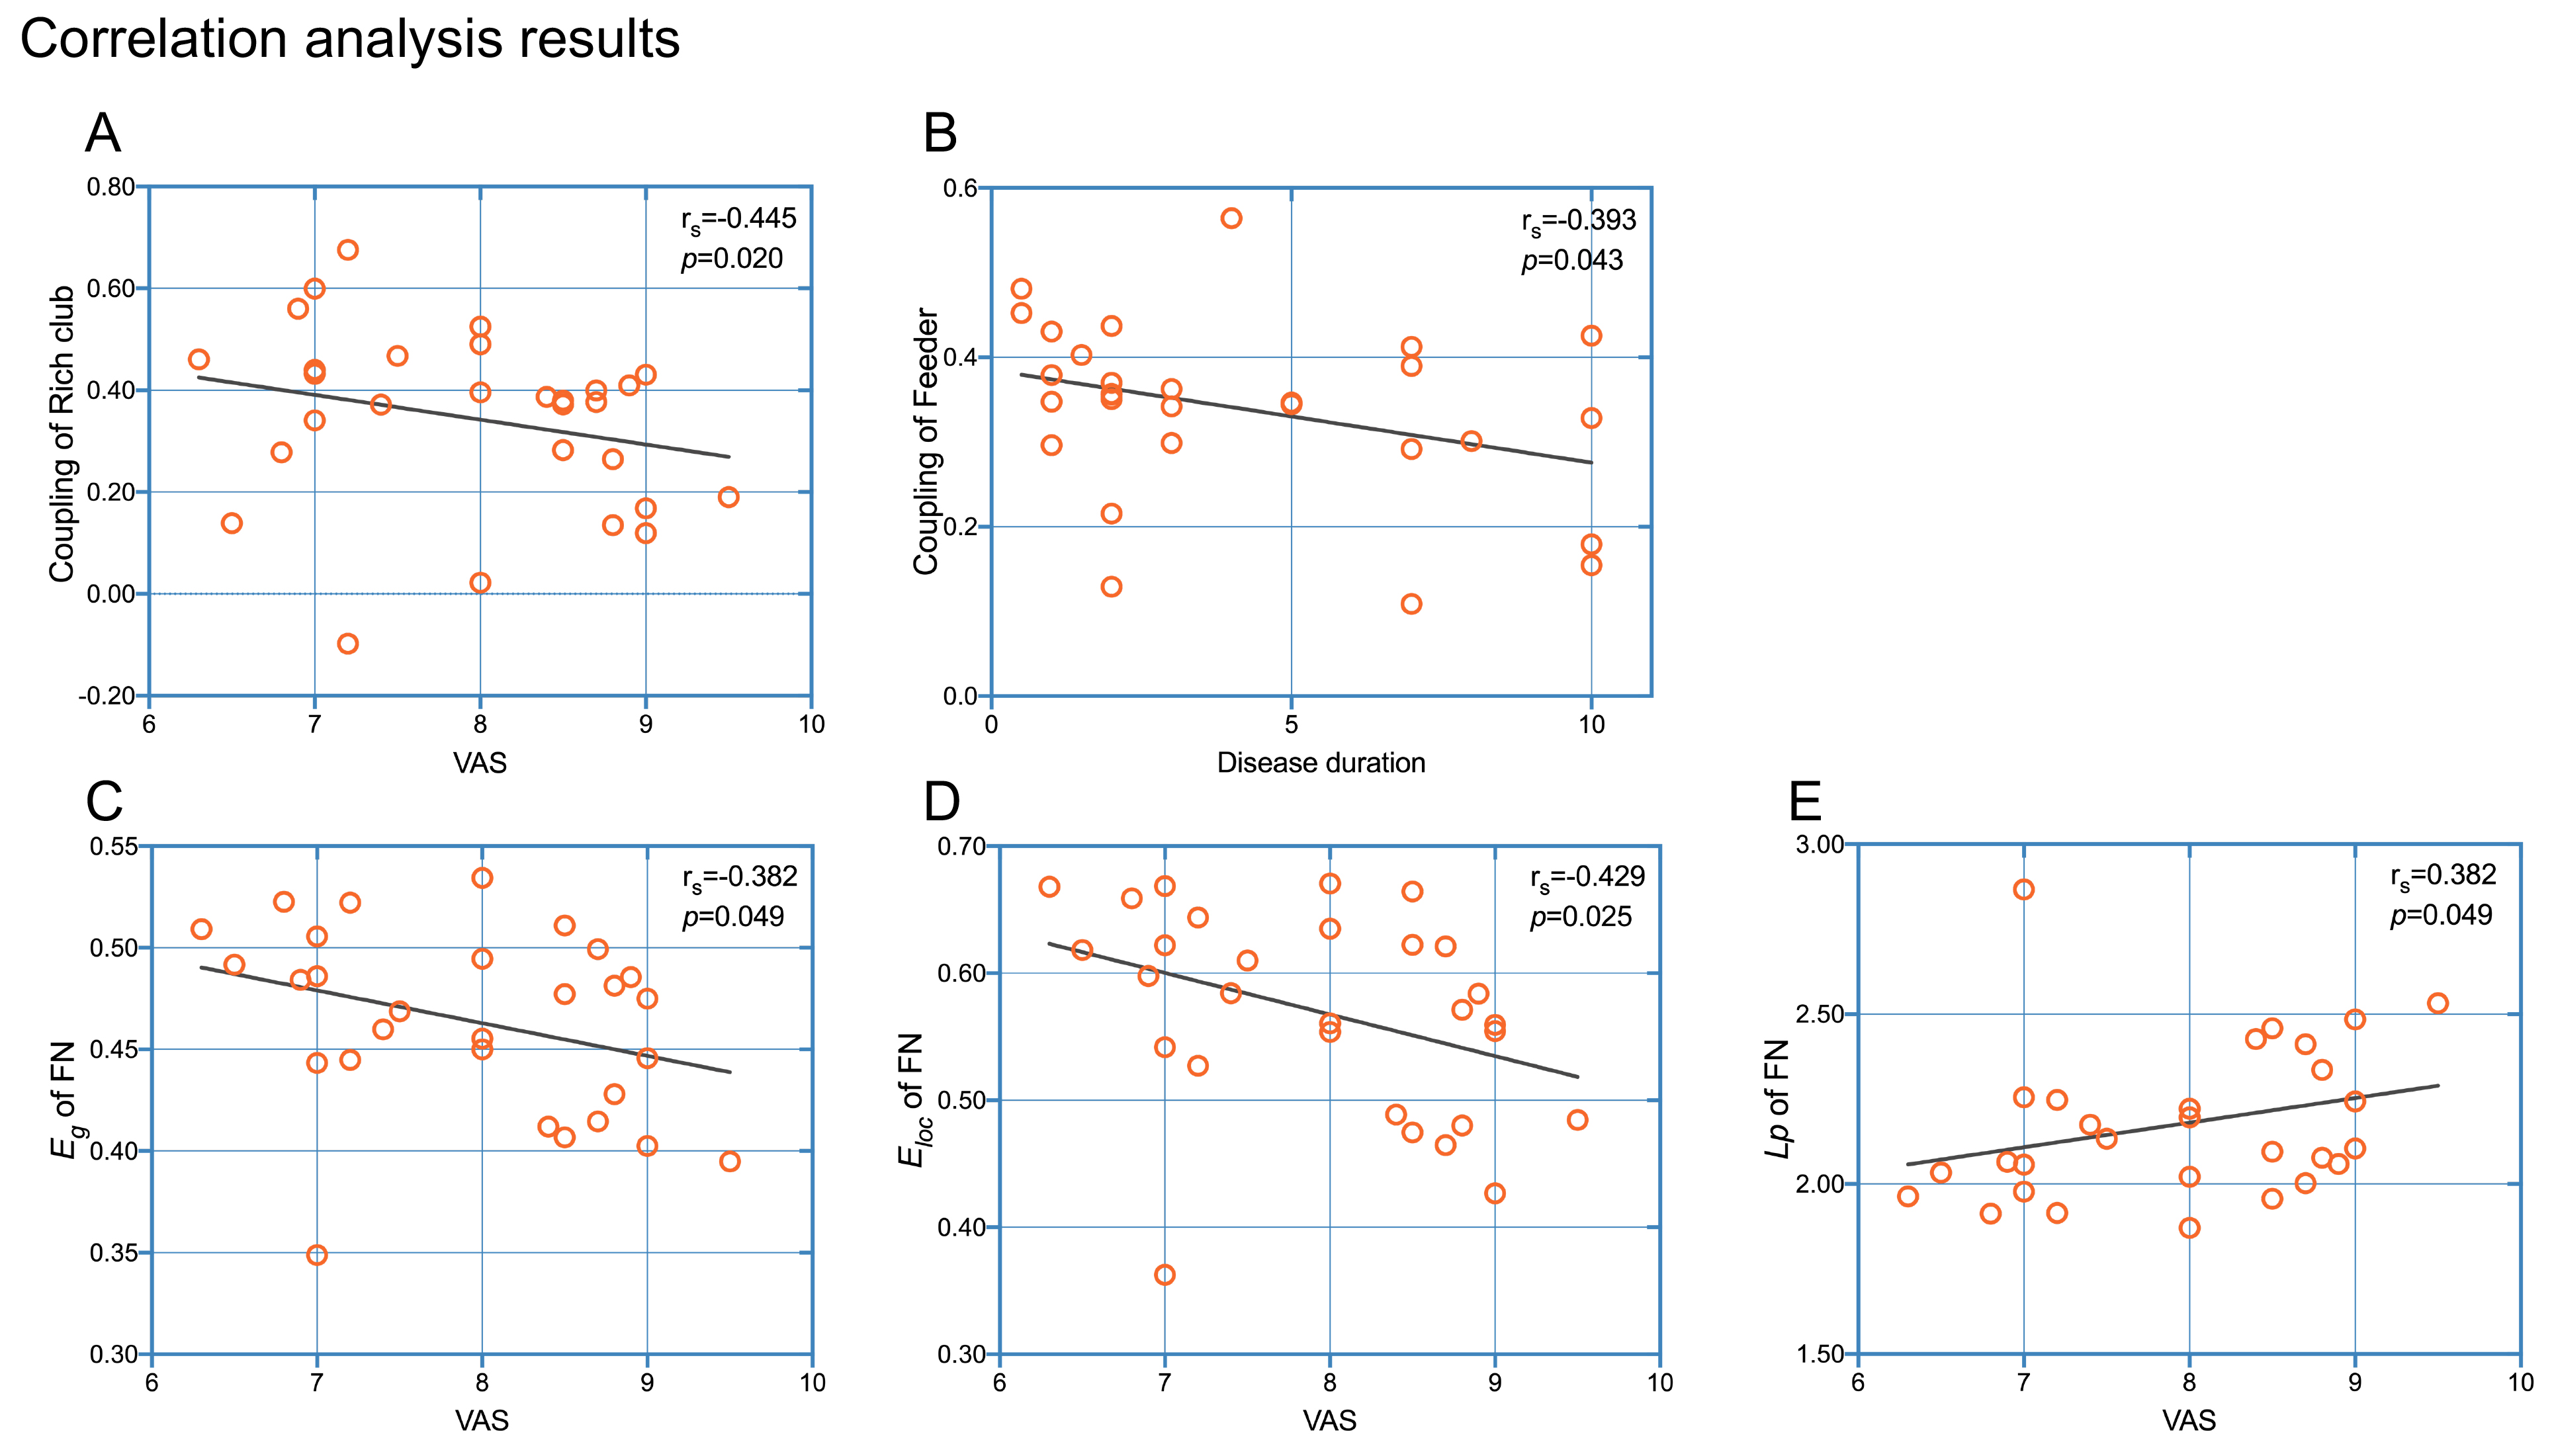
Compared with HCs, the CTN patients showed the decreased Eg, Eloc, Cp and Lp of both SN and FN (SN: pEg, pEloc, pCp, pLp both <0.01; FN: pEg, pEloc, pCp, pLp both <0.05), and reduced small-worldness in SN (pσ=0.018; pλ=0.012) (Figure 3). The lower Ne was found in the BN 19 area (p=0.018×10⁻², FDR corrected) (Figure 4C). In rich-club analysis, the top 16 (6.5%) highest-degree nodes were chosen to represent hub regions (Table 2, Figure 2B). We found the network coupling of feeder (connections between rich-club nodes and non-rich-club nodes) was higher in patients than in HCs (p=0.047). We also found the increased coupling degree of whole brain connections (p=0.019). However, the coupling of nodes (BN19 and 135) reduced (pMFG=0.082×10⁻³, pIPL=0.033×10⁻², FDR corrected) (Figure 4A, B). The VAS was negatively correlated with rich-club coupling, FN properties (Eg, Eloc), together with negative relation between disease duration and feeder coupling. While Lp of FN was positively correlated with VAS (Figure 5).Discussion
The topology of a brain network is of high relevance to its function, which can influence the efficiency of the information transfer among regions. Our findings of altered global topological properties may reflect the impairments on integration and segregation functions of CTN patients, which further lead to the disability of coping with the long-term paroxysmal nociceptive input6.Given that the rich-club nodes were mainly located in pain connectome regions (including control related network, default mode network and salience network), the stronger coupling of patients in feeder as well as the whole brain connections may suggest the FN were more constrained to corresponding SN7, which may reflect an adaptive and compensatory process. Considering the correlation analysis, the adaption may gradually weaken with disease progression and continuous disruptions on FN.
Furthermore, the dorsal lateral prefrontal cortex (containing MFG) plays a crucial role in endogenous cognitive control and top-down pain modulation8. The defects of MFG in both efficiency and coupling may imply the disturbance of frontoparietal network integrity and communication with adjacent regions, and compromised within-network information propagation, which might contribute to impaired endogenous pain modulatory function9.
Conclusion
Our study demonstrated that CTN patients had wide disruptions of SN and FN, accompanied by altered SN-FN coupling between networks in different scales. These findings may advance our understanding of the underlying neural mechanisms of CTN.Acknowledgements
This work was supported by the Natural Science Foundation of China (Grant No. 81960309).References
1. Chao-Gan Y, Yu-Feng Z (2010) DPARSF: A MATLAB Toolbox for "Pipeline" Data Analysis of Resting-State fMRI. Front Syst Neurosci 4:13. doi:10.3389/fnsys.2010.00013
2. Cui Z, Zhong S, Xu P et al (2013) PANDA: a pipeline toolbox for analyzing brain diffusion images. Front Hum Neurosci 7:42. doi:10.3389/fnhum.2013.00042
3. Fan L, Li H, Zhuo J et al (2016) The Human Brainnetome Atlas: A New Brain Atlas Based on Connectional Architecture. Cereb Cortex 26:3508-3526. doi:10.1093/cercor/bhw157
4. Hagmann P, Cammoun L, Gigandet X et al (2008) Mapping the structural core of human cerebral cortex. PLoS Biol 6:e159. doi:10.1371/journal.pbio.0060159
5. Honey C J, Sporns O, Cammoun L et al (2009) Predicting human resting-state functional connectivity from structural connectivity. Proc Natl Acad Sci U S A 106:2035-2040. doi:10.1073/pnas.0811168106
6. Lenoir D, Cagnie B, Verhelst H et al (2021) Graph Measure Based Connectivity in Chronic Pain Patients: A Systematic Review. Pain Physician 24:E1037-e1058.
7. Guo X, Yang F, Fan L et al (2021) Disruption of functional and structural networks in first-episode, drug-naïve adolescents with generalized anxiety disorder. J Affect Disord 284:229-237. doi:10.1016/j.jad.2021.01.088
8. Kong J, Jensen K, Loiotile R et al (2013) Functional connectivity of the frontoparietal network predicts cognitive modulation of pain. Pain 154:459-467. doi:10.1016/j.pain.2012.12.004
9. Lim M, Jassar H, Kim D J et al (2021) Differential alteration of fMRI signal variability in the ascending trigeminal somatosensory and pain modulatory pathways in migraine. J Headache Pain
Figures