1765
CNN-based Off-resonance Correction in Cardiac Spiral MRI
Shishuai Wang1, Pedro F Ferreira2, Zohya Khalique2, Margarita Gorodezky2, Malte Roehl2, Jialin Pu3, Dudley J Pennell2, Sonia Nielles-Vallespin2, and Andrew D Scott2
1Department of Physics, Imperial College London, London, United Kingdom, 2Cardiovascular Magnetic Resonance Unit, Royal Brompton Hospital and National Heart and Lung Institute, Imperial College London, London, United Kingdom, 3College of Information And Communication Engineering, Harbin Engineering University, Harbin, China
1Department of Physics, Imperial College London, London, United Kingdom, 2Cardiovascular Magnetic Resonance Unit, Royal Brompton Hospital and National Heart and Lung Institute, Imperial College London, London, United Kingdom, 3College of Information And Communication Engineering, Harbin Engineering University, Harbin, China
Synopsis
Spiral trajectories are time efficient but are susceptible to off-resonance artefacts. Many approaches to off-resonance correction require a high-quality B0 field map. Here we train a convolutional neural network to remove the off-resonance artefacts using simulated cardiac spiral MRI and validate our methods by applying this network to diffusion tensor cardiovascular MR (DTCMR) data acquired with spiral trajectories.
Motivation
Spiral k-space trajectories provide unique advantages including efficient centre-out k-space coverage, straightforward variable density interleaves, and resilience to motion artefacts1. However, despite these advantages, spiral imaging still lacks popularity in clinical routine. One important limiting factor is that spiral images are prone to off-resonance related blurring due to the rather long readouts and the gradients which are simultaneously varied in two directions1.Traditional field map-based methods are time consuming and rely heavily on field map's quality2. Recent studies have shown that using convolutional neural networks (CNN) to correct for off-resonance artefacts in spiral images may be a feasible alternative 3,4. While these recent studies have successfully trained off-resonance correction CNNs by using data acquired with off-resonance, in this work we demonstrate that an off-resonance correction CNN can be trained using simulated diffusion tensor cardiovascular MR (DTCMR) images.
Methods
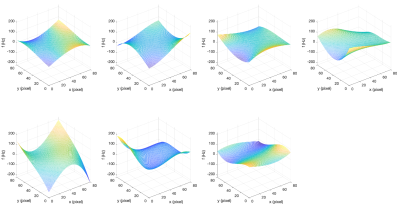
The available data for this research consists of mid-ventricular short-axis images acquired with a STEAM-EPI sequence5 at 2.8x2.8x8mm3 resolution. 1750 images from 15 subjects and two cardiac phases are included 6,7. Additionally, 7 field maps acquired in patients with myocardial infarction using a STEAM-spiral DTCMR sequence8 are used as basis for simulated field maps9.As the 7 available field maps are not co-registered with the EPI images, we generate simulated field maps by segmenting the heart in the 7 field maps and fitting the data within the segmented region to 3rd order polynomial surfaces which are extrapolated over the whole field of view (Figure 1).
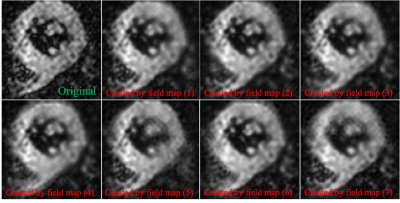
We simulate off-resonance blurred spiral images using the original EPI images and simulated field maps as input. Off-resonance simulation was based on the frequency-segmented correction method2. The input EPI images are resampled along spiral trajectories using an inverse gridding algorithm. Spiral data are replicated and spatially invariant off-resonance artefacts for different frequencies are simulated for each replicate by adding phase errors to each sampling point:
$$\Delta \phi_{\text {off-resonance }}=2 \pi \cdot \mathrm{i} \cdot \mathrm{T} \cdot f_{n}$$
where i indicates the index of the sampling point, T is the time interval between adjacent sampling points, and $$$f_{n}$$$ is the nth constant off-resonance frequency in the range of [-250,250] Hz in steps of 10 Hz. We then grid the spiral data with phase errors to Cartesian image space with constant off-resonance artefacts.
The final step of simulation is to pixel-wise select the data from the constant off-resonance images based on simulated field maps. For example, if the off-resonance frequency at $$$(x,y)$$$ in a field map is 50 Hz, then we copy the value at $$$(x,y)$$$ from the 50 Hz constant off-resonance image to $$$(x,y)$$$ in the final image. As field map values do not, in general, correspond exactly with the constant off-resonance frequencies used, linear interpolation between two closest constant frequencies images is used.
Subsequently we set the original images as ground truth and the simulated blurred versions as input to train a deblurring auto-encoder CNN which consists of 6 2D-convolution layers (encoder) and 6 up-sampling layers (decoder). We use mean square error (MSE) as the loss function and ADAM as the optimizer. The dataset is split 80/20 into training and validation sets. Learning rate is set as 0.0003 with 66 epochs.
CNN-based deblurring performance is assessed by applying it to uncorrected STEAM DTCMR data acquired with spiral trajectories in 4 healthy volunteers8 in the same imaging plane and at the same spatial resolution as the training data. Sharpness was measured at the endocardial border10. CNN-corrected images are compared to data corrected with a field map-based frequency segmented correction.
Results
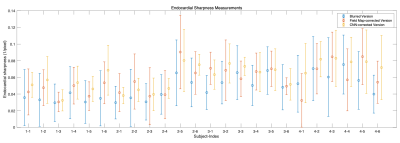
The CNN can effectively remove blurring in the training dataset (see Figure 3). In the test data acquired with spiral trajectories, the CNN-corrected data shows reduced blurring relative to the uncorrected data and avoids artefacts present in the field map-corrected images, introduced by imperfections in the field map (see Figure 4).Figure 5 shows the sharpness measured in the uncorrected data, the field map-corrected data and the CNN-corrected data. From the 24 randomly selected cases, the mean±standard deviation sharpness is 0.048±0.014, 0.057±0.017 and 0.062±0.015 for the uncorrected, field map corrected and CNN corrected data respectively, showing the superior performance of CNN.
Discussion
The proposed CNN-based method trained using simulated images alone for off-resonance correction in spiral cardiac MRI performed at least as well as the field map-based correction. Sharpness values are highest for the CNN-based method and correction performance is visually excellent. In contrast to the field map-based correction, the CNN-based method does not introduce additional artefacts in the background and near the edge of myocardium. Finally, the CNN-based method may be timesaving as acquisition of field maps is not required.Future work will enhance the CNN’s generalization by using a larger training dataset containing data from other types of acquisitions and using more realistic field maps. We also aim to make use of the multiple frames available in many CMR studies (e.g., b-values, directions, and averages in DTCMR) when training our CNN to improve performance and investigate its performance for correcting other spiral artefacts including T2* related blurring.
Acknowledgements
This work was funded by British Heart Foundation Program Grant RG/19/1/34160.References
1. Delattre BMA, Heidemann RM, Crowe LA, Vallée J-P, Hyacinthe J-N. Spiral demystified. Magn. Reson. Med. 2010;28(6):862-81.2. Man L-C, Pauly JM, Macovski A. Multifrequency interpolation for fast off-resonance correction. Magn. Reson. Med. 1997;37(5):785-92.
3. Zeng DY, Shaikh J, Holmes S, Brunsing RL, Pauly JM, Nishimura DG, et al. Deep residual network for off-resonance artifact correction with application to pediatric body MRA with 3D cones. Magn. Reson. Med. 2019;82(4):1398-411.
4. Lim Y, Bliesener Y, Narayanan S, Nayak KS. Deblurring for spiral real-time MRI using convolutional neural networks. Magn. Reson. Med. 2020;84(6):3438-52.
5. Nielles-Vallespin S, Mekkaoui C, Gatehouse P, Reese TG, Keegan J, Ferreira PF, et al. In vivo diffusion tensor MRI of the human heart: Reproducibility of breath-hold and navigator-based approaches. Magn. Reson. Med. 2013;70(2):454-65.
6. Scott AD, Nielles-Vallespin S, Ferreira PF, Khalique Z, Gatehouse PD, Kilner P, et al. An in-vivo comparison of stimulated-echo and motion compensated spin-echo sequences for 3 T diffusion tensor cardiovascular magnetic resonance at multiple cardiac phases. J. Cardiovasc. Magn. Reson. 2018;20(1):1.
7. Khalique Z, Scott AD, Ferreira PF, Nielles-Vallespin S, Firmin DN, Pennell DJ. Diffusion tensor cardiovascular magnetic resonance in hypertrophic cardiomyopathy: a comparison of motion-compensated spin echo and stimulated echo techniques. MAGMA. 2020;33(3):331-42.
8. Gorodezky M, Ferreira PF, Nielles-Vallespin S, Gatehouse PD, Pennell DJ, Scott AD, et al. High resolution in-vivo DT-CMR using an interleaved variable density spiral STEAM sequence. Magn. Reson. Med. 2019;81(3):1580-94.
9. Gorodezky M, Ferreira PF, Khalique Z, Nielles-Vallespin S, Silva R, Pennell DJ, Scott AD, and Firmin DN. Diffusion tensor cardiovascular magnetic resonance in myocardial infarction: A comparison between high resolution spiral and standard resolution EPI STEAM. In: International Society for Magnetic Resonance in Medicine Annual Meeting. ; 2019. p. #0780.
10. Ahmad R, Ding Y, Simonetti OP. Edge sharpness assessment by parametric modeling: Application to magnetic resonance imaging. Concepts in Magnetic Resonance Part A. 2015;44(3):138-49.
Figures

Figure 1: 7 Simulated field maps based on the 7 real field maps. Note that these simulated field maps are smooth everywhere and avoid producing misaligned edge artefacts and noise related artefacts in the final simulated images. We also generate more simulated field maps by rotating these surfaces (90/180/270˚) or adding constant offsets (amplitude 50/100/150 Hz) to them, where the latter option is used to simulate severe off-resonance effects.

Figure 2: Example of off-resonance simulation results for one subject. The blurred versions (1)-(7) are generated by the simulated field maps (1)-(7) in Figure 1 respectively.

Figure 3: Examples of CNN deblurring results for simulated images. From visual evaluation, the proposed CNN can restore the lost information and details due to blurring. The deblurring results are very similar to the corresponding ground truth images.

Figure 4: Examples of CNN deblurring results applied to data acquired with spiral trajectories. We use 4 groups of images (corresponding to 4 different subjects) with off-resonance artefacts to evaluate the proposed CNN’s performance. Red arrows point the additional artefacts introduced by the field map-correction method, while images corrected with the CNN-based method do not include these artefacts.

Figure 5: Endocardial sharpness measurements, where a higher value indicates a sharper edge. We randomly choose 6 of the images acquired with a spiral trajectory from each subject and provide the mean±standard deviation in each case. The sharpness was calculated in the uncorrected (blurred version), field map-corrected and CNN-corrected images. Note that in some cases the field map-based method gives lower sharpness than the uncorrected data due to imperfections in the field map at the endocardium.
DOI: https://doi.org/10.58530/2022/1765