1753
Intraocular pressure elevation induces vascular and functional brain changes: A relative cerebrovascular reactivity resting-state fMRI Study
Russell W. Chan1,2, Yixi Xue1, Ji Won Bang1, Muneeb A. Faiq1, Thajunnisa A. Sajitha1, Royce P. Lee1, Peiying Liu3, Christopher K. Leung4, Gadi Wollstein1, Joel S. Schuman1, and Kevin C. Chan1,5
1Department of Ophthalmology, New York University Grossman School of Medicine, New York, NY, United States, 2Neuroscience Institute, New York University Grossman School of Medicine, New York, NY, United States, 3Department of Diagnostic Radiology and Nuclear Medicine, University of Maryland School of Medicine, Baltimore, MD, United States, 4Department of Ophthalmology, The University of Hong Kong, Hong Kong, Hong Kong, 5Department of Radiology, New York University Grossman School of Medicine, New York, NY, United States
1Department of Ophthalmology, New York University Grossman School of Medicine, New York, NY, United States, 2Neuroscience Institute, New York University Grossman School of Medicine, New York, NY, United States, 3Department of Diagnostic Radiology and Nuclear Medicine, University of Maryland School of Medicine, Baltimore, MD, United States, 4Department of Ophthalmology, The University of Hong Kong, Hong Kong, Hong Kong, 5Department of Radiology, New York University Grossman School of Medicine, New York, NY, United States
Synopsis
Recently, we used a novel resting-state fMRI method to map relative cerebrovascular reactivity (rCVR) without gas challenge, and demonstrated decreased rCVR in the visual cortex and increased rCVR in the basal forebrain in glaucoma patients relative to healthy subjects. However, the underlying mechanisms remain unclear. Here, we applied a hydrogel-induced glaucoma mouse model to chronically elevate intraocular pressure, mapped rCVR using resting-state fMRI, and measured optomotor responses. Our results showed similar patterns of rCVR changes along with visual impairments, indicating a role of chronic intraocular pressure elevation on the widespread vascular and functional brain changes in experimental glaucoma.
INTRODUCTION
Cerebrovascular reactivity (CVR) is the response of cerebral blood vessels to vasoactive stimuli. Whole-brain CVR mapping is typically performed using hypercapnic gas inhalation as a vasoactive challenge while collecting blood-oxygen-level-dependent (BOLD) fMRI images1. The required gas inhalation setup is an obstacle for routine clinical and preclinical use. Recently, relative CVR (rCVR) mapping in humans is achieved using resting-state fMRI (rsfMRI)2,3 without gas challenges, and has been shown to resemble hypercapnia-inhalation CVR mapping. However, the feasibility for rodent rCVR mapping for preclinical studies remains unknown.Glaucoma can cause progressive vision loss and is a leading cause of irreversible blindness. It is primarily considered an eye disease with widespread involvements of the brain. Doppler ultrasound studies showed CVR reduction in the visual cortex (VC)4 and middle cerebral artery5,6 in glaucoma patients. However, whether and how glaucoma could induce widespread CVR changes in other brain regions are yet to be elucidated, partly due to limited whole-brain CVR mapping techniques. Beyond the primary visual pathway, the basal forebrain (BF) has cholinergic projections to the VC7-10, and can play a role in visual perception, visual attention and cortical plasticity11-16. Since VC may possess lower choline levels in glaucoma17,18, we postulate that BF is involved in glaucoma17. Our recent preliminary results in glaucoma patients demonstrated rCVR decrease in VC and rCVR increase in BF with glaucoma severity19, yet the underlying mechanisms remain to be elucidated. Since intraocular pressure (IOP) is a major risk factor for glaucoma, we hypothesize that IOP increase can induce rCVR changes in the glaucomatous brain along with visual impairments. To address these issues, we applied a novel glaucoma mouse model to elevate IOP20, mapped whole-brain rCVR using rsfMRI, and measured optomotor responses (OMR).
METHODS AND MATERIALS
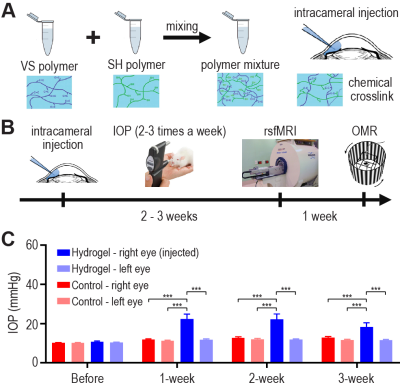
For glaucoma model, C57BL/6J mice (male, 15-weeks, n=15) received intracameral injection of cross-linking hydrogel to the right eye to obstruct aqueous outflow and induce chronic IOP elevation (Figure 1A). Controls (male, 15-weeks, n=13) were untreated. IOP was measured in both eyes 2-3 times per week for 3 weeks under 1.5% isoflurane using a rebound tonometer (TonoLab, Finland), followed by awake OMR experiments and rsfMRI using a combination of 0.25-0.5% isoflurane and a bolus of 0.1mg/kg dexmedetomidine (Figure 1B). 7T MRI scanner with cyro-probe (Bruker, Germany) was used for rsfMRI experiments with a single-shot gradient-echo echo-planar-imaging sequence with TE/TR=12/1000ms, FOV=16×7mm2, 80×35 matrix, 30 contiguous 0.5-mm slices, and 600 volumes. rCVR maps were generated from rsfMRI data with MriCloud (braingps.mricloud.org/rs-cvr), and then co-registered across animals using SPM12. rsfMRI images underwent standard pre-processing using SPM12 (fil.ion.ucl.ac.uk/spm/), and power spectra and functional connectivity were calculated. OMR was assessed using the OptoMotry virtual-reality device (CerebralMechanics, Canada) in freely moving mice to quantify the visual acuity and contrast sensitivity for each eye. Results are presented as mean±SEM.RESULTS AND DISCUSSION
Chronic IOP elevation leads to rCVR decrease in VC and rCVR increase in BF
Sustained IOP elevation was confirmed in the right eyes of the glaucoma model (Figure 1C). Averaged rCVR maps were calculated for the groups (Figure 2A) which resemble conventional CVR maps21,22. Since over 90% of mouse optic nerve fibers project to the contralateral visual brain, rCVR decreased in the left VC (not the right), while rCVR increased in the right BF in the glaucoma model (Figure 2A). These rCVR changes were inversely coupled (Figure 2B). In addition, IOP of the injected eye is inversely correlated with rCVR in the left VC, while positively correlated with rCVR in the right BF (Figure 2C).Elevated IOP induced OMR impairment is coupled with BF rCVR increase
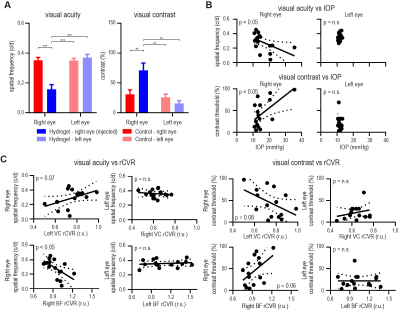
The OMR revealed a decrease in visual acuity and an increase in visual contrast threshold for the injected eye (Figure 3A), indicating visual impairment. These changes were coupled with IOP elevation (Figure 3B). Furthermore, the decrease in visual acuity was inversely correlated with rCVR in the BF (Figure 3C).Global signal increase and bilateral functional connectivity (fc) decrease in experimental glaucoma
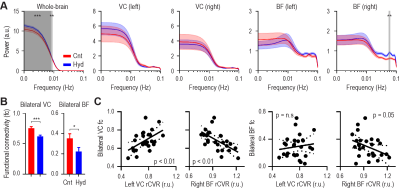
Since inactivation of the BF decreases rsfMRI global signal23, we also assess the whole-brain in addition to the left and right VC and BF. Power spectra of the global signal and right BF signal showed significantly higher amplitude in the glaucoma model at the lower (0.001-0.009Hz) and higher (0.055-0.063Hz) frequency ranges, respectively (Figure 4A), indicating the right BF is more active in glaucoma. Bilateral VC and BF fc were decreased in the glaucoma model (Figure 4B). The bilateral VC fc was coupled with rCVR in the left VC, while inversely coupled with rCVR in the right BF (Figure 4C).Involvements of the BF diagonal band of Broca (DB) upon IOP elevation
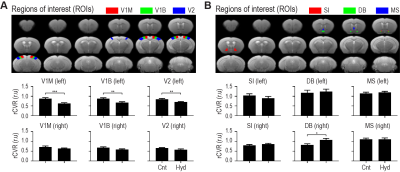
We further analyzed sub-regions of the VC and BF. rCVR in the left monocular region of the primary VC (V1M), left binocular region of the primary VC (V1B) and left secondary VC (V2) were all significantly lower (Figure 5A), while only right DB rCVR was significantly higher in the glaucoma model compared to control (Figure 5B). These results suggest that elevated IOP decreases the rCVR in the whole left VC, while increases specifically in DB of the right BF. Future studies investigating the causality of IOP-BF, IOP-VC and BF-VC (or specifically DB-VC) influences in glaucoma may improve our fundamental understanding of disease etiology and guide better strategies for early detection and treatment.CONCLUSION
Mouse rCVR mapping using rsfMRI is feasible in detecting elevated IOP induced widespread brain changes. rCVR, power spectra, and fc changes indicate the vascular and functional involvements in glaucoma both within and beyond the primary visual pathways.Acknowledgements
This work was supported in part by the National Institutes of Health P30-CA016087, P41-EB017183, R01-EY028125 and UF1-NS107680 (Bethesda, Maryland); BrightFocus Foundation G2019103 (Clarksburg, Maryland); Research to Prevent Blindness/Stavros Niarchos Foundation International Research Collaborators Award (New York, New York); and an unrestricted grant from Research to Prevent Blindness to NYU Langone Health Department of Ophthalmology (New York, New York).References
- Lu, H. et al. MRI mapping of cerebrovascular reactivity via gas inhalation challenges. J Vis Exp, doi:10.3791/52306 (2014).
- Liu, P. et al. Cerebrovascular reactivity mapping without gas challenges. Neuroimage 146, 320-326, doi:10.1016/j.neuroimage.2016.11.054 (2017).
- Liu, P. et al. Cerebrovascular Reactivity Mapping Using Resting-State BOLD Functional MRI in Healthy Adults and Patients with Moyamoya Disease. Radiology 299, 419-425, doi:10.1148/radiol.2021203568 (2021).
- Zhang, S. et al. Reduced cerebrovascular reactivity in posterior cerebral arteries in patients with primary open-angle glaucoma. Ophthalmology 120, 2501-2507, doi:10.1016/j.ophtha.2013.05.017 (2013).
- Harris, A. et al. Reduced cerebrovascular blood flow velocities and vasoreactivity in open-angle glaucoma. Am J Ophthalmol 135, 144-147, doi:10.1016/s0002-9394(02)01927-x (2003).
- Arslan, G. D. et al. Assessment of Cerebral Vasomotor Reactivity in Patients With Primary Open-angle Glaucoma and Ocular Hypertension Using the Breath-Holding Index. J Glaucoma 30, 157-163, doi:10.1097/IJG.0000000000001711 (2021).
- Dinopoulos, A., Eadie, L. A., Dori, I. & Parnavelas, J. G. The development of basal forebrain projections to the rat visual cortex. Exp Brain Res 76, 563-571, doi:10.1007/BF00248913 (1989).
- Carey, R. G. & Rieck, R. W. Topographic projections to the visual cortex from the basal forebrain in the rat. Brain Res 424, 205-215, doi:10.1016/0006-8993(87)91463-6 (1987).
- Huppe-Gourgues, F., Jegouic, K. & Vaucher, E. Topographic Organization of Cholinergic Innervation From the Basal Forebrain to the Visual Cortex in the Rat. Front Neural Circuits 12, 19, doi:10.3389/fncir.2018.00019 (2018).
- Liu, A. K. L. et al. Review: Revisiting the human cholinergic nucleus of the diagonal band of Broca. Neuropathol Appl Neurobiol 44, 647-662, doi:10.1111/nan.12513 (2018).
- Kang, J. I., Groleau, M., Dotigny, F., Giguere, H. & Vaucher, E. Visual training paired with electrical stimulation of the basal forebrain improves orientation-selective visual acuity in the rat. Brain Struct Funct 219, 1493-1507, doi:10.1007/s00429-013-0582-y (2014).
- Zaborszky, L. et al. Specific Basal Forebrain-Cortical Cholinergic Circuits Coordinate Cognitive Operations. J Neurosci 38, 9446-9458, doi:10.1523/JNEUROSCI.1676-18.2018 (2018).
- Bhattacharyya, A., Veit, J., Kretz, R., Bondar, I. & Rainer, G. Basal forebrain activation controls contrast sensitivity in primary visual cortex. BMC Neurosci 14, 55, doi:10.1186/1471-2202-14-55 (2013).
- Goard, M. & Dan, Y. Basal forebrain activation enhances cortical coding of natural scenes. Nat Neurosci 12, 1444-1449, doi:10.1038/nn.2402 (2009).
- Botly, L. C. P., Baxter, M. G. & De Rosa, E. in Encyclopedia of Neuroscience (ed Larry R. Squire) 47-52 (Academic Press, 2009).
- Pinto, L. et al. Fast modulation of visual perception by basal forebrain cholinergic neurons. Nat Neurosci 16, 1857-1863, doi:10.1038/nn.3552 (2013).
- Faiq, M. A., Wollstein, G., Schuman, J. S. & Chan, K. C. Cholinergic nervous system and glaucoma: From basic science to clinical applications. Prog Retin Eye Res 72, 100767, doi:10.1016/j.preteyeres.2019.06.003 (2019).
- Murphy, M. C. et al. Retinal Structures and Visual Cortex Activity are Impaired Prior to Clinical Vision Loss in Glaucoma. Sci Rep 6, 31464, doi:10.1038/srep31464 (2016).
- Chan, R. W. et al. Cerebrovascular reactivity changes in glaucoma patients using resting-state fMRI. ISMRM (2021).
- Chan, K. C. et al. Intracameral injection of a chemically cross-linked hydrogel to study chronic neurodegeneration in glaucoma. Acta Biomater 94, 219-231, doi:10.1016/j.actbio.2019.06.005 (2019).
- Munting, L. P. et al. Cerebral blood flow and cerebrovascular reactivity are preserved in a mouse model of cerebral microvascular amyloidosis. Elife 10, doi:10.7554/eLife.61279 (2021).
- Munting, L. P. et al. Influence of different isoflurane anesthesia protocols on murine cerebral hemodynamics measured with pseudo-continuous arterial spin labeling. NMR Biomed 32, e4105, doi:10.1002/nbm.4105 (2019).
- Turchi, J. et al. The Basal Forebrain Regulates Global Resting-State fMRI Fluctuations. Neuron 97, 940-952 e944, doi:10.1016/j.neuron.2018.01.032 (2018).
Figures

Elevated intraocular pressure (IOP) was confirmed
in the glaucoma mouse model. (A) Intracameral injection of a chemically cross-linked hydrogel is used to
obstruct the aqueous outflow and elevate IOP. Controls were untreated. (B) IOP was measured 2-3 times per week
for 3 weeks, followed by resting-state fMRI (rsfMRI) and optomotor response
(OMR) experiments. (C) The injected (right)
eye has significantly higher IOP compared to the left eye and both eyes of
control. Two-way ANOVA followed by Bonferroni’s post-hoc test was applied (***p<0.001).
(VS: vinyl sulfone; SH: thiol)

Elevated IOP in the right eye induced rCVR to
decrease in the left visual cortex (VC) and increase in the right basal
forebrain (BF). (A) rCVR decreased in the
left VC, and increased in the right BF for hydrogel (Hyd)-induced glaucoma
model. No change was observed in somatosensory cortex (SS). (B) rCVR in the left VC is inversely
correlated with the right BF. (C)
IOP of the injected (right) eye is inversely correlated with rCVR in the left
VC, while positively correlated with rCVR in the right BF. Unpaired t-test (**p<0.01,
***p<0.001) and linear regression were applied. (r.u.: relative unit)

Elevated IOP impaired optomotor responses (OMR).
(A) OMR experiments revealed a decrease in visual
acuity (cycles/degree) and an increase in visual contrast threshold (%) for
glaucoma model, indicating visual impairment. (B) Such visual impairments were coupled with IOP. (C) Only visual acuity was
significantly correlated with rCVR in the right BF. Two-way ANOVA followed by Bonferroni’s
post-hoc test (**p<0.01, ***p<0.001) and linear regression were applied.

Unilateral IOP elevation increased the global
signal, and decreased bilateral VC and BF functional connectivity (fc). (A) Power
spectra of the whole-brain and right BF was higher in the glaucoma model at the
lower and higher frequency ranges, respectively. (B) Bilateral VC and BF fc were reduced in the glaucoma model. (C) Bilateral VC fc was positively
correlated with the left VC rCVR and negatively correlated with right BF rCVR. Two-way
ANOVA followed by Bonferroni’s post-hoc test (**p<0.01, ***p<0.001), unpaired
t-test (*p<0.05, ***p<0.001) and linear regression were applied.

Unilateral IOP elevation induced rCVR to
decrease across all left VC sub-regions, and increase in right BF diagonal band
of Broca (DB). (A) rCVR in the left
monocular region of the primary VC (V1M), left binocular region of the primary VC
(V1B) and left secondary VC (V2) were all significantly lower in the hydrogel-induced
glaucoma model (Hyd) relative to control (Cnt). (B) Only right DB rCVR was significantly higher in the glaucoma
model, not the bilateral substantia innominata (SI), left DB, or
bilateral medial septum (MS). Unpaired t-test (*p<0.05, **p<0.01, ***p<0.001)
was applied.
DOI: https://doi.org/10.58530/2022/1753