1751
Plaque to Myocardium Ratio in T1-weighted Magnetic Resonance Imaging: Analysis of Variabilities and Method for Standardization1Biomedical Imaging Research Institute, Cedars-Sinai Medical Center, Los Angeles, CA, United States, 2Cedars-Sinai Medical Center, Los Angeles, CA, United States, 3Department of Bioengineering, University of California, Los Angeles, Los Angeles, CA, United States
Synopsis
Plaque to Myocardium Ratio (PMR) based on T1-weighted MRI is an important quantitative biomarker to classify high-risk coronary plaque. However, it is calculated based on relative signal intensities, therefore, sensitive to variations in physiological and acquisition conditions. In this work, Bloch simulations were performed to explore the impact of heart rate, echo spacing, flip angle, and the number of readout segments on PMR. A computational model was further proposed to effectively reduce the acquisition-related PMR variations demonstrated in simulations and in vivo studies. The proposed method may potentially improve the precision of PMR and facilitate its comparison in longitudinal studies.
Introduction
High-risk coronary plaque characterization is crucial for the early diagnosis and treatment of coronary heart disease. T1-weighted (T1w) MRI is a promising noninvasive technique for the assessment of coronary plaque tissue properties. Previous studies have shown that Plaque to Myocardium Ratio (PMR), as calculated by normalizing plaque signal intensity by healthy myocardium signal intensity, is an important imaging biomarker for determining plaque compositions1, predicting future coronary events2, and evaluating therapeutic effects3. However, as a measurement based on the ratio of relative signal intensities, PMR can be sensitive to variations in physiological and acquisition conditions. In this work, Bloch simulations were performed to explore the impact of variations in heart rate, flip angle, and the number of readout segments on PMR. Further, a computational modeling method was proposed to calibrate PMR to standardized conditions in phantom and in vivo studies.Methods
Bloch equation simulationsThe sequence for T1w MRI for coronary plaque imaging contrast is based on inversion recovery prepared spoiled gradient-echo readout (IR-FLASH). A Bloch equation simulation of the sequence was implemented on MatLab 2016b (MathWorks, Natick, MA). Three parameters were included as variables for this simulation to evaluate their respective impact on the PMR measurements: 1) heart rate variations (HR) between 40 to 100 beats/min; 2) the number of readout segments (SEG) between 20 to 50, and 3) readout flip angle (FA) between 10° to 20°. Three targeted tissue types were included in the simulations with corresponding literature T1 values at 3T (blood of 1650 ms; myocardium of 1229 ms, and plaque with various T1 ranging from 500 ms to 1700ms)4,5.
Computational modeling and application for PMR calibration
A computational model based on Bloch equation was derived to convert PMR measured at any combination of sequence parameters and physiological condition to a predefined standardized condition in a process as illustrated in Figure 1A. The algorithm was implemented in Python, and a standalone application was developed for post hoc PMR conversions.
Phantom and in vivo studies
A T1 phantom was constructed with various concentrations of nickel chloride according to expected plaque T1 values in vivo (range from 367.46 ms to 1767.5 ms). The phantom was placed between the legs of a healthy volunteer to allow the use of calf muscle to mimic a myocardium reference (Figure 1B). All T1 values are determined by fitting from a series of images acquired using inversion recovery single-echo spin-echo sequences with different inversion times (Figure 1C). A total of 34 scans were acquired under various conditions, including: 1) HR variations from 45 to 75 beats/min; 2) FA variations from 10° to 20°; and 3) SEG from 30 to 50. For each scan, only one variable was modified, with other variables kept the same as the standard condition. Inversion time was set to 600 ms6,7. PMR was measured by dividing the mean intensity of ROI in each tube with the mean intensity of adjacent calf muscle reference. The measured PMR was then calibrated with the proposed numerical model. Pearson’s correlation and Bland-Altman analyses were used for comparing uncalibrated and calibrated PMR with the standard PMR.
Results
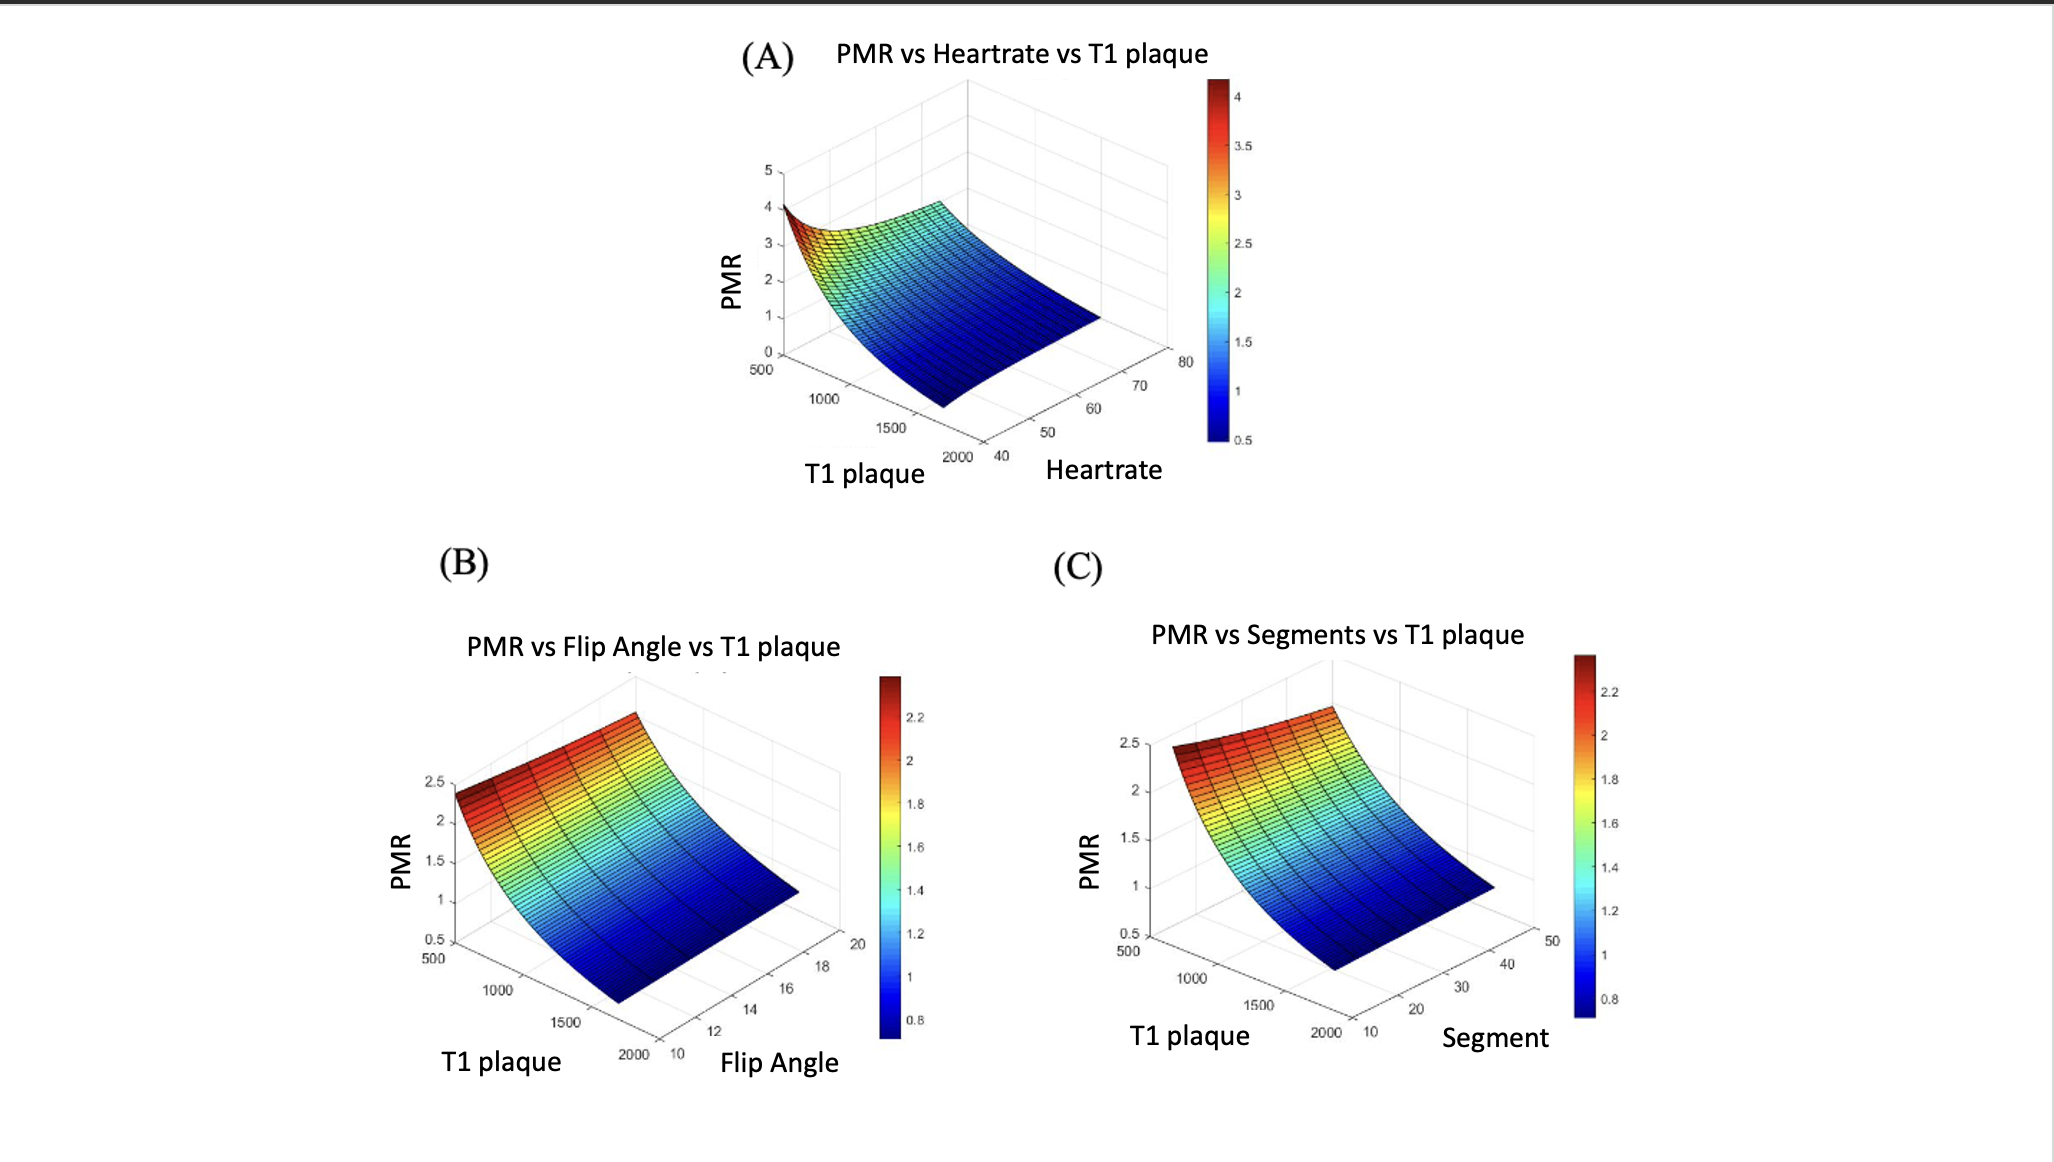
Figure 2 shows the variations of PMR depending on different plaque T1, HR, FA, and SEG combinations. The relationships were nonlinear but monotonal. All three scan condition variables (HR, FA, and SEG) inversely affected PMR at any given T1, with HR variations having a more substantial impact than the sequence parameters.Figure 3 shows the Pearson’s correlation analyses comparing calibrated and uncalibrated PMR measurements using the standard PMR measurements as the reference. Significant positive correlations were observed in all cases (all r>0.9). Calibrated PMR measurements resulted in higher correlation coefficients than the uncalibrated ones.
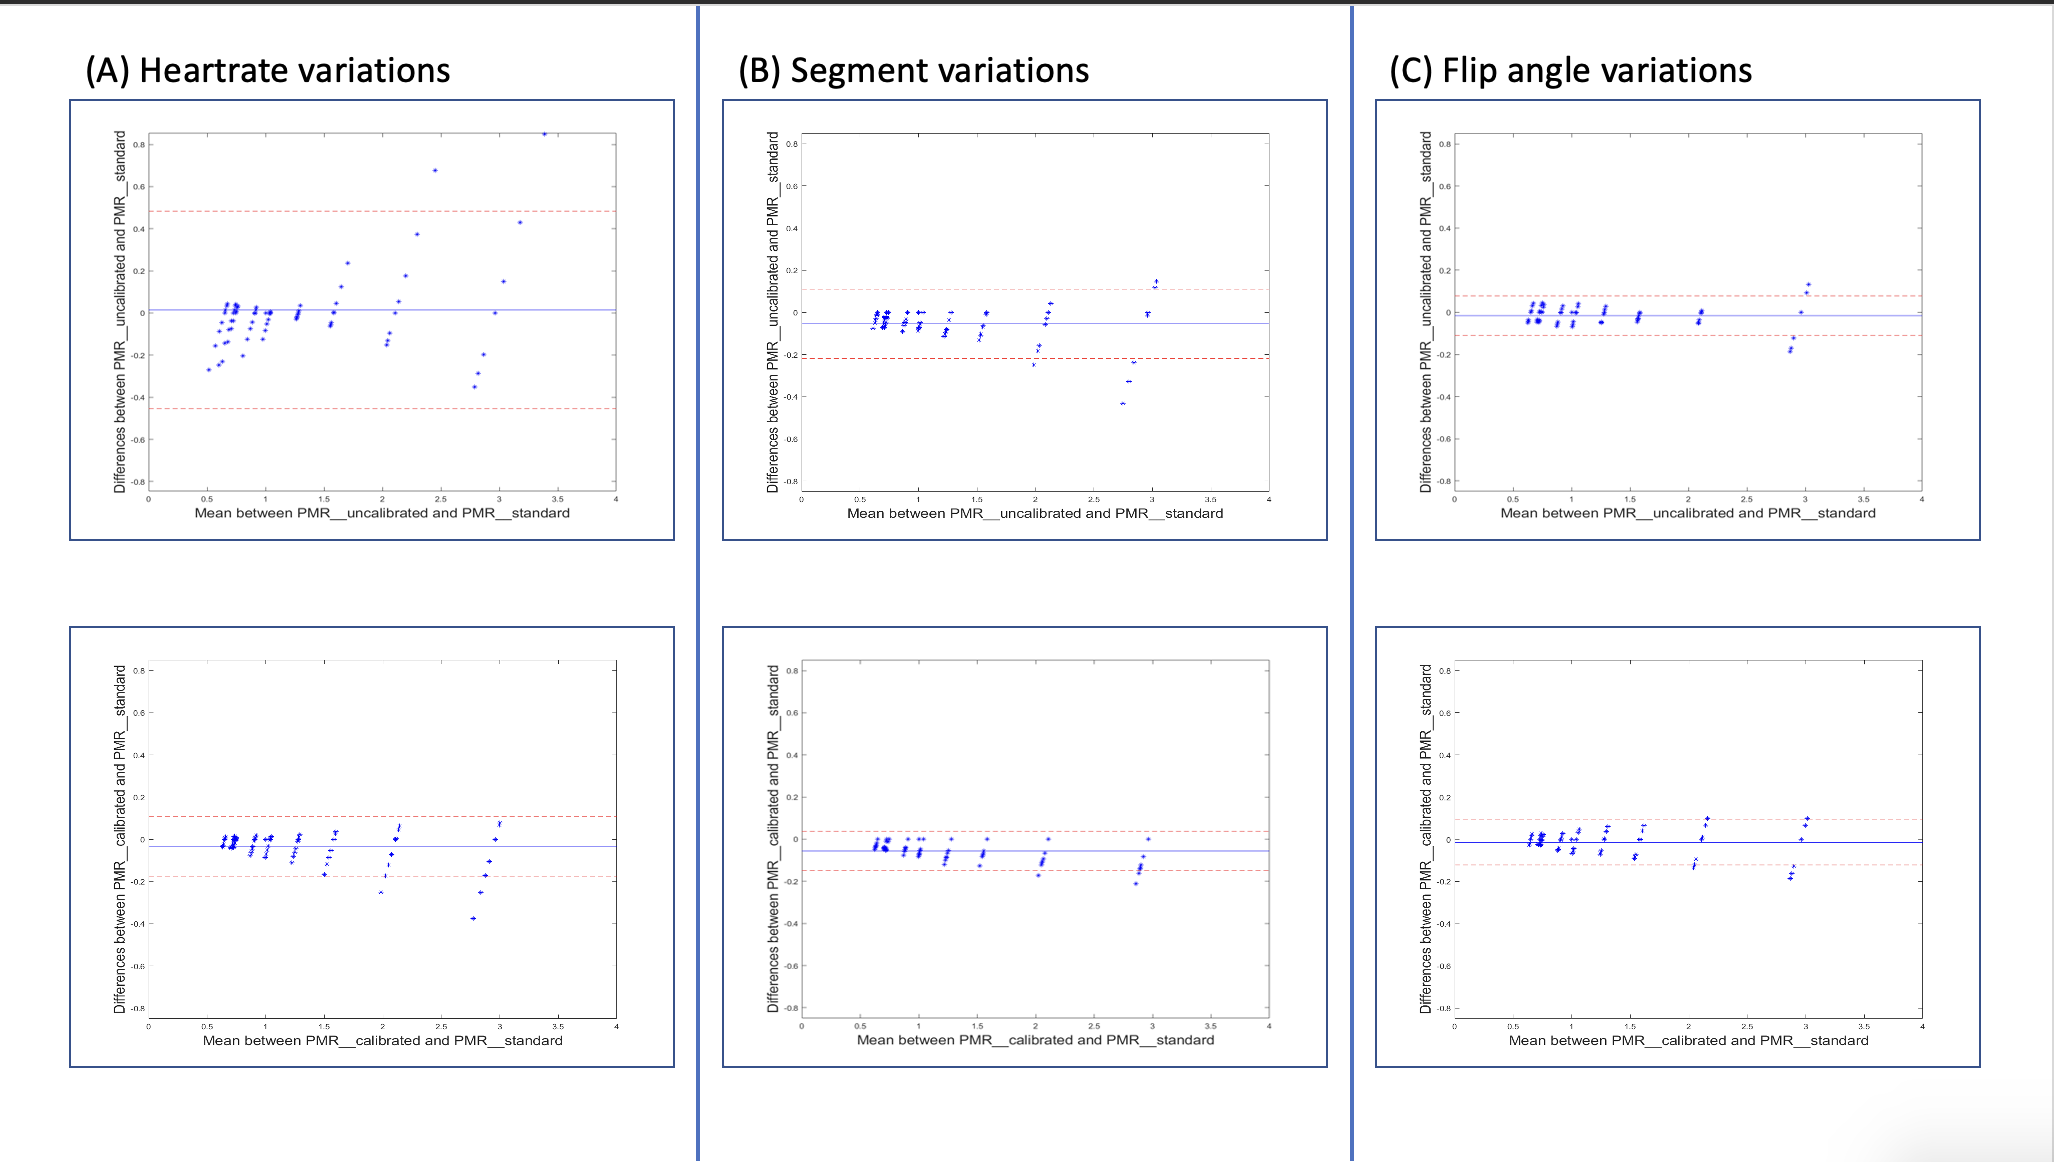
Figure 4 shows the Bland-Altman analyses comparing calibrated and uncalibrated PMR measurements using the standard PMR measurements as the reference. Limits of agreement were substantially reduced by the calibration in HR and SEG variations.
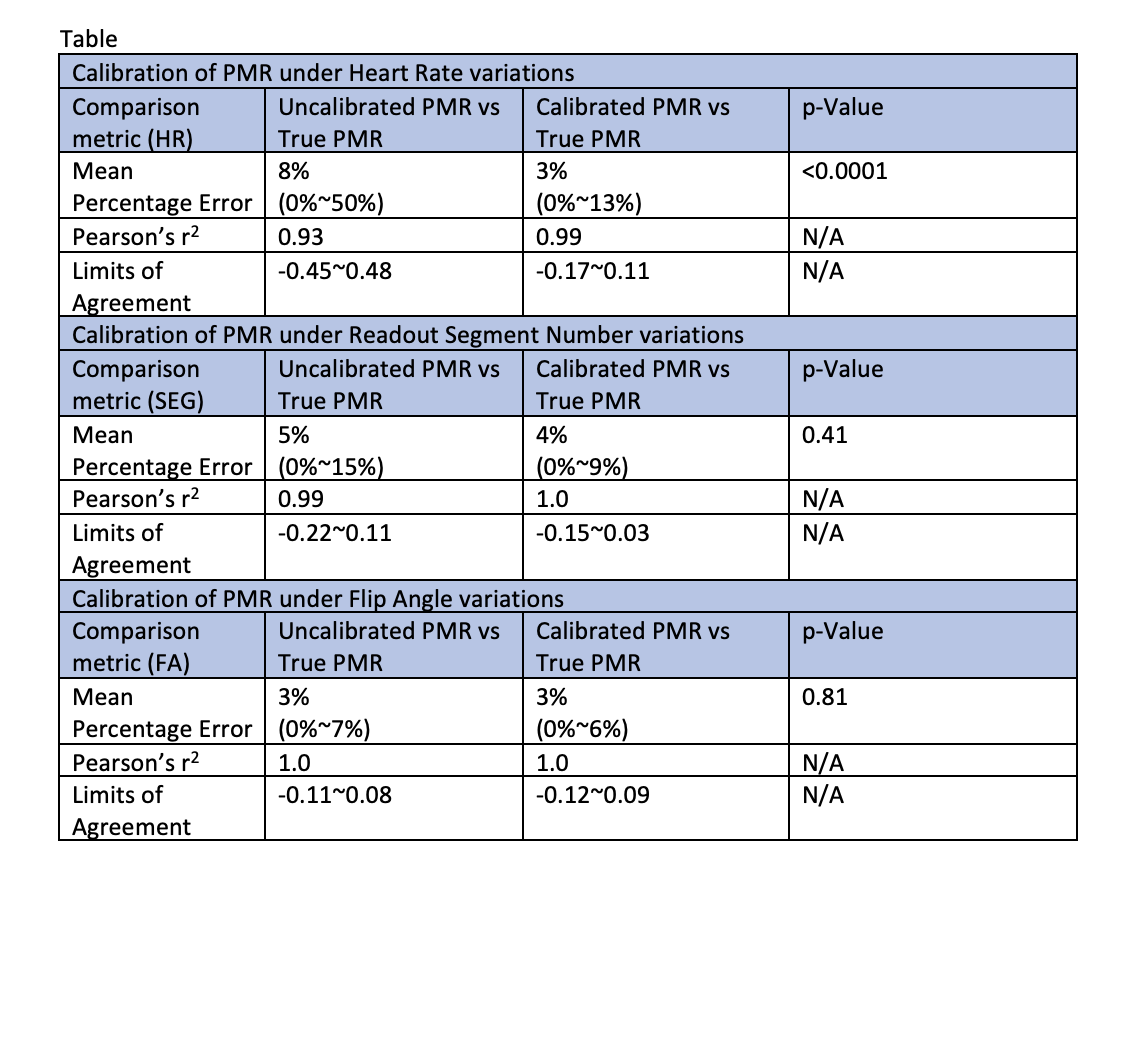
Table 1 summarizes the statistical results comparing calibrated and uncalibrated PMR measurements against the reference. Notably, the mean percentage error (MPE) was significantly reduced by the calibration in HR variations.
Discussion
Overall, better correlations, higher agreements, and lower errors were observed in the calibrated PMR measurements compared with the uncalibrated ones against the standard references. Among the three evaluated scan variables, HR has the most significant impact on PMR. Coil sensitivity variation was an important confounding factor that necessitated normalization (unpublished data). The impact of cardiac and respiratory motion associated with coronary plaque MRI was not considered in this study which should be explored in future studies.Conclusion
This study demonstrated that PMR measurements in T1w MRI were influenced by multiple physiological and technical factors to different degrees. A computational modeling-based approach was developed to retrospectively calibrate PMR to a predefined standardized condition, which effectively reduced errors in PMR quantification and improved agreement to the reference. The proposed method enabled retrospective calibration of PMR and can potentially facilitate the clinical use of T1w MRI for coronary plaque characterization.Acknowledgements
Society for Cardiovascular Magnetic Resonance for Seed Grant in Basic Sciences.
Dr. Yi Zhang for assisting with the phantom preparation.
References
1. Ehara S, Hasegawa T, Nakata S, et al. Hyperintense plaque identified by magnetic resonance imaging relates to intracoronary thrombus as detected by optical coherence tomography in patients with angina pectoris. European heart journal cardiovascular Imaging 2012; 13(5): 394-9.
2. Noguchi T, Kawasaki T, Tanaka A, et al. High-intensity signals in coronary plaques on noncontrast T1-weighted magnetic resonance imaging as a novel determinant of coronary events. Journal of the American College of Cardiology 2014; 63(10): 989-99.
3. Noguchi T, Tanaka A, Kawasaki T, et al. Effect of Intensive Statin Therapy on Coronary High-Intensity Plaques Detected by Noncontrast T1-Weighted Imaging: The AQUAMARINE Pilot Study. Journal of the American College of Cardiology 2015; 66(3): 245-56.
4. Stanisz GJ, Odrobina EE, Pun J, et al. T1, T2 relaxation and magnetization transfer in tissue at 3T. Magnetic resonance in medicine : official journal of the Society of Magnetic Resonance in Medicine / Society of Magnetic Resonance in Medicine 2005; 54(3): 507-12.
5. Roy C, Slimani A, de Meester C, et al. Age and sex corrected normal reference values of T1, T2 T2* and ECV in healthy subjects at 3T CMR. J Cardiovasc Magn Reson 2017; 19(1): 72.
6. Hosoda H, Asaumi Y, Noguchi T, et al. Three-dimensional assessment of coronary high-intensity plaques with T1-weighted cardiovascular magnetic resonance imaging to predict periprocedural myocardial injury after elective percutaneous coronary intervention. J Cardiovasc Magn Reson 2020; 22(1): 5.
7. Asaumi Y, Noguchi T, Morita Y, et al. High-Intensity Plaques on Noncontrast T1-Weighted Imaging as a Predictor of Periprocedural Myocardial Injury. JACC Cardiovasc Imaging 2015; 8(6): 741-3.
Figures