1750
Evaluation of flow suppression methods for multi-echo gradient echo carotid wall imaging1Robarts Research Institute, Schulich School of Medicine & Dentistry, Western University, London, ON, Canada, 2Siemens Healthcare Canada, Oakville, ON, Canada, 3Medical Biophysics, Schulich School of Medicine & Dentistry, Western University, London, ON, Canada
Synopsis
By adding long TEs to the Dixon acquisition, the chemical-shift-based T2*-weighted multi-echo GRE (CS-T2*-mGRE) techniques have gained attention, because they are able to generate co-registered multi-contrast images and quantitative maps. However, flow-suppressed CS-T2*-mGRE sequences have not been evaluated for carotid wall imaging. We compared the performance of simultaneous quantification of fat fraction (FF) and R2* from CS-T2*-mGRE sequences with and without saturation slabs, and with the incorporation of DANTE pulses for black blood imaging (DANTE-CS-T2*-mGRE); we used the FF for fat-suppression to better visualize the vessel wall from DANTE-CS-T2*-mGRE as well as the carotid artery lumen from CS-T2*-mGRE.
INTRODUCTION
A single multi-echo GRE (mGRE) scan has potential to simultaneously quantify the contents of fat (e.g., proton density fat-fraction (FF)) and calcium/iron (e.g., R2* and the QSM-derived tissue susceptibility (χ)) in carotid-artery plaque, leading it to be highly valuable in the clinic. To study the relationships between FF and R2* inside carotid plaque and circulating lipoproteins, Good et al. acquired mGRE data with in-flow suppression (i.e., two inferior and superior saturation slabs).1 To identify multi-contrast plaque features using FF, R2*/T2* and QSM, Ruetten developed an axial flow-compensated bipolar 3D mGRE protocol,2 while Su et al.3 acquired black-blood T2* maps by combined the mGRE sequence with delay alternating with nutation for tailored excitation (DANTE).4, 5 Only focused on measuring the χ map of the carotid plaque, a few groups have used a fat-water in-phase mGRE protocol without flow compensation.6, 7 In this work, we performed an in vivo study to evaluate the quality of quantification of FF and R2* from a single mGRE acquisition with different flow suppression methods. Further, we explore the possibility of delineating the carotid vessel wall using the black-blood mGRE sequence, where fat-suppression is achieved using the estimated FF maps.METHODS
Protocol and data acquisition: Two healthy volunteers were scanned on a 3T scanner under a protocol approved by local research Ethics Board.We used a chemical-shift-based T2*-weighted bipolar mGRE (CS-T2*-mGRE) protocol8 with the vendor’s 64-channel head/neck coil: the first five echoes were selected with TEs optimized for fat/water separation (4.3, 6.0, 7.7, 9.5 and 11.2 ms); the late five echoes were acquired with TEs optimized for T2*-weighted/susceptibility mapping (16.8, 23.9, 31.1, 38.2, and 45.4 ms) while keeping fat and water approximately in-phase. Other parameters were: flip angle 25°; TR 51 ms; bandwidth 1015 Hz/pixel; spatial resolution 0.7×0.7×2.0 mm3; 36 slices; GRAPPA = 2. This protocol was performed without/with the use of 80-mm saturation slabs (inferior and superior to the acquisition volume with a 40-mm gap, SA-CS-T2*-mGRE). The total acquisition time was ~ 3 mins and ~4 mins for the CS-T2*-mGRE and SA-CS-T2*-mGRE, respectively.
Also, we combined the CS-T2*-mGRE with the DANTE technique (DANTE-CS-T2*-mGRE) by modifying vendor’s GRE sequence to include DANTE preparation: spatial resolution 1.0×1.0×2.0 mm3 (interpolate to 0.5×0.5×2 mm3), 36 slices. The DANTE parameters were: flip angle 8°; gradient strength 18.0 mT/m; gradient duration 340 us; time delay 500 us; number of pulses 120. The total acquisition time was ~ 6 mins.
For reference, the prototype Star-MATCH sequence9,10 was conducted using the vendor-supplied works-in-progress software package to generate multi-contrast images, including super T1-weighted, grey-blood and T2-weighted black-blood images: 0.83 mm isotropic resolution; total acquisition time ~ 10 mins.
Processing: The detailed data processing steps were described in a previous publication.8 Briefly, we corrected the phase errors associated with the bipolar acquisition, followed by using the unwrapping-based B0 mapping technique (B0-NICE)11 to estimate the FF map from the first five echoes; we performed single exponential fitting over all echoes to calculate the R2* map; we multiplied the T1-weighted images (obtained by averaging the set of magnitude images) by (1-FF) to generate fat-suppressed black-blood magnitude images for delineating the vessel wall.
RESULTS
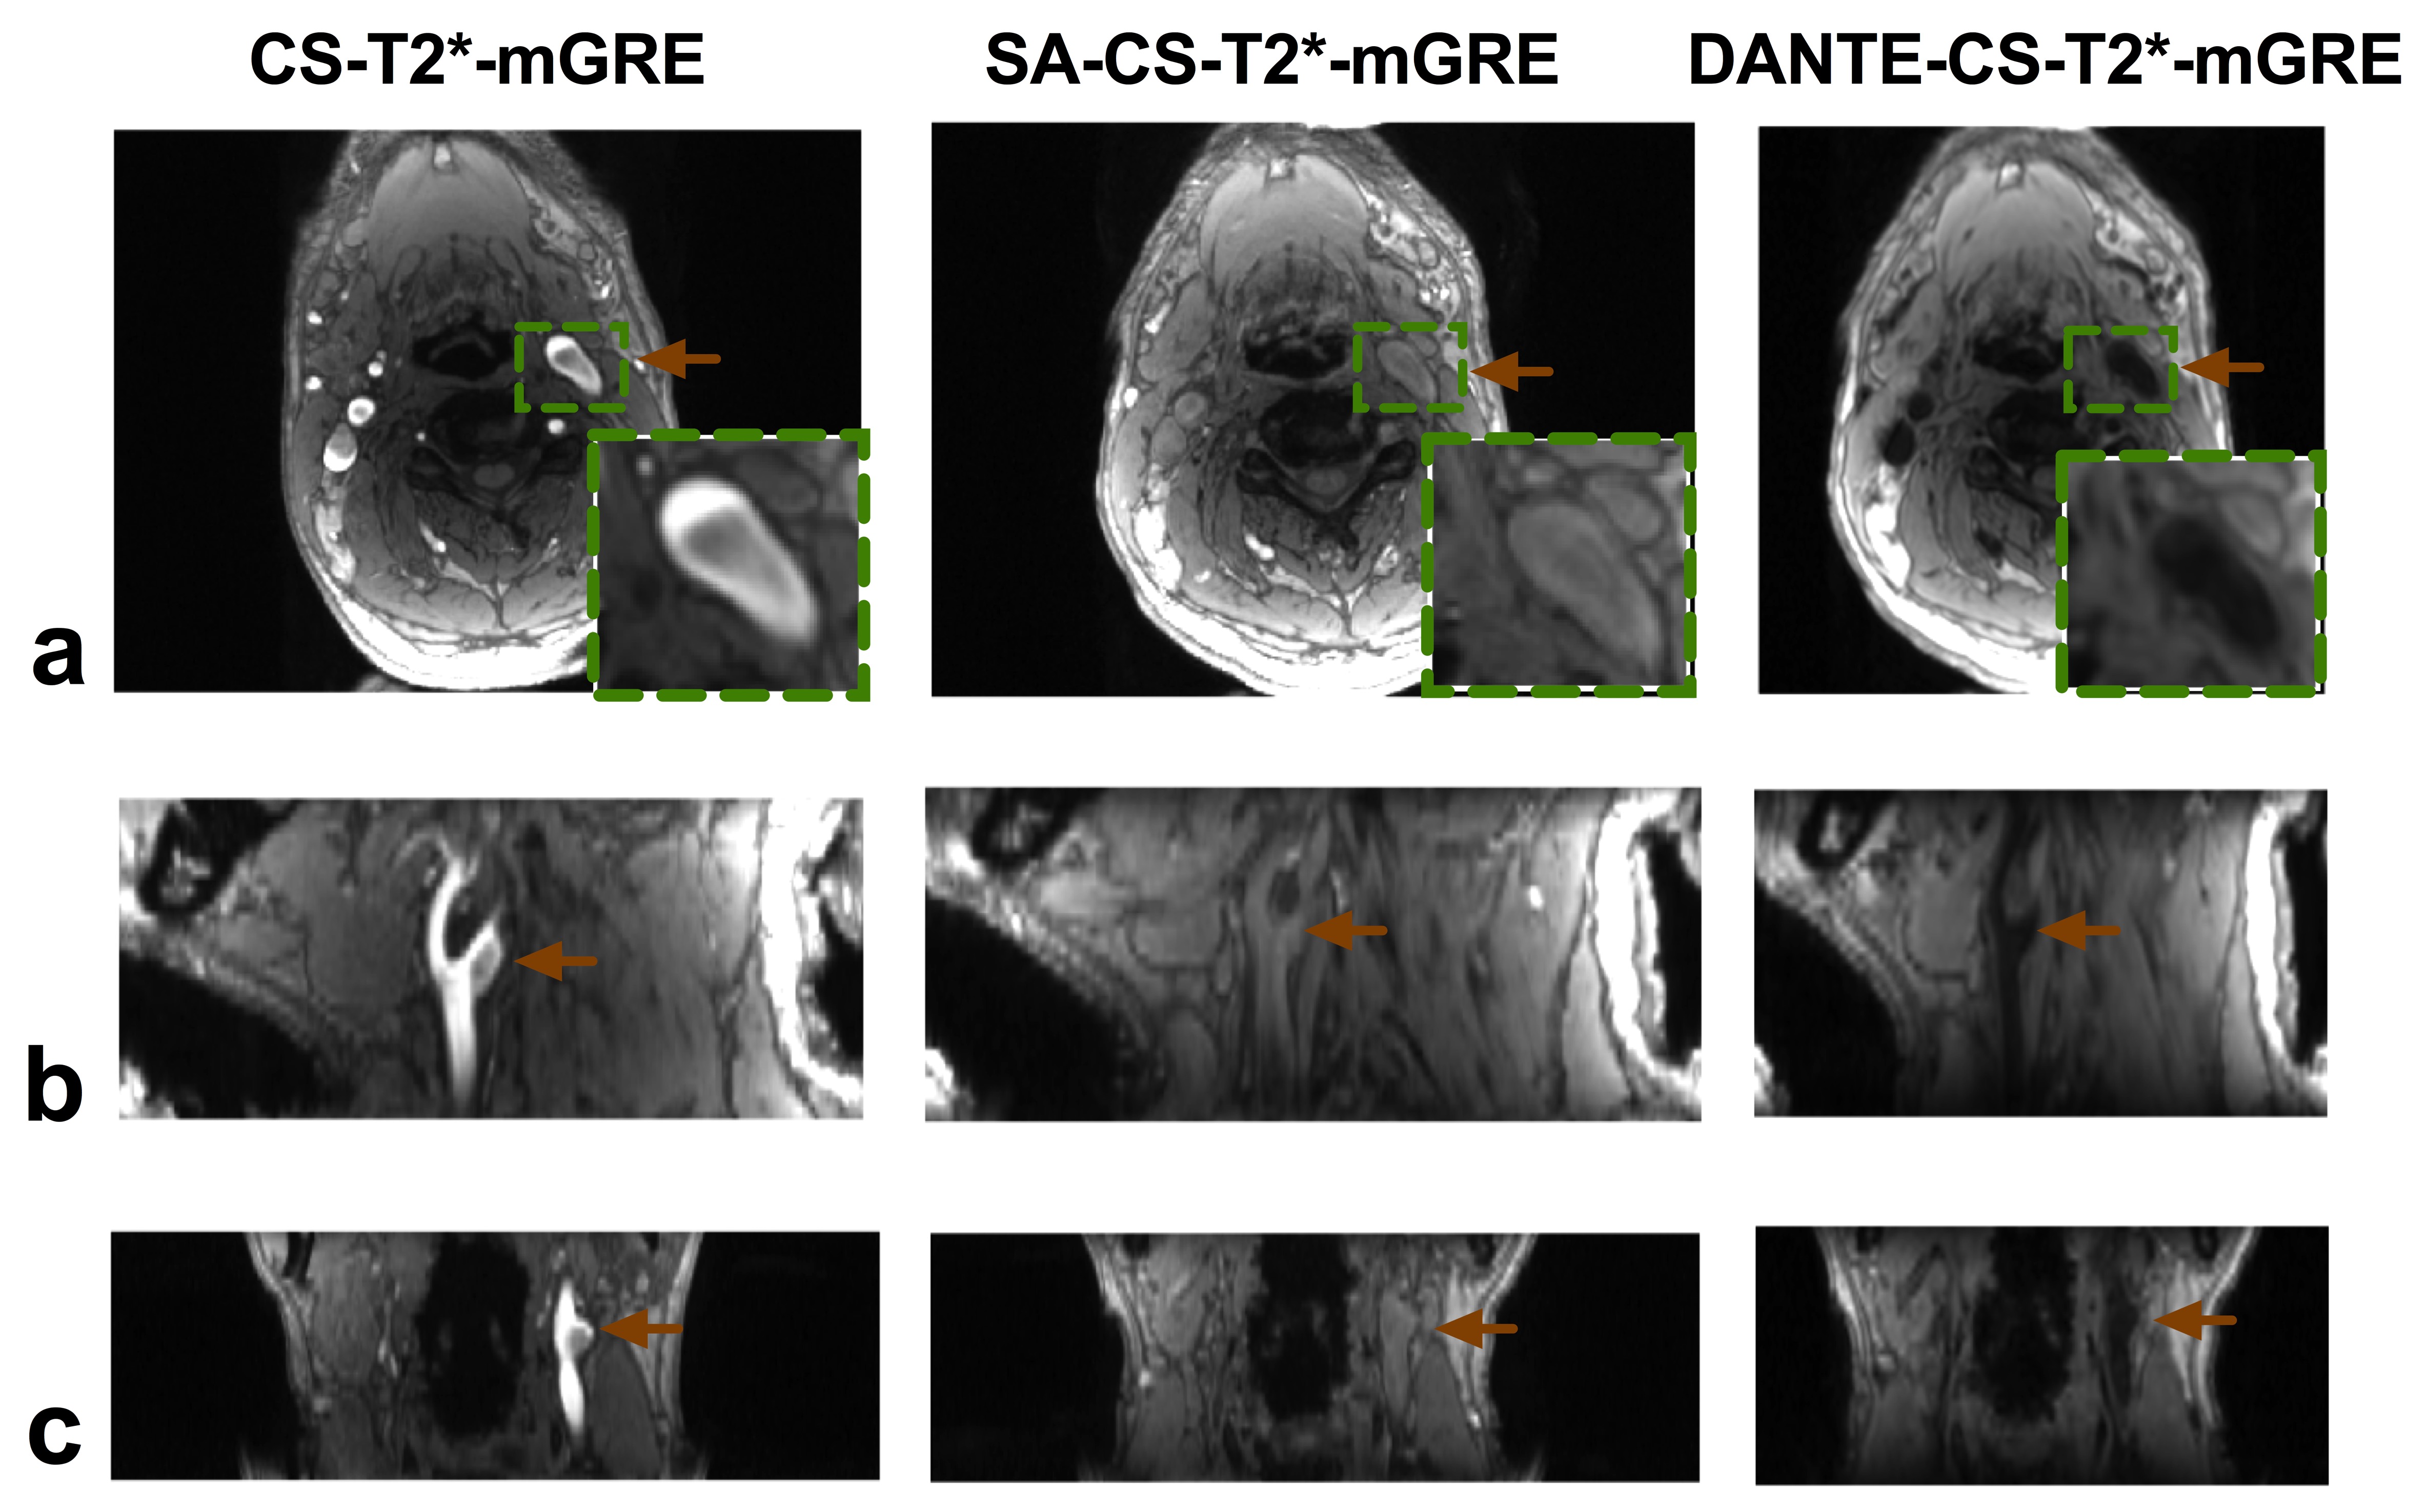
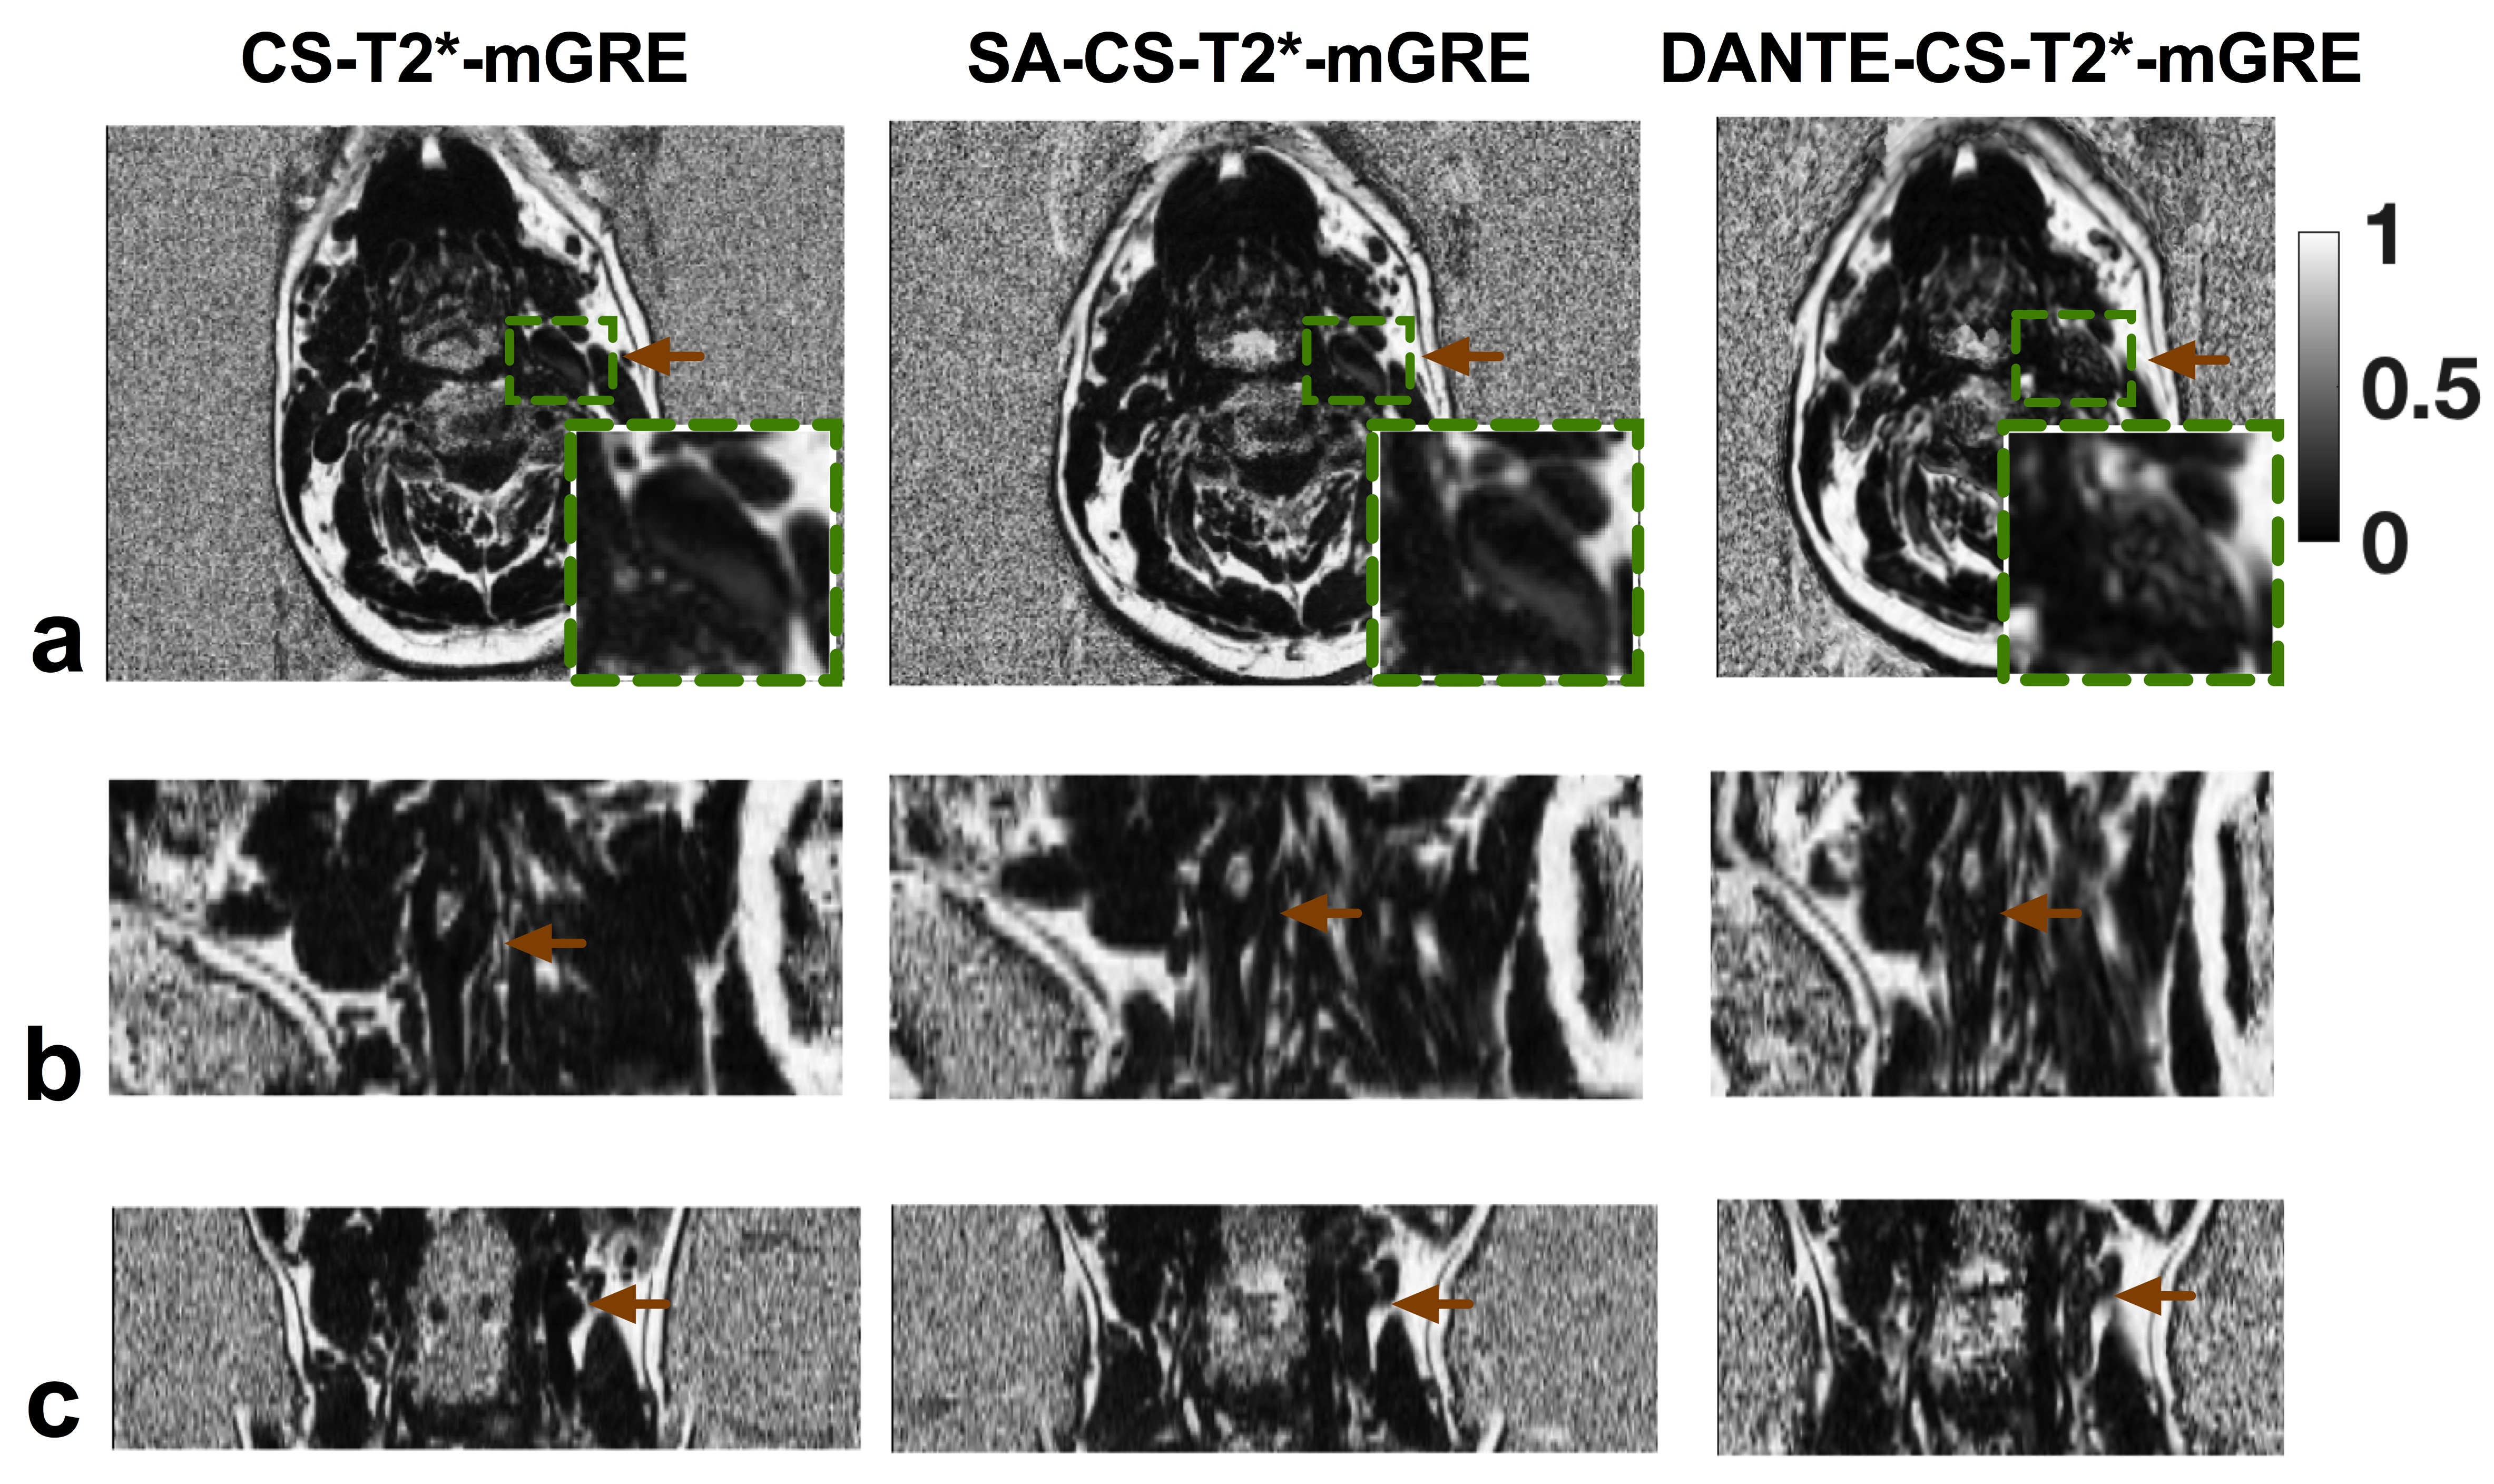
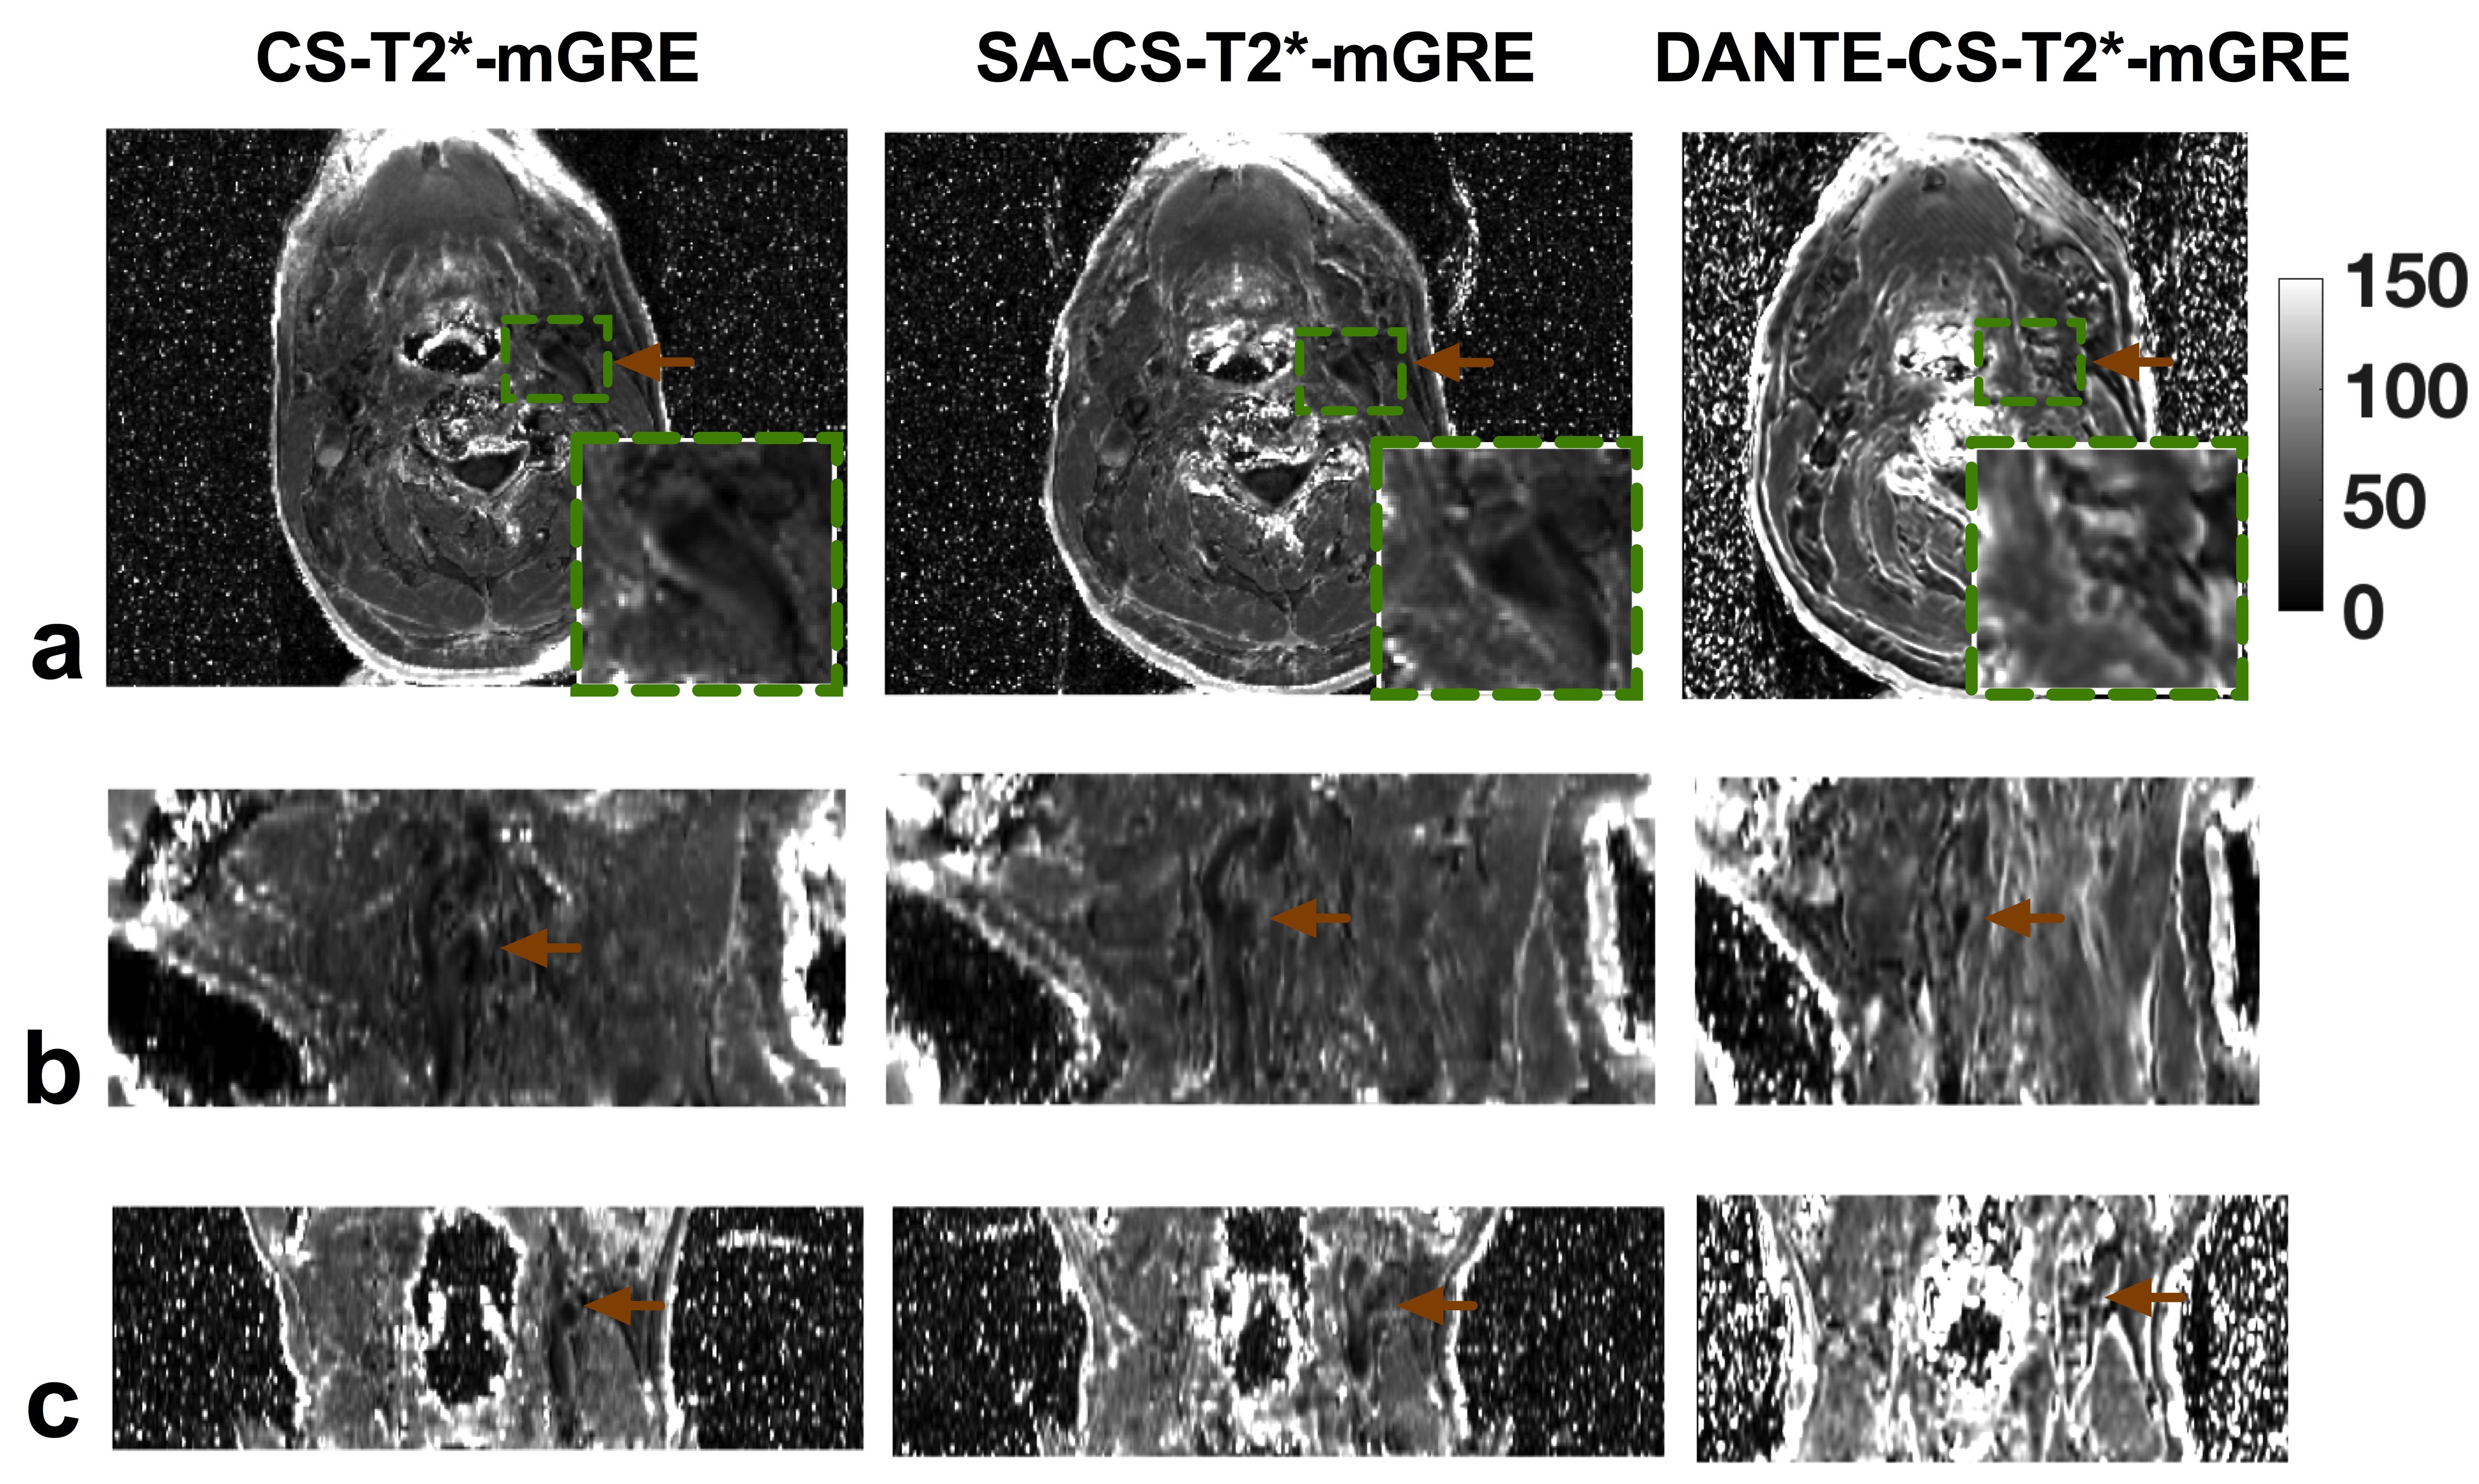
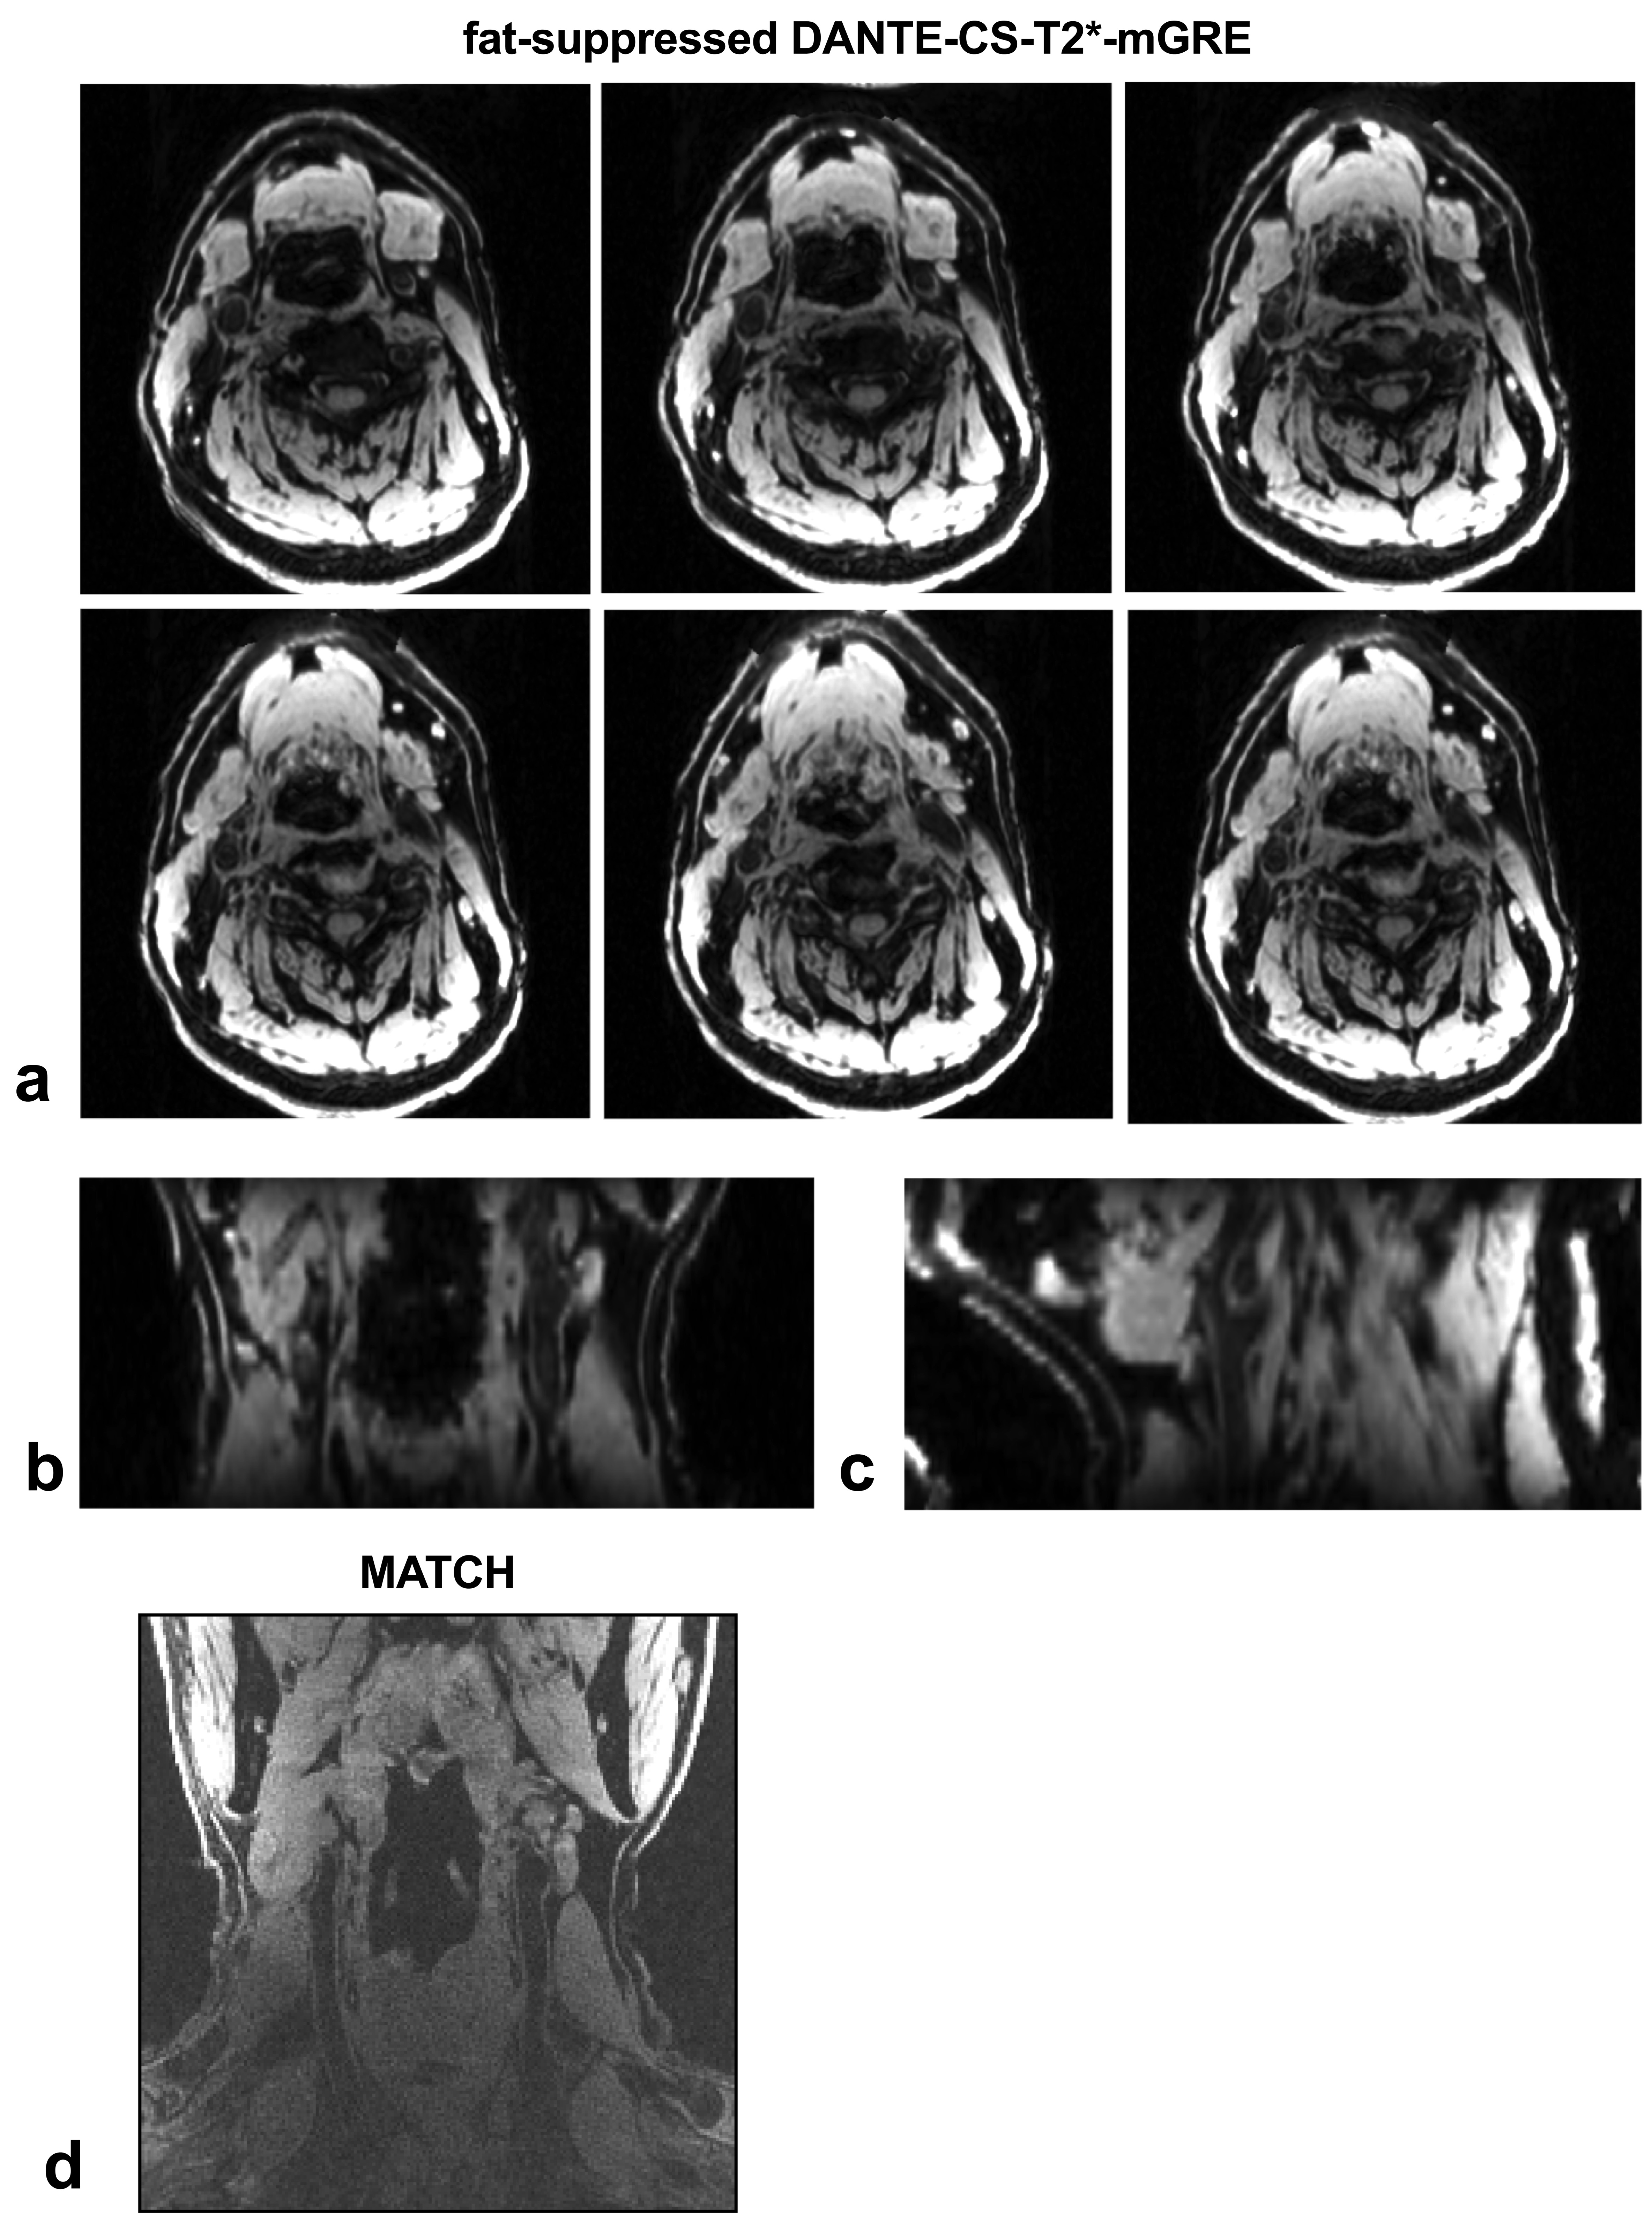
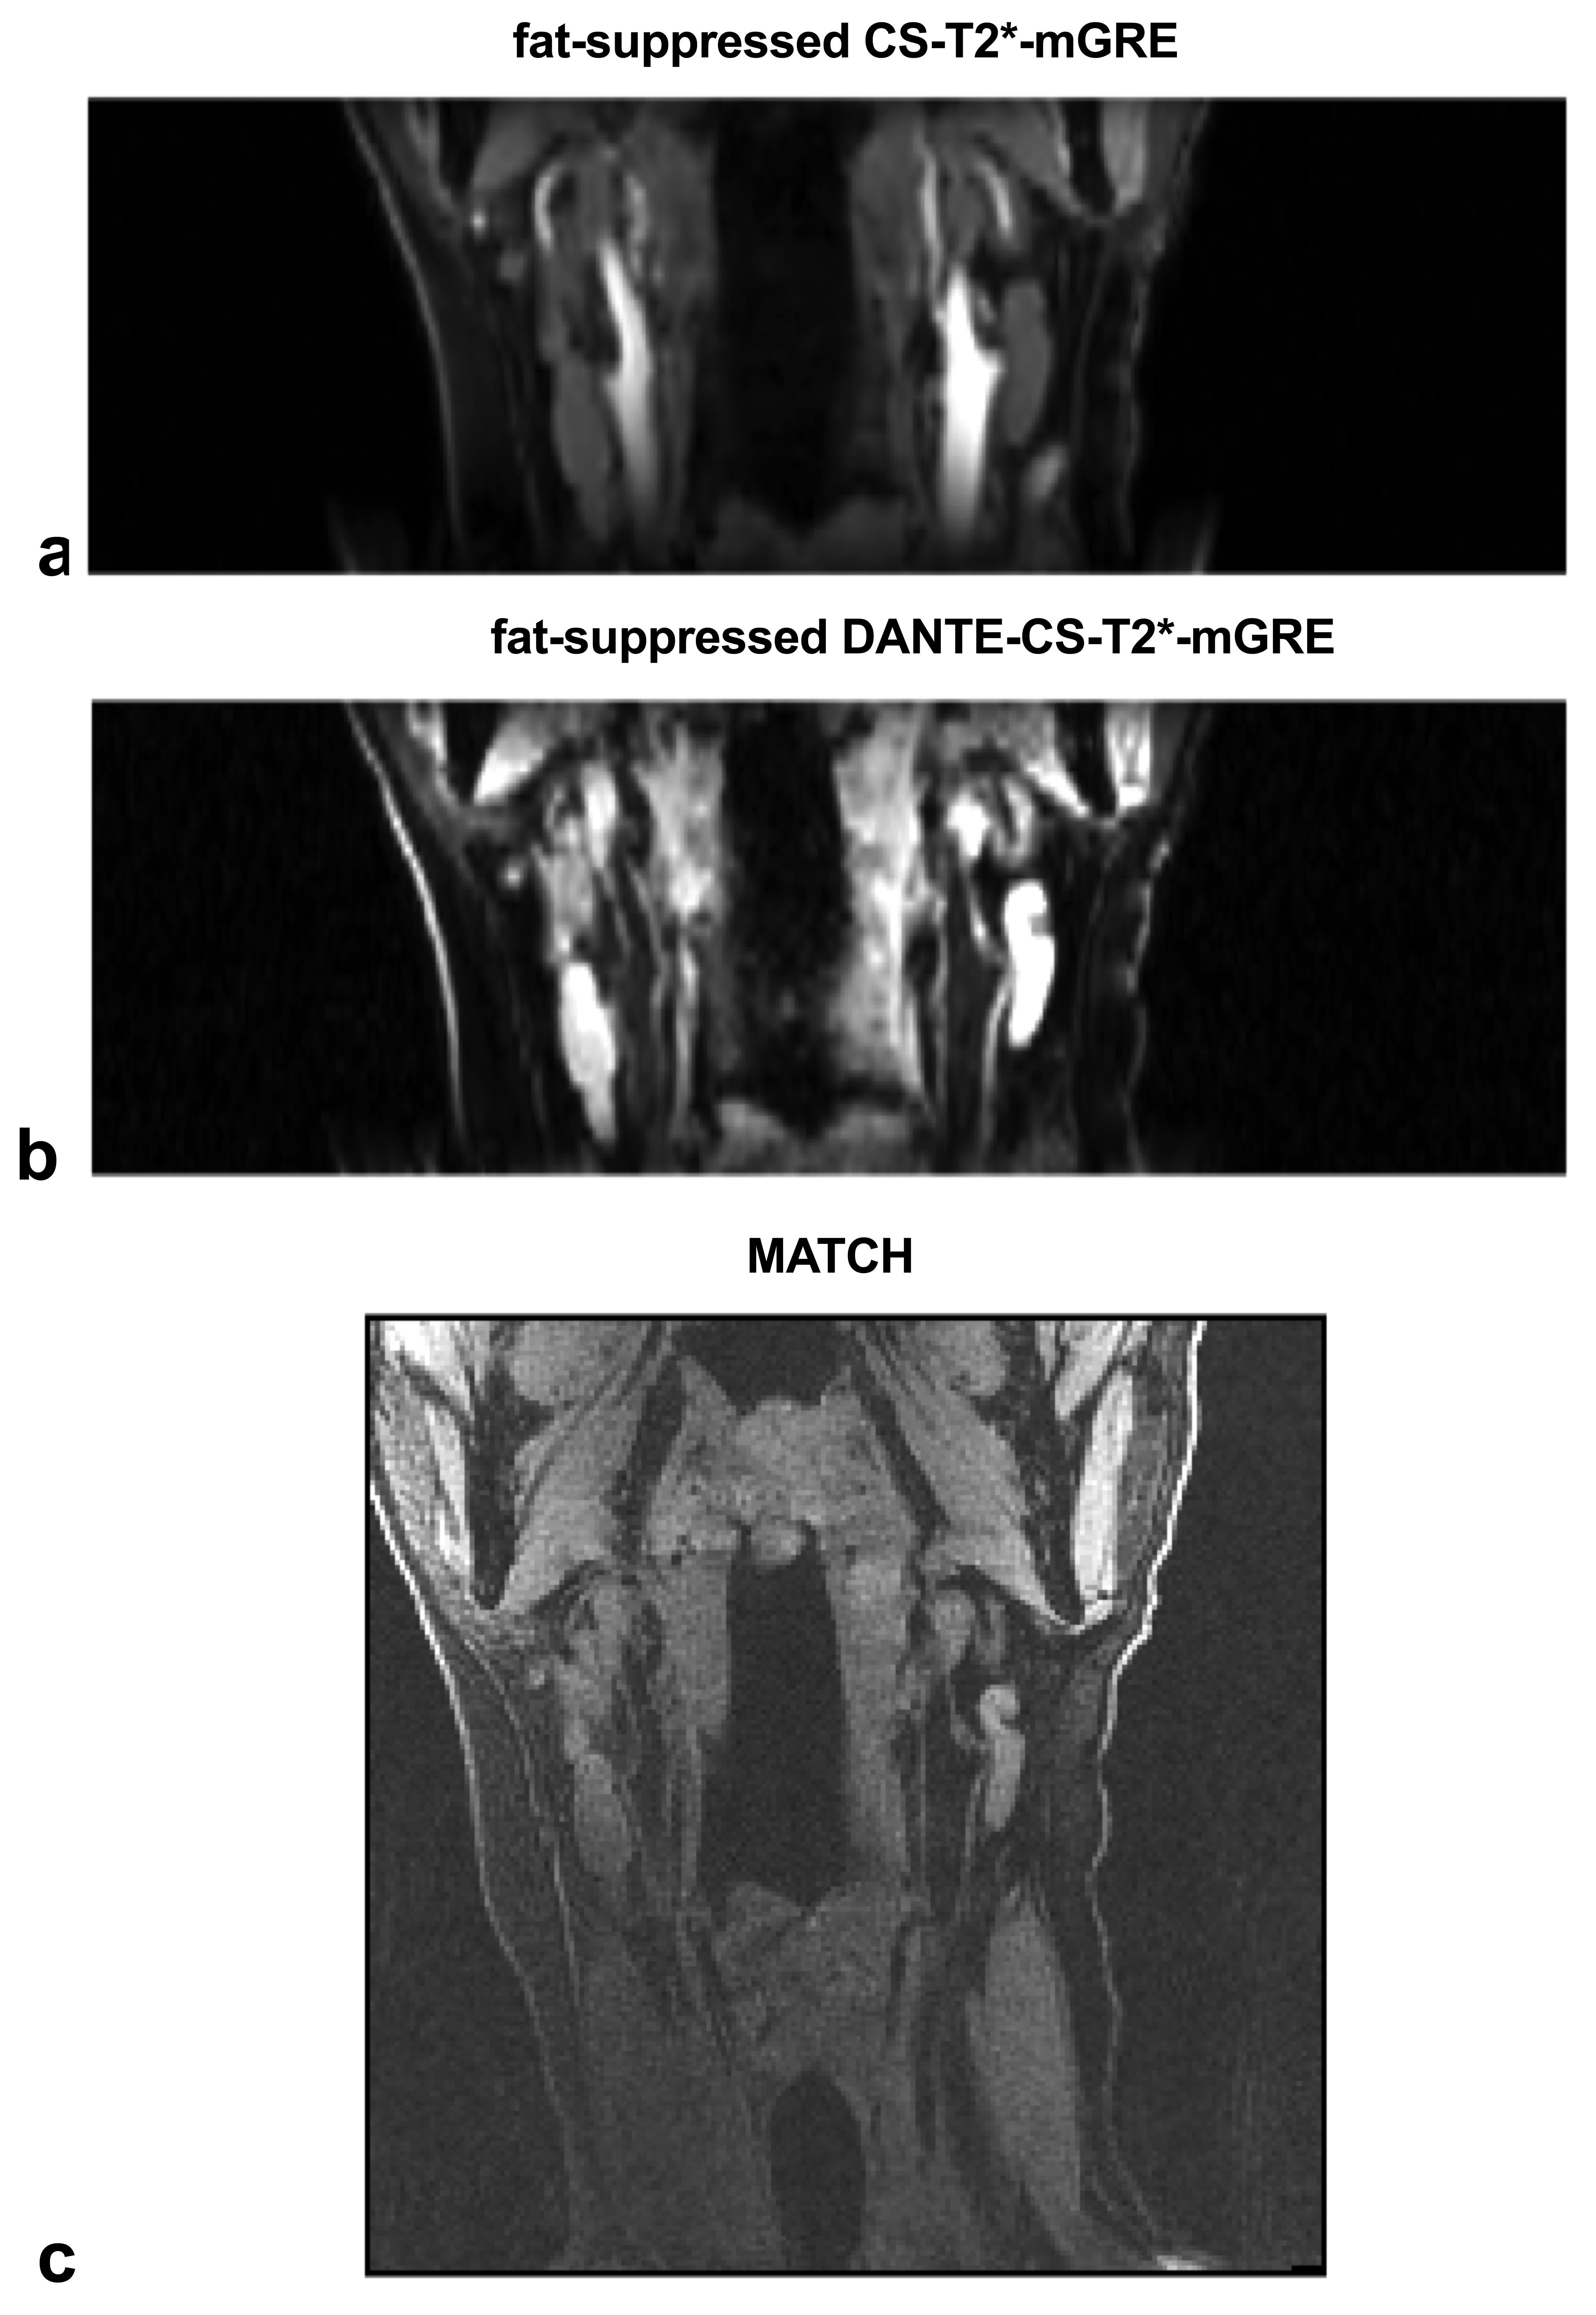
Results from volunteer #1 are presented in Figs. 1-4 for magnitude images, FF estimation, R2* mapping and vessel wall imaging, respectively. Figure 1 shows that applying saturation slabs only partially suppresses in-flow signal, resulting in gray blood contrast. Figure 1 also shows that black-blood images are achieved with the DANTE-CS-T2*-mGRE sequence. Figure 2 demonstrates that fat was successfully quantified for all three mGRE sequences, as indicated by the lack of observed fat-water swaps. The patterns of flow-related artifacts in the carotid bulb are different among the three sequences. Figure 3 shows that the R2* contrast between the carotid artery and the surrounding tissues generated from the DANTE-CS-T2*-mGRE is the lowest, compared to the other two sequences. Figure 4 demonstrates good vessel wall delineation, which is generated using the fat-suppressed DANTE-CS-T2*-mGRE sequence.Results from volunteer #2 are presented in Figure 5. A TOF-like image was generated from the fat-suppressed CS-T2*-mGRE (Fig. 5a), which might be useful when 3D MRA is not available.12 Again, good wall images (Fig. 5b) were obtained.
DISCUSSION
The low contrast in the FF and R2* maps acquired with the DANTE-CS-T2*-mGRE sequence is most likely related to the low SNR caused by the DANTE preparation. We compared the R2* maps generated from the first 5 echoes with that generated from all echoes and found that including the long TEs will improve the quality of the R2* map (data not shown). We didn’t generate QSM maps because the subjects were heath volunteers. Future work with patient data is required.CONCLUSION
The accuracy of measuring FF and R2* values of the carotid artery from a single mGRE scan is dependent on the method used for flow suppression. The DANTE-CS-T2*-mGRE sequence has the potential to generate vessel wall images and simultaneously quantify FF and R2* in carotid artery plaque.Acknowledgements
Funding was provided by a grant from a grant from Canadian Institutes of Health Research. The authors also thank Siemens for providing the prototype Star-MATCH sequence. The Centre for Functional and Metabolic Mapping Internal Funding Program and the Brain Canada Platform Support Grant are also acknowledged.References
1. Good E, Ziegler M, Warntjes M, Dyverfeldt P, de Muinck E. Quantitative Magnetic Resonance Imaging Assessment of the Relationships Between Fat Fraction and R2* Inside Carotid Plaques, and Circulating Lipoproteins. J Magn Reson Imaging 2021.
2. Ruetten PPR, Cluroe AD, Usman A, Priest AN, Gillard JH, Graves MJ. Simultaneous MRI water-fat separation and quantitative susceptibility mapping of carotid artery plaque pre- and post-ultrasmall superparamagnetic iron oxide-uptake. Magn Reson Med 2020;84:686-697.
3. Su S, Ren Y, Shi C, et al. Black-blood T2* mapping with delay alternating with nutation for tailored excitation. Magn Reson Imaging 2017;40:91-97.
4. Li L, Miller KL, Jezzard P. DANTE-prepared pulse trains: a novel approach to motion-sensitized and motion-suppressed quantitative magnetic resonance imaging. Magn Reson Med 2012;68:1423-1438.
5. Li L, Chai JT, Biasiolli L, et al. Black-blood multicontrast imaging of carotid arteries with DANTE-prepared 2D and 3D MR imaging. Radiology 2014;273:560-569.
6. Nguyen TD, Wen Y, Du J, et al. Quantitative susceptibility mapping of carotid plaques using nonlinear total field inversion: Initial experience in patients with significant carotid stenosis. Magn Reson Med 2020;84:1501-1509.
7. Wang C, Zhang Y, Du J, et al. Quantitative Susceptibility Mapping for Characterization of Intraplaque Hemorrhage and Calcification in Carotid Atherosclerotic Disease. J Magn Reson Imaging 2020;52:534-541.
8. Liu J, Christiansen SD, Drangova M. Single multi-echo GRE acquisition with short and long echo spacing for simultaneous quantitative mapping of fat fraction, B0 inhomogeneity, and susceptibility. Neuroimage 2018;172:703-717.
9. Fan Z, Yu W, Xie Y, et al. Multi-contrast atherosclerosis characterization (MATCH) of carotid plaque with a single 5-min scan: technical development and clinical feasibility. J Cardiovasc Magn Reson 2014;16:53.
10. Bi X, Fan Z, Natsuaki Y, Li D, and Laub G. 3D Carotid Wall Imaging: Stack-of-stars Trajectory for Multi-contrast Atherosclerosis Characterization (STAR-MATCH). Proceedings of the International Society of Magnetic Resonance in Medicine’s 24th Scientific Meeting. Singapore. May 7-13, 2016: 962.
11. Liu J, Drangova M. Method for B0 off-resonance mapping by non-iterative correction of phase-errors (B0-NICE). Magn Reson Med 2015;74:1177-1188.
12. Lanzman BA, Huang Y, Lee EH, et al. Simultaneous time of flight-MRA and T2* imaging for cerebrovascular MRI. Neuroradiology 2021;63:243-251.
Figures