1749
High-Field Magnetic Resonance Microscopy of Aortic Plaques in a Mouse Model1Huck Institutes of The Life Sciences, The Pennsylvania State University, State College, PA, United States, 2Department of Nutritional Sciences, The Pennsylvania State University, State College, PA, United States, 3Research Institute for Medicines (iMed.ULisboa), Universidade de Lisboa, Portugal, Lisboa, Portugal, 4Department of Pharmaceutical Sciences and Medicines, Universidade de Lisboa, Portugal, Lisboa, Portugal, 5Department of Biomedical Engineering, The Pennsylvania State University, State College, PA, United States
Synopsis
Currently, histological methods of plaque analysis in aortas from murine models of atherosclerosis do not allow for a holistic view of the vascular lesions. Using high-field MRI, plaque volume in Apoe-/- mice can be analyzed, and when compared to traditional histology, has a higher throughput and is non-destructive. Using a 3D gradient echo sequence at 14 tesla, high-resolution images of the aortas were achieved. The images were segmented and quantified providing a 3-dimensional view of plaque distribution and volume. Overall, using a high-field MRI system allowed for a detailed and complete view of vascular components.
Introduction
Atherosclerosis is the main contributor for elevated risk of cardiovascular disease, which is the leading cause of death globally. This initially asymptomatic condition can lead to a variety of health issues, related to the narrowing of arteries due to endothelial dysfunction and plaque buildup1,2. The traditional method of imaging atherosclerotic plaques in mice is histology. However, this technique is destructive to the sample, labor-intensive, and is limited to two-dimensional analysis. Magnetic Resonance Imaging (MRI), on the other hand, is non-destructive, offers the ability to digitally section the sample at any location in a trivial amount of time and effort, and is amenable to 3-dimensional analysis.Methods
Apoe-/- mice, which lack the apolipoprotein E, develop plaque in their arteries in a similar manner to humans. This process can be accelerated by feeding a high-fat and high-cholesterol diet3–5. Seven-week-old Apoe-/- mice (Jackson Laboratory, Bar Harbor, ME) were placed on either a control diet or a high-fat diet for 12 weeks. After 12 weeks the mice were euthanized, and the thoracic aorta and its 3 main branches (i.e., brachiocephalic, carotid, and subclavian arteries), were harvested, fixed, and placed in a solution containing 0.1% Magnevist (Bayer AG. 51368 Leverkusen, Germany). Imaging was performed with a high-field MRI (14 tesla) system. Resolutions as high as 20x20x20 microns were achieved. After imaging, the datasets were digitally reconstructed and segmented for analysis. The aortas were sectioned and subjected to histological analysis for comparison.Results
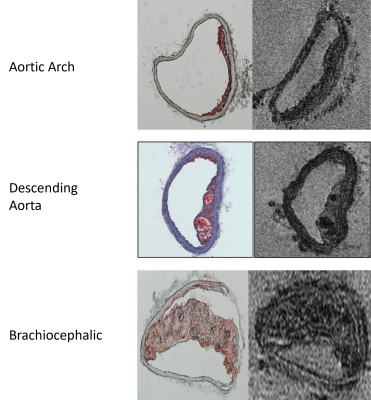
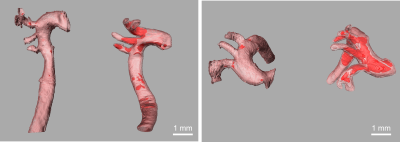
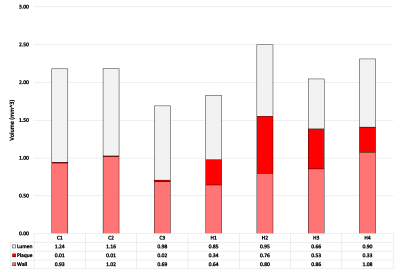
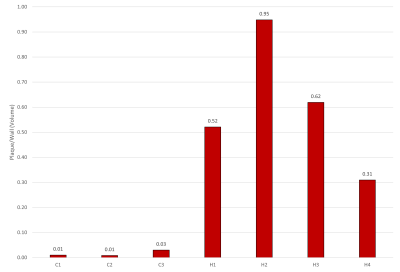
Representative MR microscopy images of the control-diet group and the high-fat-diet group are shown in Figure 1. Stained cryosections of the aorta were compared with images from the MRI dataset. Various features, such as plaque and vessel morphology, were used to identify similar locations for juxtaposition. Figure 2 shows some of these comparisons. After the MRI dataset was reconstructed and segmented, a surface view was created to visualize the plaques macroscopically. Representative images of the entire thoracic aorta for a control-diet specimen and a high-fat-diet specimen are shown in Figure 3. Quantification of the segmented lumens, plaques, and walls is shown in Figure 4 and Figure 5.Discussion
MR microscopy revealed larger, and more numerous, plaques in the high-fat-diet group than in the control-diet group. When compared to histology, the MR images appear to have a sufficient resolution — providing an equivalent degree of detail regarding the morphology of the plaque and of the vessel wall. Indeed, the MR images give a more accurate representation of the in-situ morphology in cases where cryo-sectioning resulted in a disruption of the plaque from the vessel wall (see bottom of Fig.2). The contrast was sufficient to identify the same plaques and intraplaque lipids as tissue-staining.Digital image segmentation of the lumen, plaque, and wall of the blood vessels was performed and offered 3-dimensional visualizations of the entire intact aortas. The segmentations can be viewed from any angle and showed that, in the high-fat-diet group, the plaques were larger in all regions. The apparent differences were confirmed with a quantitative analysis (plaque volume controls: 0.013 ± 0.0066 mm^3; plaque volume of high fat: 0.41 ± 0.25 mm^3).
Limitations
Although the contrast was sufficient to identify several intraplaque components, it was not generally sufficient to determine all types of intraplaque components. Future work could involve adjusting the contrast (e.g., T2* weighting) to artificially “stain” certain components of the plaque. Reconstruction and visualization of the MRI datasets requires a trivial amount of time and effort. However, segmentation of the vessel is required to get accurate quantitative data; and this remains a labor-intensive procedure. Automated segmentation algorithms have been proposed in previous research with atherosclerotic plaques6. This would not only decrease throughput time but would also obviate inter-observer variability in the segmentation process.Conclusion
A 3D gradient echo sequence in a 14 tesla MRI system (600 MHz) allowed for the imaging of an entire thoracic aorta and its three main branches: the brachiocephalic artery, the carotid artery, and the subclavian artery. The imaging procedure was applied to an atherosclerotic study in a diet-modified murine model. It provided sufficient resolution to detail the morphology of atherosclerotic plaques within the blood vessels and it provided sufficient contrast to distinguish certain distinct components of the plaques. Through digital image segmentation, the MRI data was intricately displayed and accurately quantified.Acknowledgements
No acknowledgement found.References
1. Virani SS, Alonso A, Benjamin EJ, Bittencourt MS, Callaway CW, Carson AP, Chamberlain AM, Chang AR, Cheng S, Delling FN, Djousse L, Elkind MSV, Ferguson JF, Fornage M, Khan SS, et al. Heart Disease and Stroke Statistics—2020 Update: A Report From the American Heart Association. Circulation. 2020;141(9).
2. Herrington W, Lacey B, Sherliker P, Armitage J, Lewington S. Epidemiology of Atherosclerosis and the Potential to Reduce the Global Burden of Atherothrombotic Disease. Circulation Research. 2016;118(4):535–546.
3. Reardon GSG and CA. Apoe knockout and knockin mice: the history of their contribution to the understanding of atherogenesis. Journal of Lipid Research. 2016;57:758–766.
4. Zhang SH, Reddick RL, Piedrahita JA, Maeda N. Spontaneous Hypercholesterolemia and Arterial Lesions in Mice Lacking Apolipoprotein E. Science. 1992;258(5081):468–471.
5. Nakashima Y, Plump AS, Raines EW, Breslow JL, Ross R. Apoe-deficient mice develop lesions of all phases of atherosclerosis throughout the arterial tree. Arteriosclerosis and Thrombosis: A Journal of Vascular Biology. 1994;14(1):133–140.
6. Merickel MB, Carman CS, Brookeman JR, Mugler JP, Brown MF, Ayers CR. Identification and 3-D quantification of atherosclerosis using magnetic resonance imaging. Computers in Biology and Medicine. 1988;18(2):89–102.
Figures


