1746
Brain iron deposition in patients with unilateral middle cerebral artery stenosis: an in vivo quantitative susceptibility mapping study1Radiology, The First Affiliated Hospital of Shandong First Medical University, Jinan, China, 2MR Research China, GE Healthcare, Beijing, China
Synopsis
The main purpose was to quantitatively evaluate iron alterations in gray matter (GM) nucleus of patients with unilateral middle cerebral artery stenosis (MCAS)-related ischemic stroke using quantitative susceptibility mapping (QSM). Forty-six unilateral MCAS patients and thirty-eight healthy controls underwent QSM examination. Iron-related susceptibility of GM nucleus, including bilateral caudate nucleus, putamen (PU), globus pallidus (GP), thalamus, substantia nigra (SN), red nucleus, and dentate nucleus were assessed. Compared with healthy controls, PU, GP, and SN regions at lesion side presented significantly increased susceptibility in patients, indicating that abnormal iron metabolism may present in the brain after ischemic stroke.
Introduction
Ischemic stroke, is one of the main causes of adult disability and even human death. Intracranial artery stenosis is the main cause of ischemic stroke, with the highest proportion of middle cerebral artery stenosis (MCAS)1. In pre-clinical ischemic stroke models caused by MCAS, increased iron deposited in the lesioned hemisphere, and iron deposition exacerbated neuronal damage during ischemia/reperfusion2. However, due to the invasive nature of pathological examination for iron quantification, studies on iron related neurological diseases only stay at pre-clinical phase. Quantitative susceptibility mapping (QSM), a promising MRI technique for quantifying the spatial distribution of magnetic susceptibility in biological tissues, has been proposed3. By reconstructing magnetic susceptibility sources from field perturbations, iron level in vivo can be measured using QSM3. Previous studies have confirmed that QSM susceptibility correlated positively with the average iron levels in brain tissue. Moreover, QSM has been able to identify iron deposition in the brain, particularly in gray matter (GM) nucleus, for many neurological diseases such as Alzheimer's disease, Parkinson's disease, and Huntington's disease4. However, potential changes in the cerebral iron content in patients with ischemic stroke have not been systematically explored so far. Therefore, the main purpose of this study was to explore iron alterations in GM nucleus of patients with ischemic stroke caused by long-term unilateral MCAS using QSM.Materials and Methods
Subjects46 patients with unilateral MCAS (24 males and 22 females, mean age: 52.35 ± 11.82 years old, education: 10.70 ± 3.20 years) and 38 age-, sex- and education-matched healthy controls (HCs) (16 males and 22 females, mean age: 48.50 ± 14.16 years old, education: 11.39 ± 3.39 years) were recruited in this study. Each participant underwent conventional brain MRI and QSM.
MRI experiments
All experiments were performed on a 3T clinical scanner (Discovery 750w, GE Healthcare, Milwaukee, WI, USA) equipped with a 32-channel coil. Conventional brain MRI of T1W, T2W, DWI and magnetic-resonance-angiography (MRA) were performed. Three-dimensional spoiled gradient echo based QSM imaging was performed for each participant with scan parameters of number of TEs = 8 (first TE = 3.0 msec, TE interval = 3.1 msec), TR = 28.1 msec, FOV = 240 mm × 240 mm, flip angle = 20°, matrix size = 240 × 240, slice thickness = 2 mm, number of slices = 120, scanning time = 2 minutes 31 seconds.
Image Analysis
STI Suite embedded in MATLAB (MathWorks, Natick, MA) was applied for QSM susceptibility mapping calculation5. The obtained QSM derived susceptibility maps were used to manually draw regions-of-interest (ROIs) in GM nucleus area, including bilateral caudate nucleus (CN), putamen (PU), globus pallidus (GP), thalamus (TH), substantia nigra (SN), red nucleus (RN) and dentate nucleus (DN), by two experienced neuroradiologists (Figure 1). Mean susceptibility values of each ROI as measured by two observers were obtained.
Statistical analysis
All statistical analyses were performed in Graphpad prism and IBM SPSS 22.0. Intra-class correction coefficient (ICC) was used to evaluate the inter-observer agreement of susceptibility measurements between both radiologists. ICC>0.75 was considered good reproducibility. Paired t-test was used to compare susceptibility between the left and right GM nucleus in HCs. One-way analysis of variance (one-way ANOVA) followed by post hoc least-significant-difference test was used to assess the susceptibility differences among HCs, lesion side and contralateral side in patient group. Significant threshold was set as P <0.05.
Results
Using ICC analysis, high inter-observer agreements were confirmed by high ICC values (0.811≤ICCs≤0.939) for susceptibility measurements in all seven GM nucleus subregions between two neuroradiologists.With paired t-test, except for CN, most bilateral GM nucleus subregions showed comparable susceptibility values in HCs. Therefore, the mean susceptibility values of each subregion over right and left sides were used for HCs in further statistical analysis.
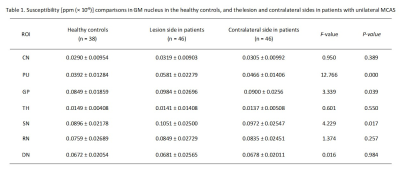
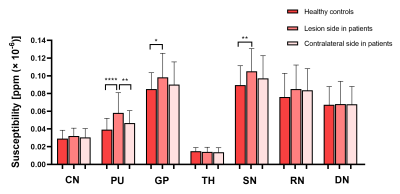
Using one-way ANOVA, susceptibility values in PU, GP, and SN were significantly different among HCs, lesion and contralateral side in patients, respectively (F(2, 127) = 12.766, 3.339, 4.229, all P<0.05). Compared with HCs, PU, GP, and SN regions at the lesion side presented significantly increased susceptibility values in patients (mean: 0.0392 ± 0.01284 ppm (× 10−6) vs. 0.0581 ± 0.02279 ppm (× 10−6) for PU; 0.0849 ± 0.01859 ppm (× 10−6) vs. 0.0984 ± 0.02696 ppm (× 10−6) for GP; 0.0896 ± 0.02178 ppm (× 10−6) vs. 0.1051 ± 0.02500 ppm (× 10−6) for SN; all P<0.05). In addition, PU exhibited significantly higher susceptibility values at the lesion than the contralateral side (mean: 0.0581 ± 0.02279 ppm (× 10−6) vs. 0.0466 ± 0.01406 ppm (× 10−6), P<0.05). (Table 1 and Figure 2)
Discussion and conclusions
In this study, QSM derived susceptibility was used to investigate the potential changes of iron content in GM nucleus for ischemic stroke patients caused by long-term unilateral MCAS. Our results showed that the lesion side PU, GP, and SN presented significantly increased susceptibility values in patients compared with healthy controls, and the lesion side PU exhibited significantly higher susceptibility relative to contralateral side, indicating that abnormal iron metabolism may present in the brain after chronic MCAS.Therefore, excess iron deposition in GM nucleus, as indicated by QSM imaging, may provide increased understanding of the pathophysiological mechanism of ischemic stroke.
Acknowledgements
We thank Weiqiang Dou from GE Healthcare for this valuable support on QSM imaging.References
1. Ran Y, Wang Y, Zhu M, et al. Higher Plaque Burden of Middle Cerebral Artery Is Associated With Recurrent Ischemic Stroke: A Quantitative Magnetic Resonance Imaging Study. Stroke. 2020;51(2):659-662.
2. Tuo QZ, Lei P, Jackman KA, et al. Tau-mediated iron export prevents ferroptotic damage after ischemic stroke. Mol Psychiatry. 2017;22(11):1520-1530.
3. Ruetten PPR, Gillard JH, Graves MJ. Introduction to Quantitative Susceptibility Mapping and Susceptibility Weighted Imaging. Br J Radiol. 2019;92(1101):20181016.
4. Vinayagamani S, Sheelakumari R, Sabarish S, et al. Quantitative Susceptibility Mapping: Technical Considerations and Clinical Applications in Neuroimaging. J Magn Reson Imaging. 2021;53(1):23-37.
5. Li W, Avram AV, Wu B, et al. Integrated Laplacian-based phase unwrapping and background phase removal for quantitative susceptibility mapping. NMR Biomed. 2014;27(2):219-227.
Figures


