1745
Fatty Acid Composition MRI of Human Epicardial Adipose Tissue1Biomedical Engineering, University of Virginia, Charlottesville, VA, United States
Synopsis
Epicardial adipose tissue (EAT) fatty acid composition (FAC) plays an important role in coronary vascular inflammation due to obesity and diabetes. We show for the first time the feasibility of quantifying human EAT FAC using radial multi-echo gradient-echo MRI with IDEAL mapping. This method may enable further investigations into the relationship between EAT fatty acid composition and cardiovascular disease.
Introduction
Epicardial adipose tissue (EAT) is the adipose tissue that lies immediately around the myocardium, and it is in direct contact and shares a microcirculation with both the myocardium and the coronary vessels. In healthy conditions, EAT plays beneficial roles, including as a source of free fatty acids used as fuel by cardiomyocytes and to protect the coronary vessels against mechanical strain. In the settings of obesity and diabetes, EAT, which is a visceral fat depot, becomes pro-inflammatory, secretes cytokines, and promotes vascular disease and fibrosis in the heart1,2. Recently there has been a growing interest in imaging EAT, focusing on accurately and rapidly quantifying EAT volume. However, as saturated fatty acids activate proinflammatory signaling pathways7,8, MRI of the EAT fatty acid composition (FAC) may represent an imaging biomarker of proinflammatory EAT. We have previously demonstrated MRI of EAT FAC in obese mouse models and its relationship to coronary microvascular disease9. Here we develop methods for MRI of EAT FAC in humans and demonstrate the feasibility of breath-hold methods.Methods
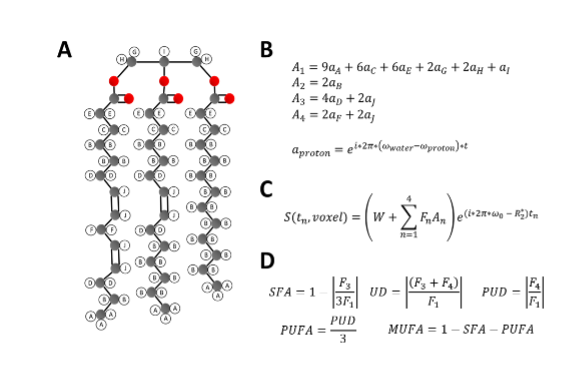
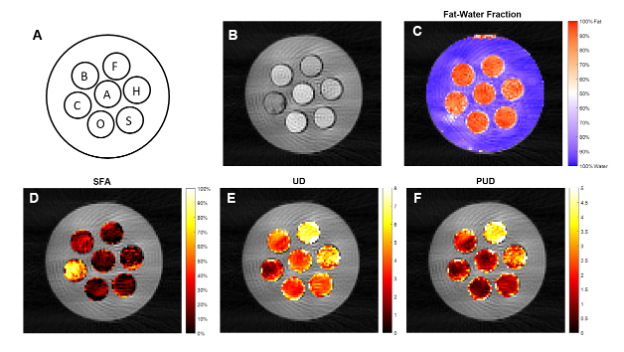
Imaging was performed using a 3.0T scanner (Magnetom Prisma, Siemens Healthcare, Erlangen, Germany). For EAT FAC imaging, we developed a multi-echo gradient-echo sequence that acquires images at 18 echo times equally spaced from 1.7-17.0ms at 0.9ms intervals. The sequence employs a radial k-space trajectory with evenly spaced radial projections from 0-pi radians and a tiny golden angle increment of the projection angles across the echo-time dimension. To achieve the short echo spacing, time-shifted echo trains with echo-train length of 9 were acquired after two different excitation pulses. More specifically, after each ECG trigger, 2 echo trains for each of 5 radial spokes were acquired during an acquisition footprint of 175ms (2 x 17.5ms x 5). As described in Figure 1, for FAC mapping we utilized a signal model accounting for the ten proton resonances present in triglycerides. These resonances are grouped into four triglyceride sub-components (F1 to F4), and combined with a complex field map describing the B0 and R2* effects. The signal from each triglyceride component is calculated voxel-by-voxel by fitting the multi-echo signal to the signal model using an Iterative Decomposition of water and fat with Echo Asymmetry and Least‐squares estimation (IDEAL) method10. The signals from the triglyceride components can then be used to calculate the percentage of saturated fatty acids (SFA), unsaturated degree (UD), and poly-unsaturated degree (PUD) of the representative triglyceride within each voxel. FAC can be further divided into percentage of monounsaturated fatty acids (MUFA) and polyunsaturated fatty acids (PUFA)11 with the additional understanding that the majority of fatty acids found in human adipose tissue (>98%) have no more than two double bonds12.To validate the methods, a phantom was constructed from seven plastic, 50mL conical tubes, each filled with a distinct oil. Figure 2A shows the locations of each oil in the phantom. For both the phantom and human imaging, a single slice was acquired with a flip angle of 30 degrees, 300mm FOV, a slice thickness of 8mm, a 144x144 matrix size, and an 18-channel phased-array coil. The phantom images were acquired with 160 radial views and a simulated R-R interval of 1000ms, and were reconstructed using SENSE. For human imaging, 80 radial views were acquired resulting in a single breath-hold, 16-heartbeat scan, and CG-SENSE was used for reconstruction13.
Results
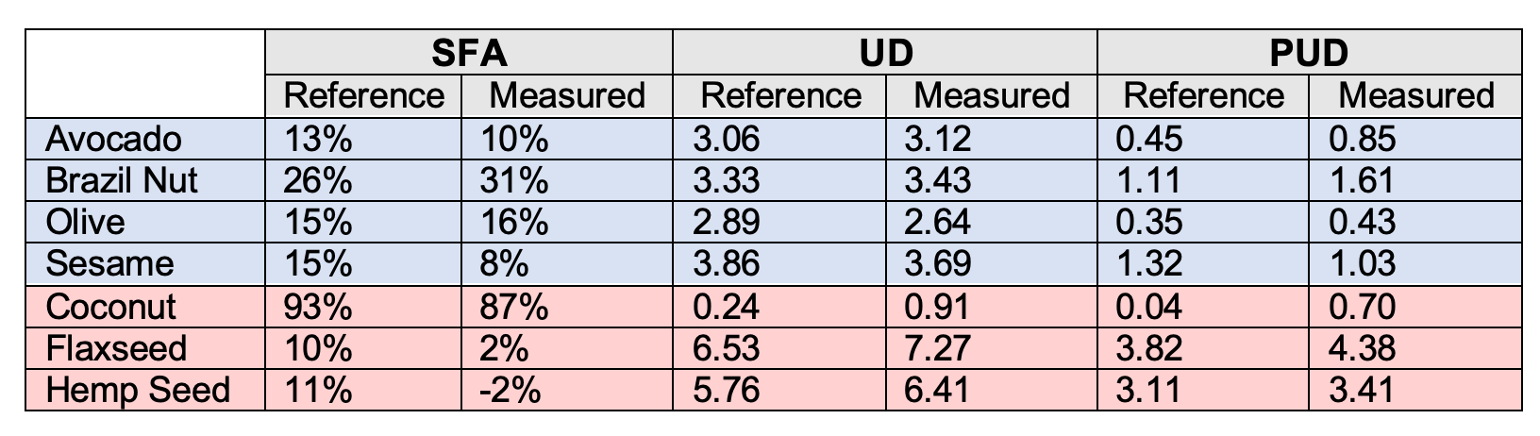
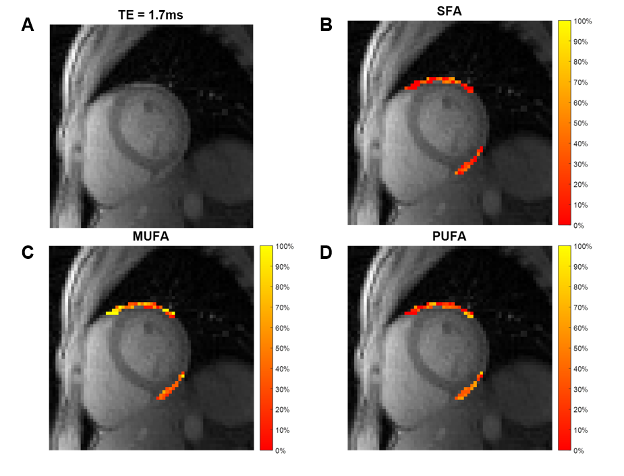
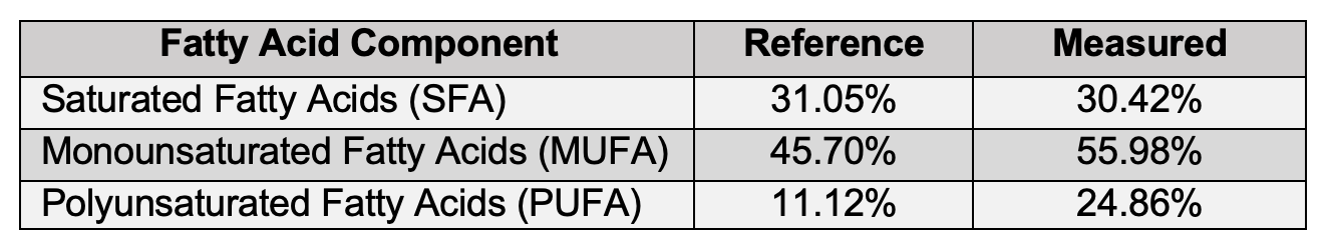
Figures 2D-F show SFA, UD, and PUD maps of the oil phantom. As the oils contain high amounts of fatty acids with more than two double bonds, only SFA, UD, and PUD were calculated. Approximate reference values, shown in Figure 3, for SFA, UD, and PUD were calculated from USDA fatty acid composition data 14-19. Figure 4A shows an example image at the first echo time from a human volunteer. Figures 4B-D shows SFA, MUFA and PUFA maps, respectively, of the EAT in the same volunteer. The average values for SFA, MUFA and PUFA in the EAT were 30.42%, 55.98%, and 24.86% respectively. As there are no reference EAT FAC values for healthy individuals, the measured values for the volunteer were compared with values taken from tissue samples of patients undergoing cardiac surgery20 and are shown in Figure 5. While the EAT FAC from the referenced study is unlikely to closely match the EAT FAC of a healthy individual, it serves as an indicator that our measured values are within a plausible range.Conclusion and Discussion
To the best of our knowledge, this is the first report showing the feasibility of FAC MRI of EAT in humans. Limitations of our work to date are that the method did not perform as well at extremes of SFA, UD and PUD, as shown in our phantom study; however, results are more accurate when the FAC is similar to that of human adipose tissue. While further development is needed, these results demonstrate the feasibility of MRI to map the FAC of EAT, enabling further studies to improve the method and determine whether higher values of SFA reflect a proinflammatory EAT, and whether higher values of PUFAs may reflect an anti-inflammatory EAT.Acknowledgements
This work was supported by NIH NIBIB R01 EB001763.
References
1. Cikim, A. S. et al. Epicardial adipose tissue, hepatic steatosis and obesity. Journal of endocrinological investigation 30, 459–464 (2007).
2. Iacobellis, G., Malavazos, A. E. & Corsi, M. M. Epicardial fat: from the biomolecular aspects to the clinical practice. The international journal of biochemistry & cell biology 43, 1651–1654 (2011).
3. Mazurek, T. et al. Human epicardial adipose tissue is a source of inflammatory mediators. Circulation 108, 2460–2466 (2003).
4. Guo, C. et al. Williams, GH and Adler, GK (2008) Mineralocorticoid Receptor Blockade Reverses 33 Obesity-Related Changes in Expression of Adiponectin, Peroxisome Proliferator-Activated 34 Receptor-γ, and Proinflammatory Adipokines. Circulation 117, 2253–2261 (32).
5. Hirata, A. et al. Blockade of mineralocorticoid receptor reverses adipocyte dysfunction and insulin resistance in obese mice. Cardiovascular research 84, 164–172 (2009).
6. Caprio, M. et al. Pivotal role of the mineralocorticoid receptor in corticosteroid‐induced adipogenesis. The FASEB Journal 21, 2185–2194 (2007).
7. Walker, M. E. et al. Dietary patterns influence epicardial adipose tissue fatty acid composition and inflammatory gene expression in the Ossabaw pig. The Journal of Nutritional Biochemistry 70, 138–146 (2019).
8. Vaittinen, M. et al. Interorgan cross talk between fatty acid metabolism, tissue inflammation, and FADS2 genotype in humans with obesity. Obesity 25, 545–552 (2017).
9. Shah et al. CMR shows that Eplerenone promotes anti-inflammatory epicardial adipose tissue and preserves coronary microvascular function in mice fed a high-fat high-sucrose diet. SCMR 2022, submitted.
10. Yu, H. et al. Multiecho reconstruction for simultaneous water‐fat decomposition and T2* estimation. Journal of Magnetic Resonance Imaging: An Official Journal of the International Society for Magnetic Resonance in Medicine 26, 1153–1161 (2007).
11. Berglund, J., Ahlström, H. & Kullberg, J. Model‐based mapping of fat unsaturation and chain length by chemical shift imaging—phantom validation and in vivo feasibility. Magnetic Resonance in Medicine 68,1815–1827 (2012)
12. Hodson L, Skeaff CM, Fielding BA. Fatty acid composition of adipose tissue and blood in humans and its use as a biomarker of dietary intake. Progress in Lipid Research. 47, 348-380 (2008).
13. Pruessmann, K.P., Weiger, M., Börnert, P. and Boesiger, P. Advances in sensitivity encoding with arbitrary k-space trajectories. Magnetic resonance in medicine 46, 638-651 (2001).
14. United States Department of Agriculture. (2019). FoodData Central, Oil, avocado. Retrieved from https://fdc.nal.usda.gov/fdc-app.html#/food-details/173573/nutrients
15. United States Department of Agriculture. (2019). FoodData Central, Nuts, brazilnuts, dried, unblanched. Retrieved from https://fdc.nal.usda.gov/fdc-app.html#/food-details/170569/nutrients
16. United States Department of Agriculture. (2019). FoodData Central, Oil, coconut. Retrieved from https://fdc.nal.usda.gov/fdc-app.html#/food-details/330458/nutrients
17. United States Department of Agriculture. (2019). FoodData Central, Oil, flaxseed, cold pressed. Retrieved from https://fdc.nal.usda.gov/fdc-app.html#/food-details/167702/nutrients
18. United States Department of Agriculture. (2019). FoodData Central, Oil, olive, salad or cooking. Retrieved from https://fdc.nal.usda.gov/fdc-app.html#/food-details/171413/nutrients
19. United States Department of Agriculture. (2019). FoodData Central, Oil, sesame, salad or cooking. Retrieved from https://fdc.nal.usda.gov/fdc-app.html#/food-details/171016/nutrients
20. Hjelmgaard, Katrin et al. Fatty Acid Composition in Various Types of Cardiac Adipose Tissues and Its Relation to the Fatty Acid Content of Atrial Tissue. Nutrients 10, 1506 (2018).
Figures