1744
Increased Iron Deposition in Gray Matter Nuclei in Patients with Intracranial Artery Stenosis Evaluated by Quantitative Susceptibility Mapping1Radiology, The First Affiliated Hospital of Shandong First Medical University, Jinan, China, 2MR Research China, GE Healthcare, Beijing, China
Synopsis
This study aimed to use quantitative susceptibility mapping (QSM) to systematically investigate iron content changes of gray matter (GM) nuclei in patients with long-term anterior circulation artery stenosis (ACAS) and posterior circulation artery stenosis (PCAS). The differences of iron-related susceptibility in GM nuclei, including bilateral caudate nucleus, putamen (PU), globus pallidus (GP), thalamus, substantia nigra (SN), red nucleus and dentate nucleus (DN) were explored in 25 ACAS and 25 PCAS patients. Compared with healthy controls, mean susceptibility of bilateral PU, GP, and SN in ACAS and PCAS patients, and of extra bilateral DN in PCAS patients were significantly increased.
Introduction
Intracranial artery stenosis (ICAS) is one of the main causes of ischemic stroke, accounting for 30%~50% of total ischemic stroke cases.1 In cerebral arterial system, ICAS can be classified into anterior circulation artery stenosis (ACAS) and posterior circulation artery stenosis (PCAS). For ACAS or PCAS, brain tissues in blood supply areas can be ischemia and hypoxia, promoting a series of pathophysiological reactions, including oxidative stress induced by iron deposition, to cause neuronal damage.2 Iron content quantification is essential to evaluate the level of normal neurophysiological functions. Children following severe ischemic-anoxic insults showed hypointensity in basal ganglia on T2-weighted imaging (T2WI), which may be related to iron deposition.3 However, quantitative information about iron deposition cannot be provided only by observing changes in signal intensity on T2WI.Quantitative susceptibility mapping (QSM) is a novel MRI approach that can help quantify materials with changing susceptibility and has been shown to evaluate iron content in brain, particularly in gray matter (GM) nuclei, where iron is the dominant source introducing magnetic susceptibility.4 Previous reports showed a strong positive correlation between QSM susceptibility and biochemically quantified iron content. Alterations of brain iron content were observed in both human and animal models with ACAS.5,6 However, PCAS has received little attention so far, especially concerning the changes of iron metabolism in ischemic stroke secondary to PCAS.
Therefore, the main goal of this study was to systematically explore the changes of brain iron in patients with ischemic stroke secondary to chronic ICAS, including ACAS and PCAS.
Materials and Methods
Subjects25 ACAS patients (15 males and 10 females, mean age 56.88 ± 10.93 years), 25 PCAS patients (18 males and 7 females, mean age 56.76 ± 10.47 years), and 25 age- and sex-matched healthy controls (14 males and 11 females, mean age 56.80 ± 10.73 years) were included in this study. Patients were scored using NIHSS and mRS scales to assess the degree of neural function deficiency. Each participant underwent conventional brain MRI and QSM measurements.
MRI experiments
All experiments were performed on a 3.0T MRI scanner (GE Discovery MR750, USA) with a 32-channel head coil. In addition to routine brain MRI including T1W, T2W, DWI and magnetic-resonance-angiography (MRA), QSM imaging was also performed for each participant. Three-dimensional spoiled gradient echo based QSM imaging was performed for each participant with scan parameters of number of TEs = 8 (first TE = 3.0 msec, TE interval = 3.1 msec), TR = 28.1 msec, FOV = 240 mm × 240 mm, flip angle = 20°, matrix size = 240 × 240, slice thickness = 2 mm, number of slices = 120, scanning time = 2 minutes 31 seconds.
Image Analysis
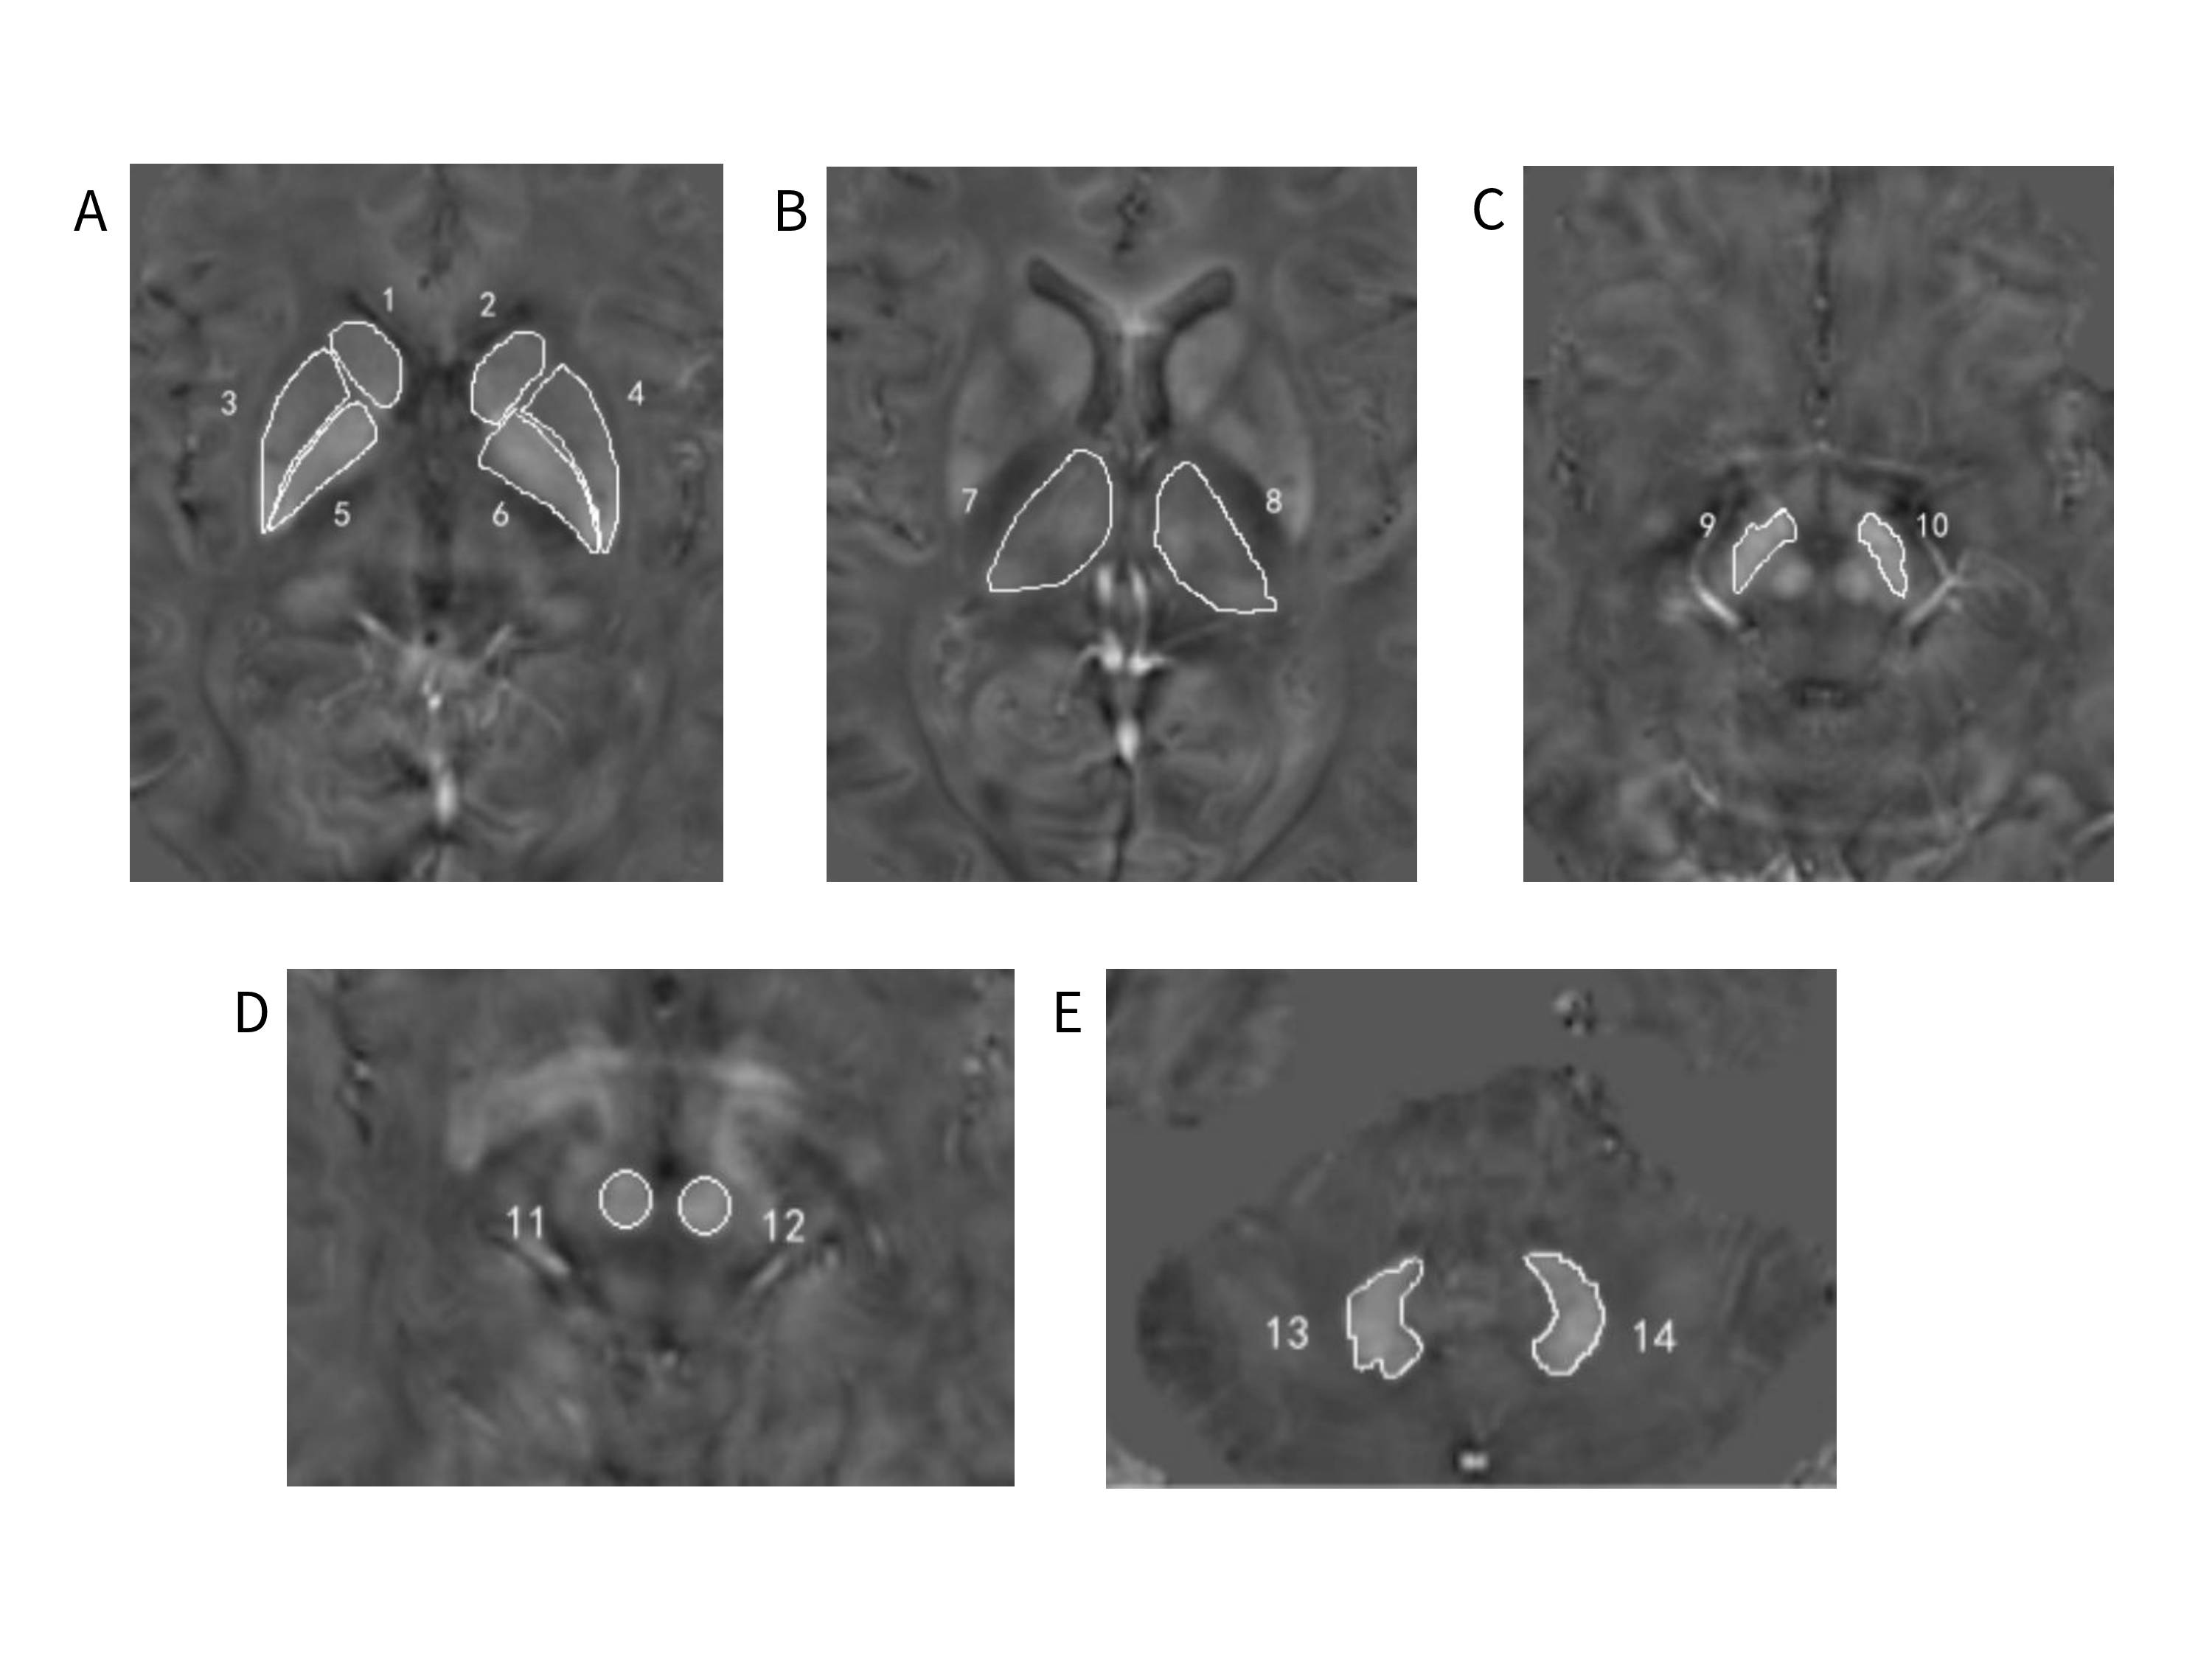
QSM maps were calculated from magnitude and phase data using STI Suite.7 The regions-of-interest (ROIs), including bilateral caudate nucleus (CN), putamen (PU), globus pallidus (GP), thalamus (TH), substantia nigra (SN), red nucleus (RN) and dentate nucleus (DN), were manually segmented on QSM images by two radiologists (Figure 1). Mean susceptibility values of each ROI as measured by two observers were obtained.
Statistical analysis
All statistical analyses were performed in Graphpad prism and IBM SPSS 22.0. Paired t-test was used to compare susceptibility between the left and right GM nuclei in healthy controls, ACAS patients, and PCAS patients, respectively. Susceptibility differences in ACAS patients and PCAS patients were then separately compared with healthy controls using independent sample t-test. Spearman correlation analysis was separately performed to assess the relationships of susceptibility with NIHSS and mRS scores. Significant threshold was set as p < 0.05.
Results
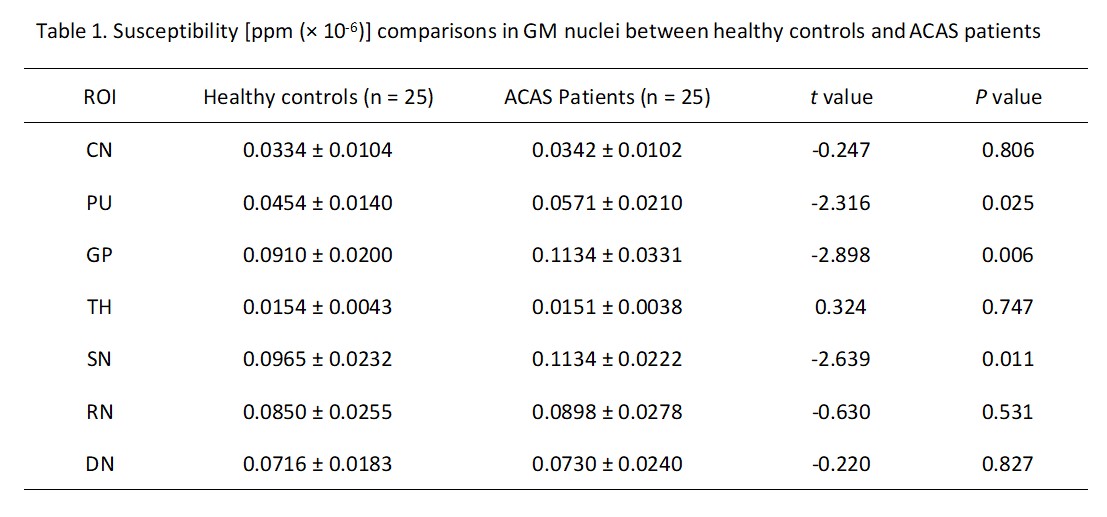
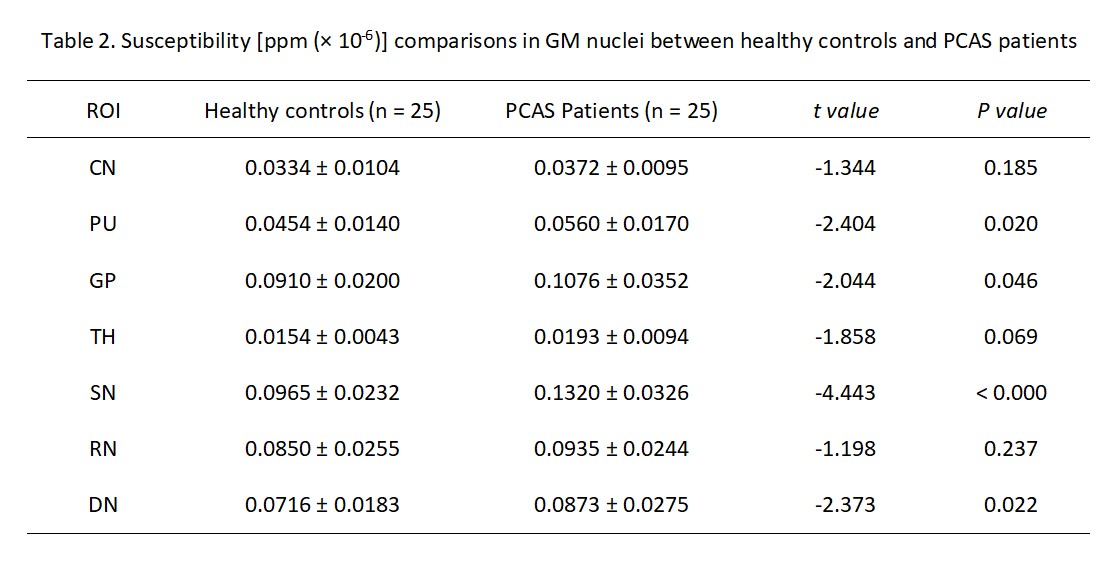
Paired t-test test showed no significant differences between the left and right susceptibility in all seven GM nucleus subregions for healthy controls, ACAS patients, and PCAS patients, respectively. Therefore, the mean susceptibility values of each bilateral GM nuclei subregions were used for healthy controls, ACAS patient and PCAS patient groups in further data analyses, respectively.Using independent sample t-test, ACAS patients exhibited significantly higher susceptibility than healthy controls in bilateral PU, GP, and SN (all P < 0.05; Table 1). Compared with healthy controls, PCAS patients presented significantly higher susceptibility in the PU, GP, SN, and DN, respectively (all P < 0.05; Table 2).
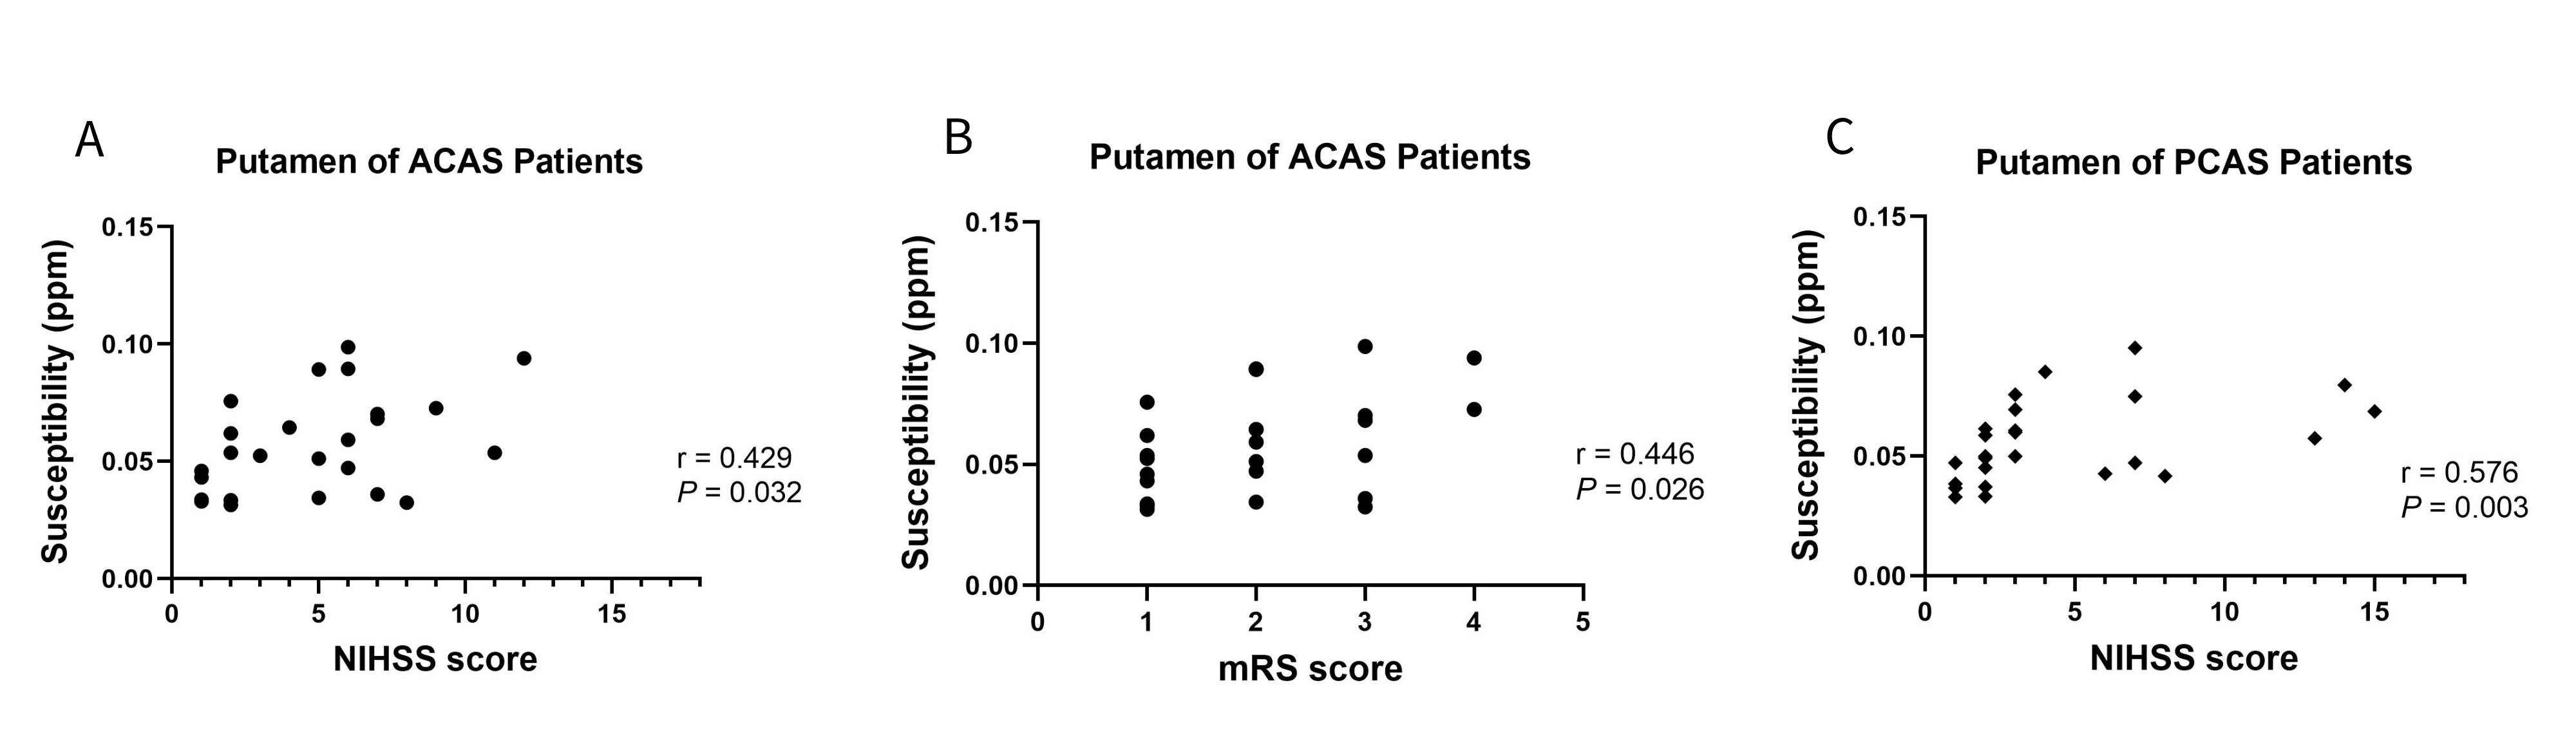
With Spearman correlation analysis, mean susceptibility at bilateral PU of ACAS patients was significantly correlated with NIHSS and mRS scores (r = 0.429 and 0.446, both P < 0.05), and at bilateral PU in PCAS patients was correlated with NIHSS score (r = 0.576, P < 0.05). (Figure 2)
Discussion and conclusions
In this study, using QSM imaging, several GM nucleus subregions, including bilateral PU, GP, and SN in ACAS patients and PU, GP, SN, and DN in PCAS patients, exhibited increased iron deposition, indicating that abnormal iron metabolism may present in different subregions of deep GM nuclei after long-term ACAS and PCAS. In addition, iron content of PU in patients with ACAS and PCAS was correlated with neurological deficit scores. Therefore, iron deposition in GM nuclei after long-term ACAS and PCAS, as measured by QSM, might not only be a novel MRI feature but also a potential biomarker for neural function deficiency.Acknowledgements
We thank Weiqiang Dou from GE Healthcare for this valuable support on QSM imaging.References
1. Banerjee C, Chimowitz MI. Stroke caused by atherosclerosis of the major intracranial arteries. Circ Res. 2017;120(3):502-513.
2. Sekerdag E, Solaroglu I, Gursoy-Ozdemir Y. Cell death mechanisms in stroke and novel molecular and cellular treatment options. Curr Neuropharmacol. 2018;16(9):1396-1415.
3. Dietrich RB, Bradley WG Jr. Iron accumulation in the basal ganglia following severe ischemic-anoxic insults in children. Radiology. 1988;168(1):203-206.
4. Wu B, Li W, Guidon A, et al. Whole brain susceptibility mapping using compressed sensing. Magn Reson Med. 2012;67(1):137-147.
5. Tuo QZ, Lei P, Jackman KA, et al. Tau-mediated iron export prevents ferroptotic damage after ischemic stroke. Mol Psychiatry. 2017;22(11):1520-1530.
6. Du L, Zhao Z, Liu X, et al. Alterations of iron level in the bilateral basal ganglia region in patients with middle cerebral artery occlusion. Front Neurosci. 2020;14:608058.
7. Li W, Avram AV, Wu B, et al. Integrated Laplacian-based phase unwrapping and background phase removal for quantitative susceptibility mapping. NMR Biomed. 2014;27(2):219-227.
Figures