1743
Optical and fMRI responses to activation of GABAergic parvalbumin and somatostatin neurons.1Department of Biomedical Engineering, Sungkyunkwan University, Center for Neuroscience Imaging Research (CNIR), Institute for Basic Science (IBS), Suwon, Korea, Republic of, 2Center for Neuroscience Imaging Research (CNIR), Institute for Basic Science (IBS), Suwon, Korea, Republic of
Synopsis
The GABAergic neurons directly and indirectly regulate hemodynamics. Thus, investigating neurovascular coupling of subtype interneurons is highly important to interpret fMRI data, especially optogenetic fMRI. However, role of subtype interneurons to fMRI is not known. Here, we measured multi-wavelength optical imaging and CBV-weighted fMRI to investigate hemodynamic and metabolic responses of two most common interneuron subtypes, parvalbumin (PV) and somatostatin (SOM). PV induced biphasic hemodynamic responses, initial decrease and later increase, whereas SOM produced only positive hemodynamic responses. In both PV and SOM interneurons, dilation was initiated from the cortical surface.
INTRODUCTION
Widely-used fMRI is an indirect measure of neural activity. Increases and decreases in the fMRI response are often assumed to reflect increases and decreases (deactivation) in excitatory neural activity, respectively, because excitatory neurons constitute 80–90% of all neurons in the cortex. The remaining GABAergic neurons play a critical role in cortical processing and directly and indirectly regulate hemodynamics. Thus, investigating neurovascular coupling (NVC) of subtype interneurons is highly important to interpret fMRI data, especially optogenetic fMRI. In our fMRI and optical imaging studies1, optogenetic stimulation of inhibitory neurons in the primary somatosensory cortex (VGAT-ChR2 mice) induced a distinctive biphasic response at the stimulating site, initial increase in CBV, and follow-up decrease. The property of hemodynamic responses by optogenetic stimulation of inhibitory neurons is dependent on stimulation frequency, stimulation duration, and subtype of GABAergic neurons. Each subtype of interneurons controls vascular response differently. Parvalbumin interneurons (PV) known as fast-spiking neurons with the largest population among interneurons interact with excitatory neurons, and its role in vascular responses is inconsistent among literature; some reported no change2, increase3 or decrease in hemodynamics4. Somatostatin interneurons (SOM), which are the second-highest dense interneurons, can release a variety of molecular markers, including vasoactive nitric oxide (NO) and vasoconstrictive neuropeptide Y (NPY). Thus, its hemodynamic response can be complex2, 5. In this study, we investigated the role of two common subtype interneurons, PV and SOM, to hemodynamic and metabolic responses with optical intrinsic signal imaging (OISI) and CBV-weighted fMRI (CBV-fMRI).METHODS
Animal preparationIntra-cortical injection with AAV-Dio-ChR2(H134R)-YFP was performed at the left primary somatosensory area (S1) on PV-cre and SOM-cre (aged 2-3 months). Then, the skull was thinned and covered by a thin layer of cyanoacrylate glue.
The mouse was anesthetized with an initial mixture of ketamine (Ket: 100mg/kg) and xylazine (Xyl: 10 mg/kg), and a supplementary dose (25mg/kg Ket and 1.25mg/kg Xyl) for most functional studies, or isoflurane (ISO) for anesthesia-dependent study.
Experiment design
ChR2-stimulation parameters were duration of 5 or 20 seconds, frequency of 20Hz, power of 3 or 1.6mW, and 20% of duty cycle, delivered through an optical fiber for OISI and with a newly-developed digital micromirror device (DMD) system for fMRI (see Moon et al., submitted ISMRM Abstract).
Optical intrinsic signal imaging
OISI was performed at 530nm (CBV-weighted) and 625nm (BOLD-weighted). Detailed experimental setup can be found1.
CBV-weighted fMRI
All data sets were obtained on a 9.4T MRI scanner integrated with a DMD-driven laser system. For CBV-fMRI, we used the single-shot gradient-echo echo-planar imaging (GE-EPI) sequence with the following parameters: FOV = 12×6mm2, matrix size = 96×48, in-plane resolution = 125×125μm2 with a slice thickness of 500μm, sampling bandwidth = 300kHz, TR = 1000ms, TE = 7ms, and FA = 47∘. A 15mg/kg of MION was injected intravenously.
RESULTS
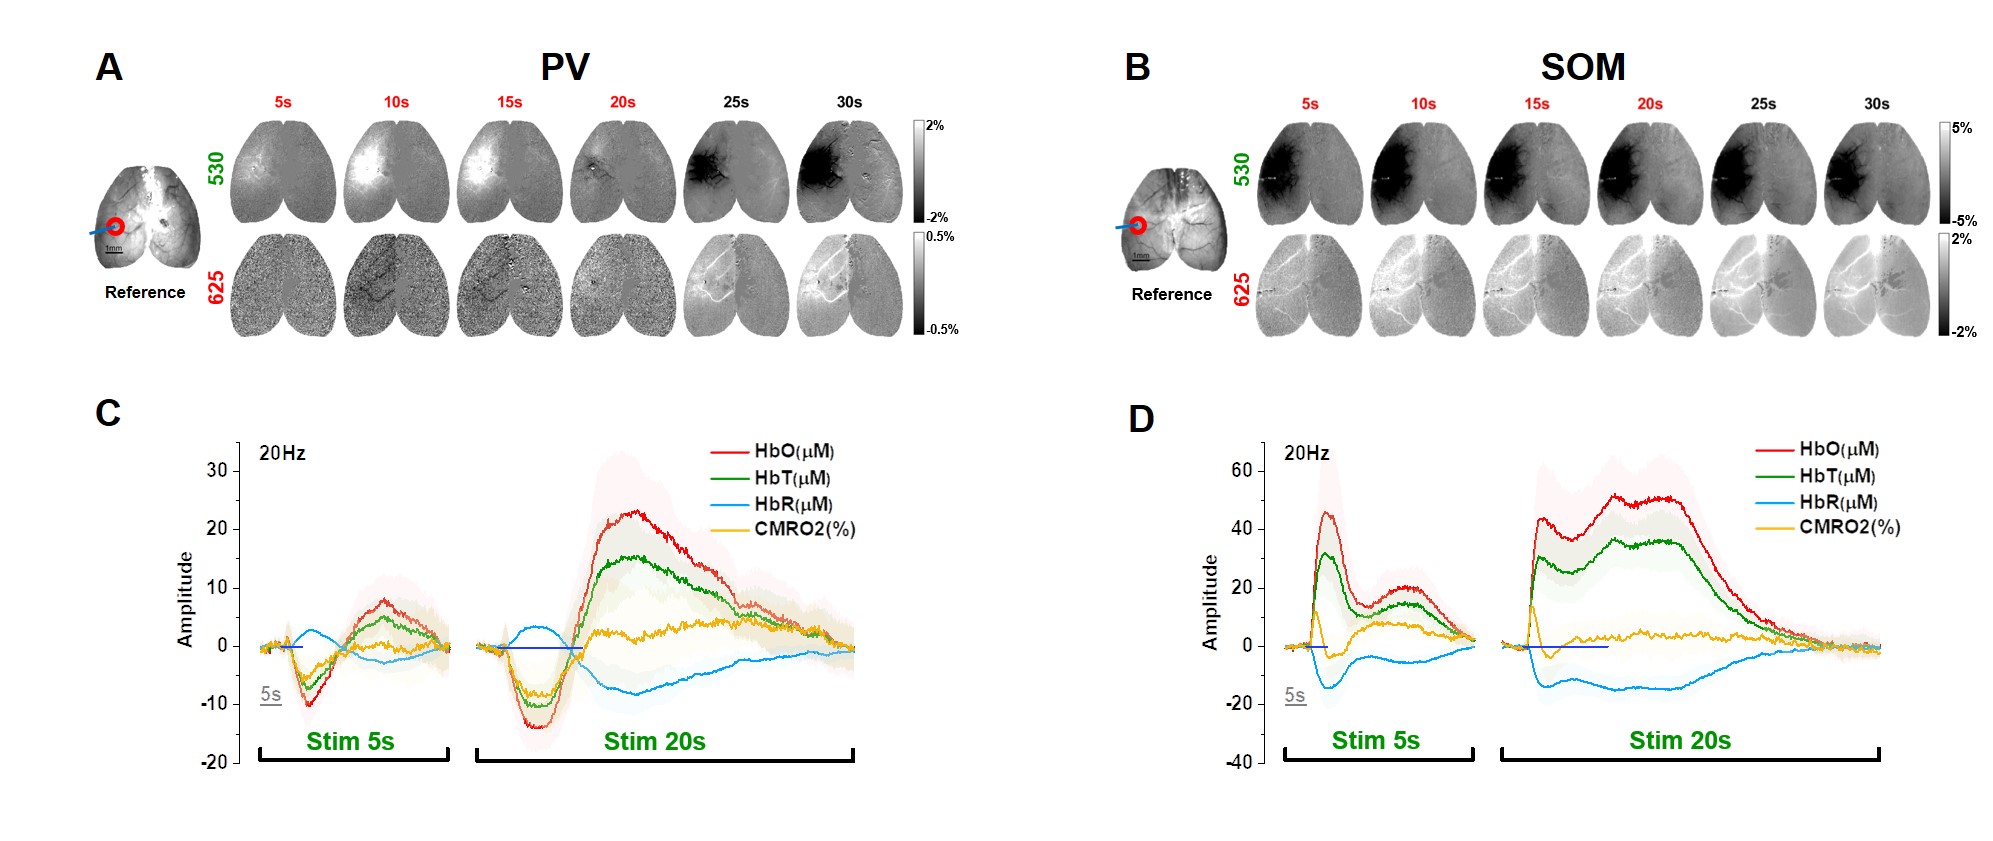
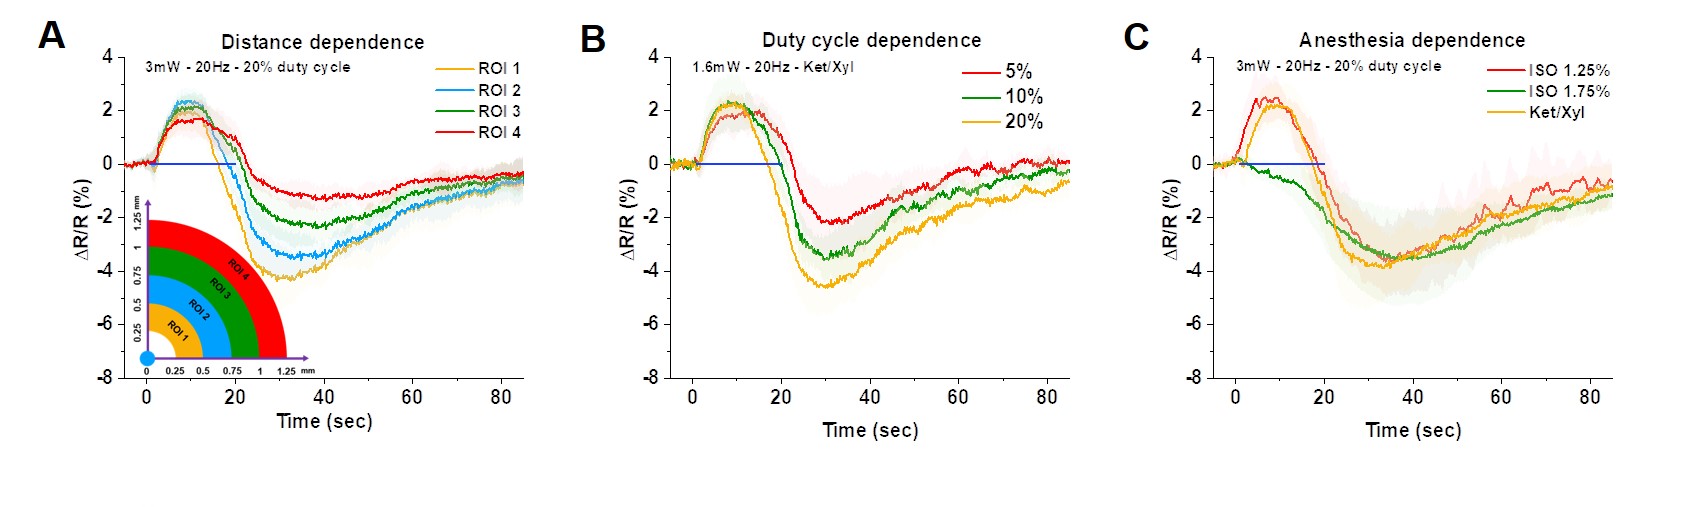
We first used optical imaging to detect hemodynamic changes evoked by subtype-specific optostimulus (Fig. 1). Activating PV interneurons decreased CBV initially (brightening in 530 nm), followed by a significant increase in CBV (darkening) (Fig. 1A), while SOM interneurons induced only dilation (Fig. 1B). Oxygen consumption (Fig. 1C yellow) decreased during PV-ChR2 activation due to the reduction of excitatory activity, while it increased only during the initial period of SOM-ChR2 stimulation. Post-stimulus CBV increase observed in PV and SOM ChR2 stimulation did not accompany with increased oxygen metabolism.To investigate the source of post-stimulus dilation in PV neurons, we investigated its dependence on the choice of ROIs, duty cycle, and anesthetics (Fig. 2). Photostimulus causes vasoconstriction, which is similar for different ROIs (Fig. 2A) and for different duty cycles (Fig. 2B), whereas post-stimulation dilation was significantly modulated. Interestingly, initial vasoconstriction was abolished by a high dose of isoflurane, but the post-stimulus dilation was still preserved (Fig. 2C). This indicates that post-stimulus dilation may be closely dependent on the deposited laser power.
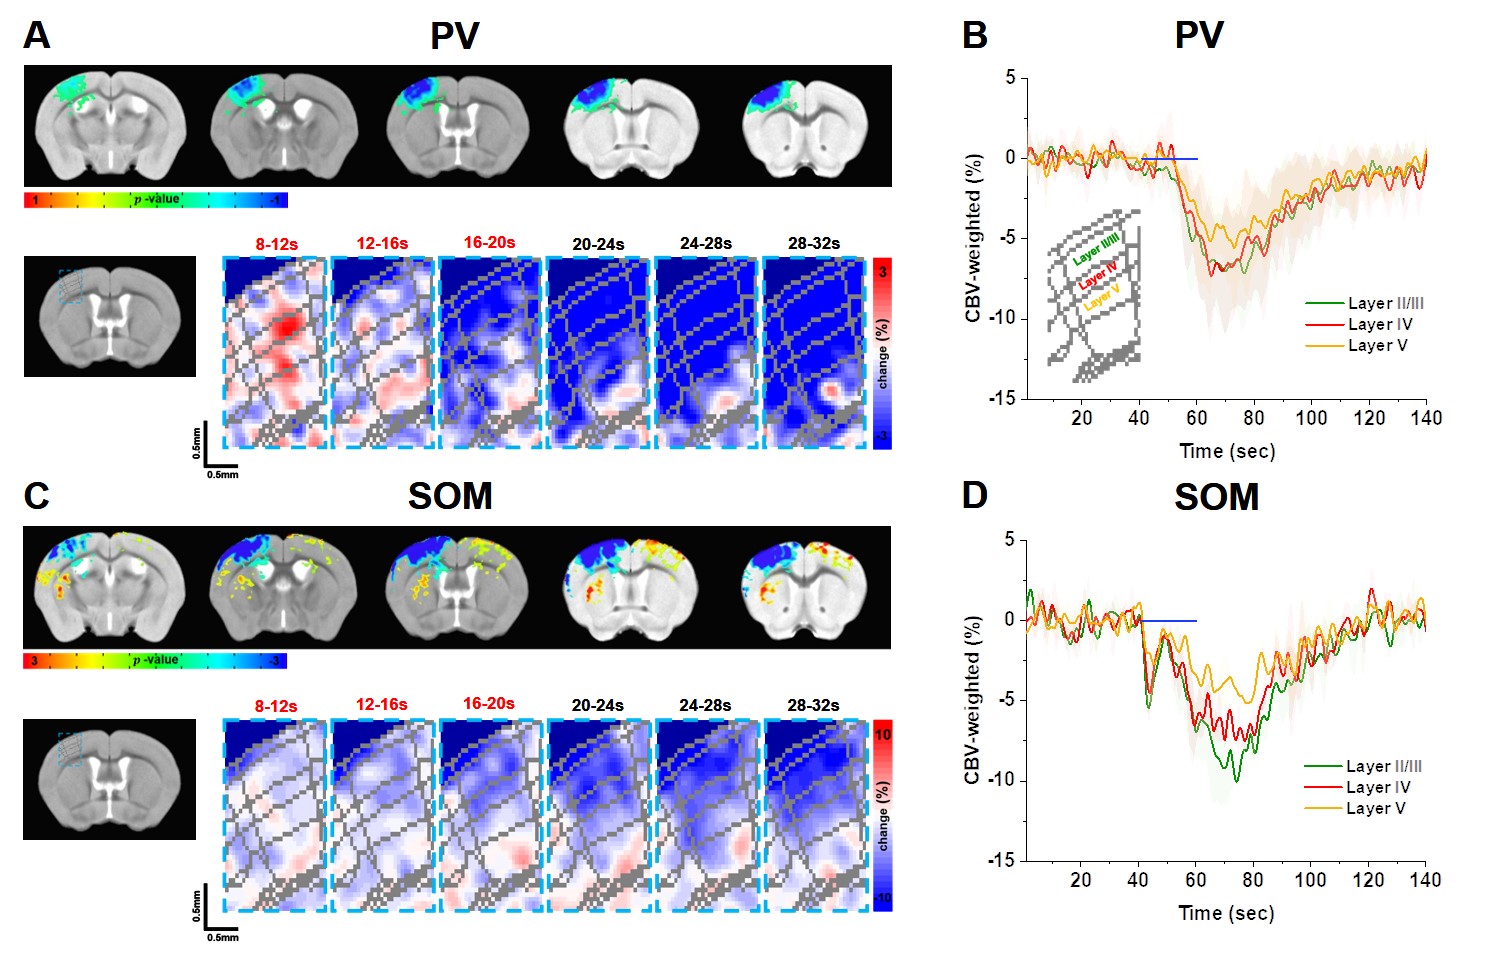
Then we examined whether laminar-dependent CBV response was observed. In CBV-weighted fMRI, a negative response indicates CBV increase. In PV CBV-fMRI data, we observed fast vasoconstriction at the middle layer (red pixel), followed by propagation of vessel dilation from the superficial layer to the deeper layer (Fig. 3A-B). On the other hand, SOM CBV-fMRI data showed dilation starting from the superficial layer, propagated to deeper layers (Fig. 3C-D). This indicates that activation of interneurons directly modulates non-specific arterial vessels.
DISCUSSION & CONCLUSION
In summary, our study indicates that activating PV and SOM interneurons strongly induces vascular responses. The vascular responses to inhibitory neuronal activity can be originated from increased inhibitory neuronal activity, modified excitatory neuronal activity and glial responses. To further investigate this important source issue, we plan to measure depth-dependent electrophysiology for determining excitatory and inhibitory activities, and glial calcium imaging. Further, fMRI responses to PV and SOM stimulation were also observed at projection sites (red/yellow color in SOM, Fig. 3C). The relationship of responses between stimulation site and projection regions will provide further insights whether neural activity in the stimulating site originates from excitatory projection neurons. The post-stimulus dilation observed on the PV and SOM-ChR2 mouse does not require metabolic loads, but is sensitive to laser power deposits. This may indicate heat-induced vasodilation, which needs further investigations.Acknowledgements
This research was supported by the Institute of Basic Science (IBS-R015-D1).References
1. Moon, H.S. et al. Contribution of Excitatory and Inhibitory Neuronal Activity to BOLD fMRI. Cereb Cortex. 2021;31:4053-4067.
2. Krawchuk, M.B., Ruff, C.F., Yang, X., Ross, S.E. & Vazquez, A.L. Optogenetic assessment of VIP, PV, SOM and NOS inhibitory neuron activity and cerebral blood flow regulation in mouse somato-sensory cortex. J Cereb Blood Flow Metab. 2020;40:1427-1440.
3. Dahlqvist, M.K., Thomsen, K.J., Postnov, D.D. & Lauritzen, M.J. Modification of oxygen consumption and blood flow in mouse somatosensory cortex by cell-type-specific neuronal activity. J Cereb Blood Flow Metab. 2020;40:2010-2025.
4. Lee, J. et al. Opposed hemodynamic responses following increased excitation and parvalbumin-based inhibition. J Cereb Blood Flow Metab. 2021;41:841-856.
5. Lee, L. et al. Key Aspects of Neurovascular Control Mediated by Specific Populations of Inhibitory Cortical Interneurons. Cereb Cortex. 2020;30:2452-2464.
Figures