1741
Metabolic Changes Immediately Following Sequential Motor Learning: an MRS-fMRI Study
Yasmin Geiger1, Tali Weiss2, Osnat Volovick1, Inbar Aharon1, Rinatia Maaravi-Hesseg3, and Avi Karni3
1Weizmann Institute of Science, Rehovot, Israel, 2Weizmann institute of Science, Rehovot, Israel, 3University of Hifa, Hifa, Israel
1Weizmann Institute of Science, Rehovot, Israel, 2Weizmann institute of Science, Rehovot, Israel, 3University of Hifa, Hifa, Israel
Synopsis
Sequential finger tapping (SFT) is a model for motor learning. The initial phase of SFT manifests in changes to behavior, neuronal activation (BOLD) and metabolic concentrations. The metabolic changes and correlations to BOLD and behavioral changes during SFT are still poorly understood. Here we analyze these bilateral changes at the motor cortex using BOLD‑fMRI and 1H-MRS. We show a significant hemispheric‑dependent correlation between changes in GABA+ and behavior, which do not correlate with the BOLD signal. Additionally, GABA+ basal levels differ between hemispheres.
Introduction
Sequential finger tapping (SFT) is the learning of ordered movement of the fingers [1]. The initial motoric learning, also termed fast-learning, is characterized by significant improvements to performance, and reduction in errors and reaction time [3]. Previous 1H-MRS studies found correlations between fast motor learning and changes in GABA concentration decreases in the primary (M1) and supplementary (SMA) motor areas [4-7]. fMRI studies showed that M1 is highly active during motor learning [8-10]. To date no study examined the correlation of metabolic and functional activation changes after fast SFT learning. In this study we present for the first time, a unified study of fast SFT learning in adults. This study explore the metabolic changes in both hemispheres and their correlation to behavioral, and functional, learning induced changes.Methods
Cohort: 36 healthy adults (F, aged 25± 3.3, mean ± standard deviation) with no motor disability gave informed consent. All preformed SFT of 5 elements sequence. Learning was divided into three parts: PreTest (3 min), Practice (6 min) and Test (3 min) (Figure 1).MRI and MRS: Scans were carried out on Siemens 3-T Tim Trio (Siemens-Healthineers, Erlangen, Germany) using 32-channel coil. Structural images were acquired using sagittal magnetization prepared rapid gradient echo (MPRAGE) sequence. 1H‑MRS spectra were acquired from a 18.75 mL voxel at the MC contra or ipsilateral to the preforming hand using MEGAPRESS [11, 12], with TR/TE = 3000/68 ms and 14 ms sinc-Gaussian editing pulses applied interleaved at 7.5 ppm and 1.9 ppm. 192 scans were acquired per voxel (TA=9:48 min/voxel) before learning and 768 scans (TA=38:25) minutes after learning. Post-learning scans were averaged to 4 time points. Whole brain BOLD-fMRI images were acquired using gradient echo-echo planar imaging (GRE-EPI), with TR/TE = 3000/30 ms, FOV = 1344×1344, slice thickness = 3 mm and TA=15 min. PreTest and Test fMRI scans included 60 TRs. Practice scan included 180 TRs.
Post-processing: Analysis was conducted within FSL (FMRIB's Software Library, http://www.fmrib.ox.ac.uk/fsl ), FEAT 6.0.1 (FMRI Expert Analysis Tool), and MATLAB R2019a (MathWorks, Inc.). The first 12 volumes of each functional run were discarded, to eliminate non-learning effect. Preprocessing steps included: high-pass temporal filtering, slice-timing, motion correction, spatial smoothing (FWHM 4mm) . Data was registered to a standard space image (MNI 152 T1 template). First-level general linear model included a single regressor (30 min) modeled by a stick function convoluted with double-Gamma hemodynamic response function. We applied the contrast PreTest>Test in bilateral postcentral gyri (Harvard-Oxford atlas) and MC (intersection between the finger tapping activation and the spectroscopic voxel. Four volunteers were excluded due to corrupt data. 1H-MRS Spectra, fitting and voxel placement are in Figure 2. GABA+ concentrations calculated using double-Gaussian fitting to the 3.0 ppm resonance in the MEGAPRESS difference spectra. Additional metabolic concentrations were derived from the un-edited MEGAPRESS, using LCModel v6.3 [13] with a simulated basis set containing 16 metabolites. Concentrations with CRLB<15% were discarded. Metabolic concentrations were corrected for partial volume effect [122, 123].
Results
Except one, all volunteers showed improvement (average 24.4%) at SFT learning. MRS Results: GABA+ changes before and in the first 10 min after learning is defined as ΔGABA+. Paired t-test of ∆GABA+ showed a significant 12.8%±18.5% (mean±SD) decrease in the contralateral MC (p=0.02), and a significant 10.1%±8.5% (mean±SD) increase in the ipsilateral MC (p=0.004) (figure 3). Both hemispheres showed a trend of return to basal levels after learning (figure 4). GABA+ before learning was different between hemisphere (p<0.0001). ΔGABA+ and behavioral improvement had significant negative correlation in the contralateral MC (R2=0.54, p=0.002) but not for ipsilateral-MC. fMRI results: BOLD signal significantly decrease in the left and right postcentral gyri in the post-scan comparing to the pre-scan (Z > 3.1, Cluster-corrected) (figure 6). A significant decrease in activation was observed for both ROI (p=4.3∙10-9, p=2.38∙10-8 respectively). No correlation was found between COPE values and changes in behavioral or metabolic parameters. No correlation was found between GABA+ levels and BOLD change within the MRS-ROI.Discussion and Conclusion
We examined learning related metabolic changes in both left and right sensorimotor area and demonstrated a reverse effect of GABA+ changes between hemispheres. We showed a significant hemispheric dependent correlation (R2=0.54, p=0.002) between ΔGABA+ and behavioral improvement in adults, following SFT learning. This suggests a direct link between the modulation of neurochemical processes and the learning process itself. Two previous studies [6] [7] looked at the correlation between changes of GABA in the MC and SFT learning. Both found a decrease in GABA+ as we report here. The difference in GABA+ between hemispheres may reflect long term effects of motor learning. BOLD changes in the left and right postcentral gyri, with no correlation between GABA+ and BOLD changes in the MRS-ROI is in agreement with previous finding [35].Acknowledgements
Assaf Tal acknowledges the support of the Israeli Science Foundation (personal grant 416/20), the Monroy‐Marks Career Development Fund, and the historic generosity of the Harold Perlman Family.References
- Ungerleider, L.G., J. Doyon, and A. Karni, Imaging brain plasticity during motor skill learning. Neurobiology of Learning and Memory, 2002. 78(3): p. 553-564.
- Hardwick, R.M., et al., A quantitative meta-analysis and review of motor learning in the human brain. Neuroimage, 2013. 67: p. 283-297.
- Floyer-Lea, A. and P.M. Matthews, Distinguishable brain activation networks for short- and long-term motor skill learning. J Neurophysiol, 2005. 94(1): p. 512-8.
- Kolasinski, J., et al., The dynamics of cortical GABA in human motor learning. J Physiol, 2019. 597(1): p. 271-282.
- Floyer-Lea, A., et al., Rapid modulation of GABA concentration in human sensorimotor cortex during motor learning. Journal of neurophysiology, 2006. 95(3): p. 1639-1644.
- King, B.R., et al., Baseline sensorimotor GABA levels shape neuroplastic processes induced by motor learning in older adults. Human brain mapping, 2020. 41(13): p. 3680-3695.
- Maruyama, S., et al., Sequential Finger-tapping Learning Mediated by the Primary Motor Cortex and Fronto-parietal Network: A Combined MRI-MRS Study. 2021.
- Rioult-Pedotti, M.-S., D. Friedman, and J.P. Donoghue, Learning-induced LTP in neocortex. Science, 2000. 290(5491): p. 533-536.
- Karni, A., et al., The acquisition of skilled motor performance: fast and slow experience-driven changes in primary motor cortex. Proceedings of the National Academy of Sciences, 1998. 95(3): p. 861-868.
- Klintsova, A.Y. and W.T. Greenough, Synaptic plasticity in cortical systems. Current opinion in neurobiology, 1999. 9(2): p. 203-208.
- Tremblay, S., et al., The Use of Magnetic Resonance Spectroscopy as a Tool for the Measurement of Bi-hemispheric Transcranial Electric Stimulation Effects on Primary Motor Cortex Metabolism. Jove-Journal of Visualized Experiments, 2014(93).
- Marjanska, M., et al., Brain dynamic neurochemical changes in dystonic patients: a magnetic resonance spectroscopy study. Mov Disord, 2013. 28(2): p. 201-9.
Figures
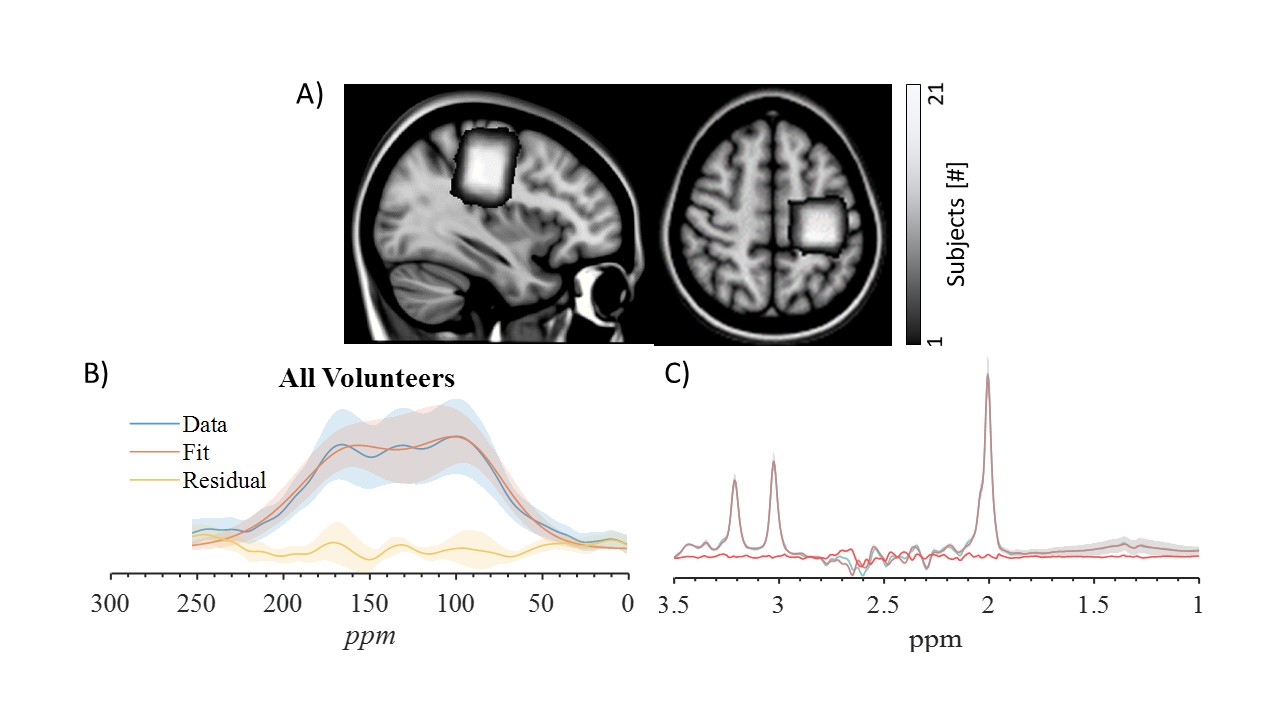
Figure 1. a) Voxel-overlap map of the contra-MC
spectroscopic voxel taken from all right-handed volunteers and transformed to common space
(MNI154). Averaged and SD of the measured spectra (blue), fitting (red) and
the residual from their subtracting (yellow) for the (b) difference spectra and (c) un-edited spectra, taken over all
volunteers and hemispheres.
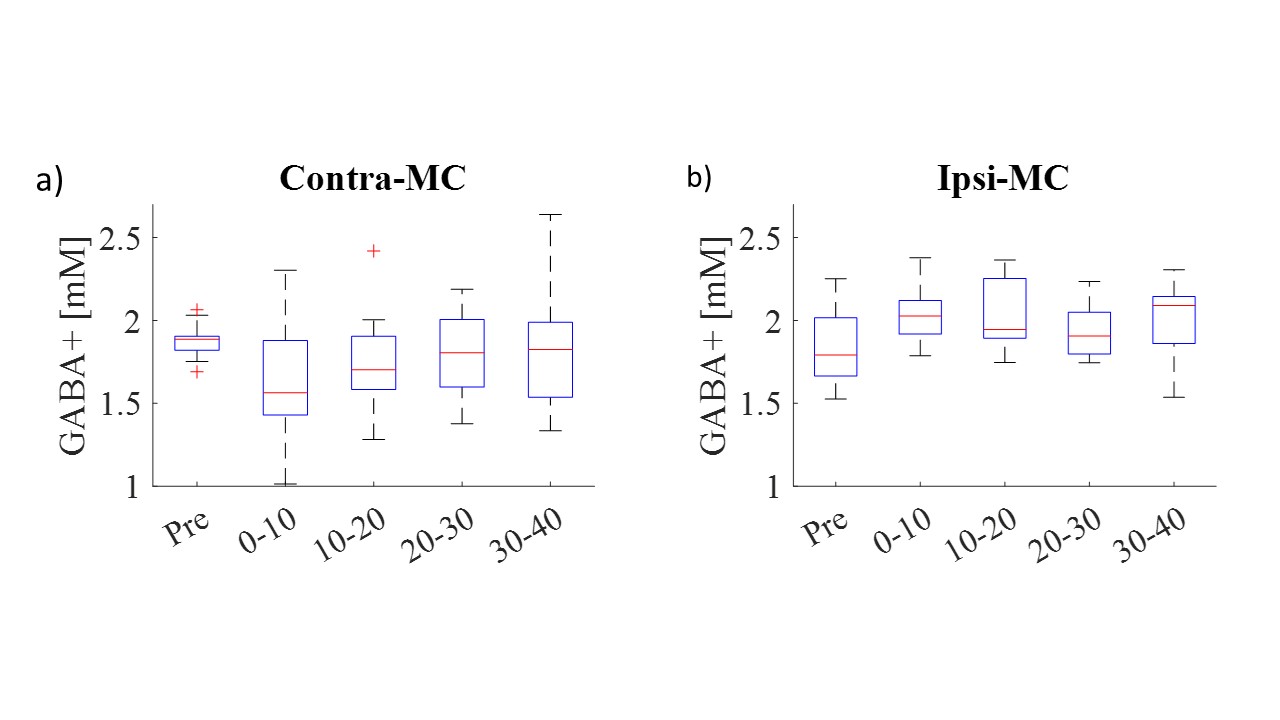
Figure 2. Box plots of GABA+ concentration as a function of time: before learning (‘Pre’) and averaged to 4 time
points after learning. Each point is the concentration extracted from 96
averages and error bars are the standard deviation. Changes between
‘Pre’ and the first 10 min immediately after learning were significant in both
MC (p<0.01, p<0.005 for Contra-MC and Ipsi-MC respectively). Both changes
showed a partial return to the ‘Pre’ values.
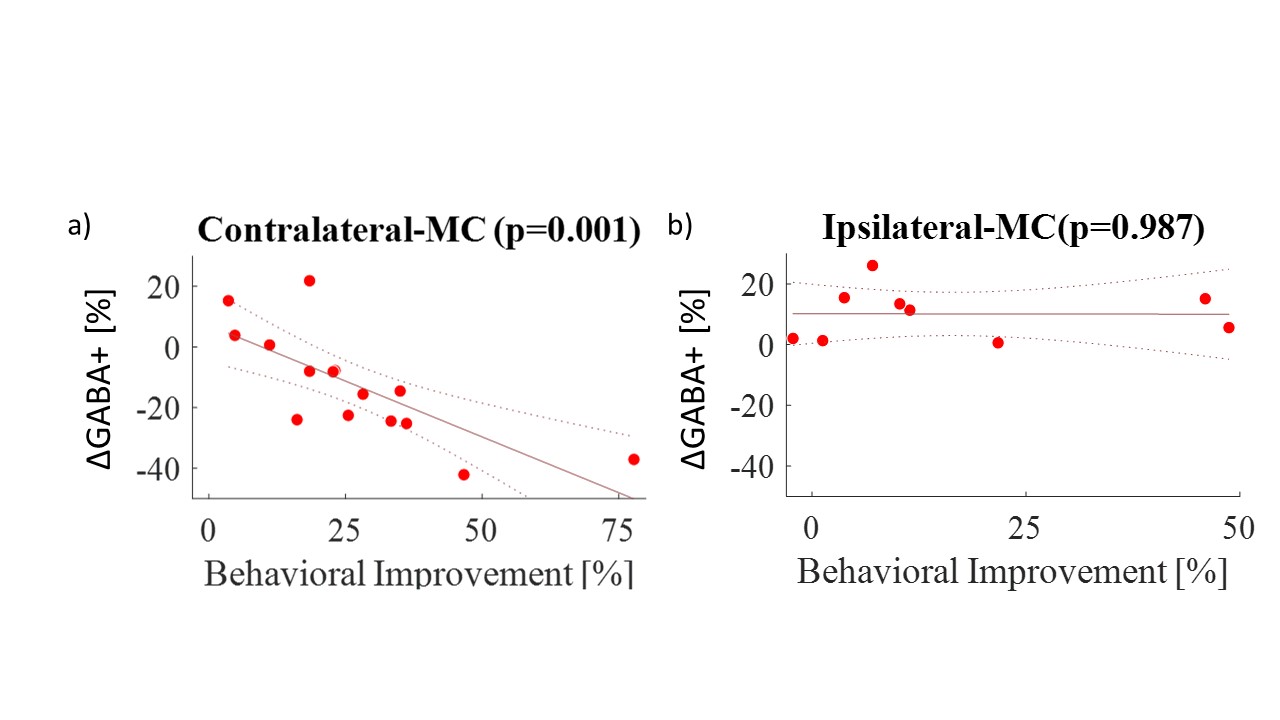
Figure 3.
Correlation between ∆GABA+ (percent change immediately after learning) and
behavioral improvement in (a) contralateral MC (motor cortex) and (b) ipsilateral
MC. A positive correlation was found in the contralateral MC (R2 =
0.52, p=0.002) but not for ipsilateral MC.
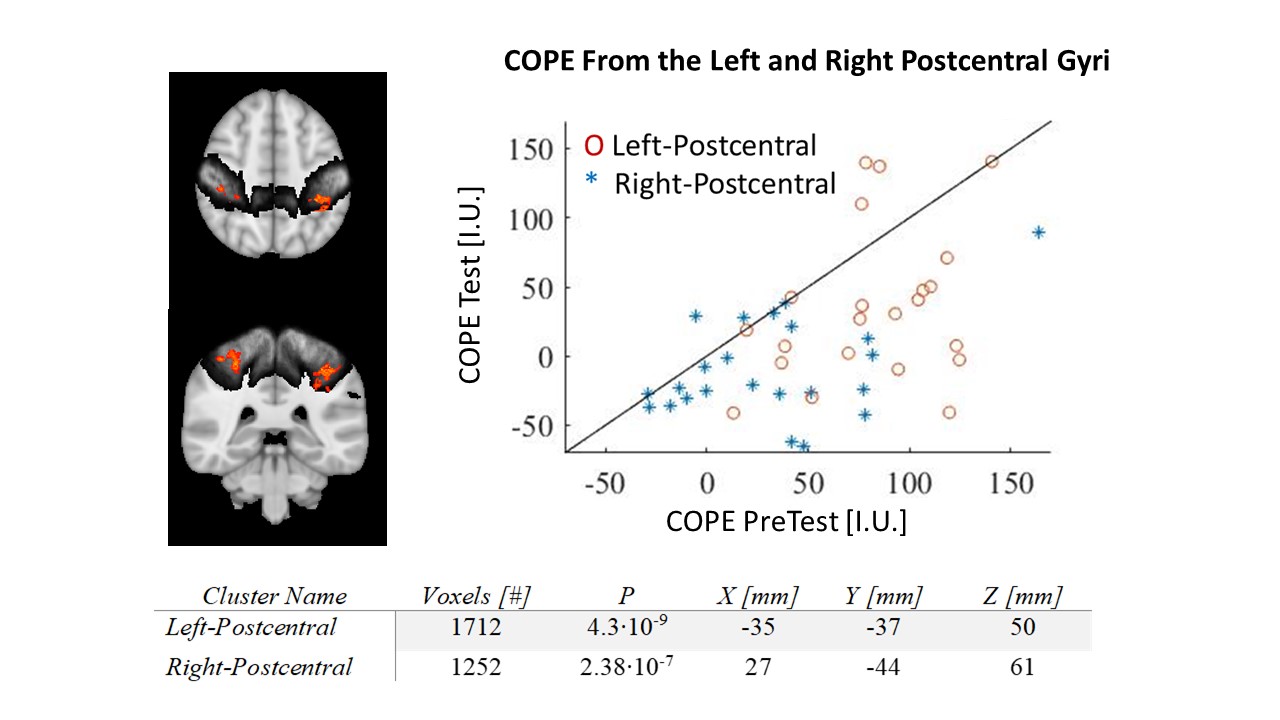
Figure 4. Functional changes in SFT
learning. a) contrast map of PreTest>Test activation (red) at group level
with small-volume-correction using Harvard-Oxford atlas for right and left
postcentral gyrus (dark gray) showed significant changes after 15 min of
learning. b) Decrease in activation is seen clearly from the COPE values at the
PreTest Vs. Test blocks. Values from the left (contralateral) postcentral ROI
are shown. c) Coordinates in MNI space and statistics of the two main clusters
identified.
DOI: https://doi.org/10.58530/2022/1741