1739
Regional variation in the linear relationship between breath-hold cerebrovascular reactivity and BOLD fMRI activation1Department of Radiology, University of Calgary, Calgary, AB, Canada, 2Hotchkiss Brain Institute, University of Calgary, Calgary, AB, Canada, 3Departments of Electrical & Software Engineering, and Biomedical Engineering, Schulich School of Engineering, University of Calgary, Calgary, AB, Canada
Synopsis
Cerebrovascular reactivity (CVR) and task-based BOLD fMRI signals are closely linked. Understanding whether the relationship between CVR and task-based BOLD responses varies across the brain is important for interpreting BOLD, particularly in studies of aging where both CVR and BOLD activation differences are observed. Therefore, this work aimed to investigate the linear relationship between breath-hold (BH) CVR and task-based BOLD across the cerebral cortex to different cognitive tasks. Significant linear relationships were observed in posterior regions independent of task, while anterior regions were task-specific. These findings might contribute to understanding age-related posterior-anterior BOLD activation differences commonly observed in fMRI studies.
Introduction
Understanding the physiological factors contributing to BOLD is key to accurate modelling and interpretation of fMRI activation. One contributing factor is cerebrovascular reactivity (CVR), defined as a vessel’s response to a vasoactive stimulus. CVR and task-based BOLD fMRI signals are closely linked1, and maps of CVR have been used to normalize BOLD activation maps to improve group comparisons2-5. CVR has previously shown to influence functional connectivity measures in motor and executive control networks6. Prior work has shown strong linear relationships between breath-hold (BH) BOLD responses (commonly used to measure CVR7) and task-based fMRI activation in younger adults8,9. Whether this is consistent across the entire cerebral cortex and with tasks assessing different cognitive domains remains unexplored. We aimed to investigate the linear relationship between BH-responses and BOLD activation across the cerebral cortex to different cognitive tasks. This was achieved using a dataset containing BH and cognitive task-based fMRI data from the UCLA Consortium for Neuropsychiatric Phenomics (CNP)10.Methods
ParticipantsHealthy control data from the UCLA-CNP database were analyzed in the present study. Participants were removed from the analysis if they did not have T1, BH and task BOLD fMRI data. 114 participants were included (54-F) with a mean age of 31.5 (±8.8) years.
MRI Data
Images were collected on a 3T Siemens Trio. Functional MRI data included a T2*-weighted EPI sequence (TR=2s, TE=30ms, 34 slices with 4mm thickness, matrix=64x64, FOV=192mm). A structural MPRAGE was also acquired (TR=1.9s, TE=2.26ms, matrix=256x256, FOV=250mm).
Task Descriptions
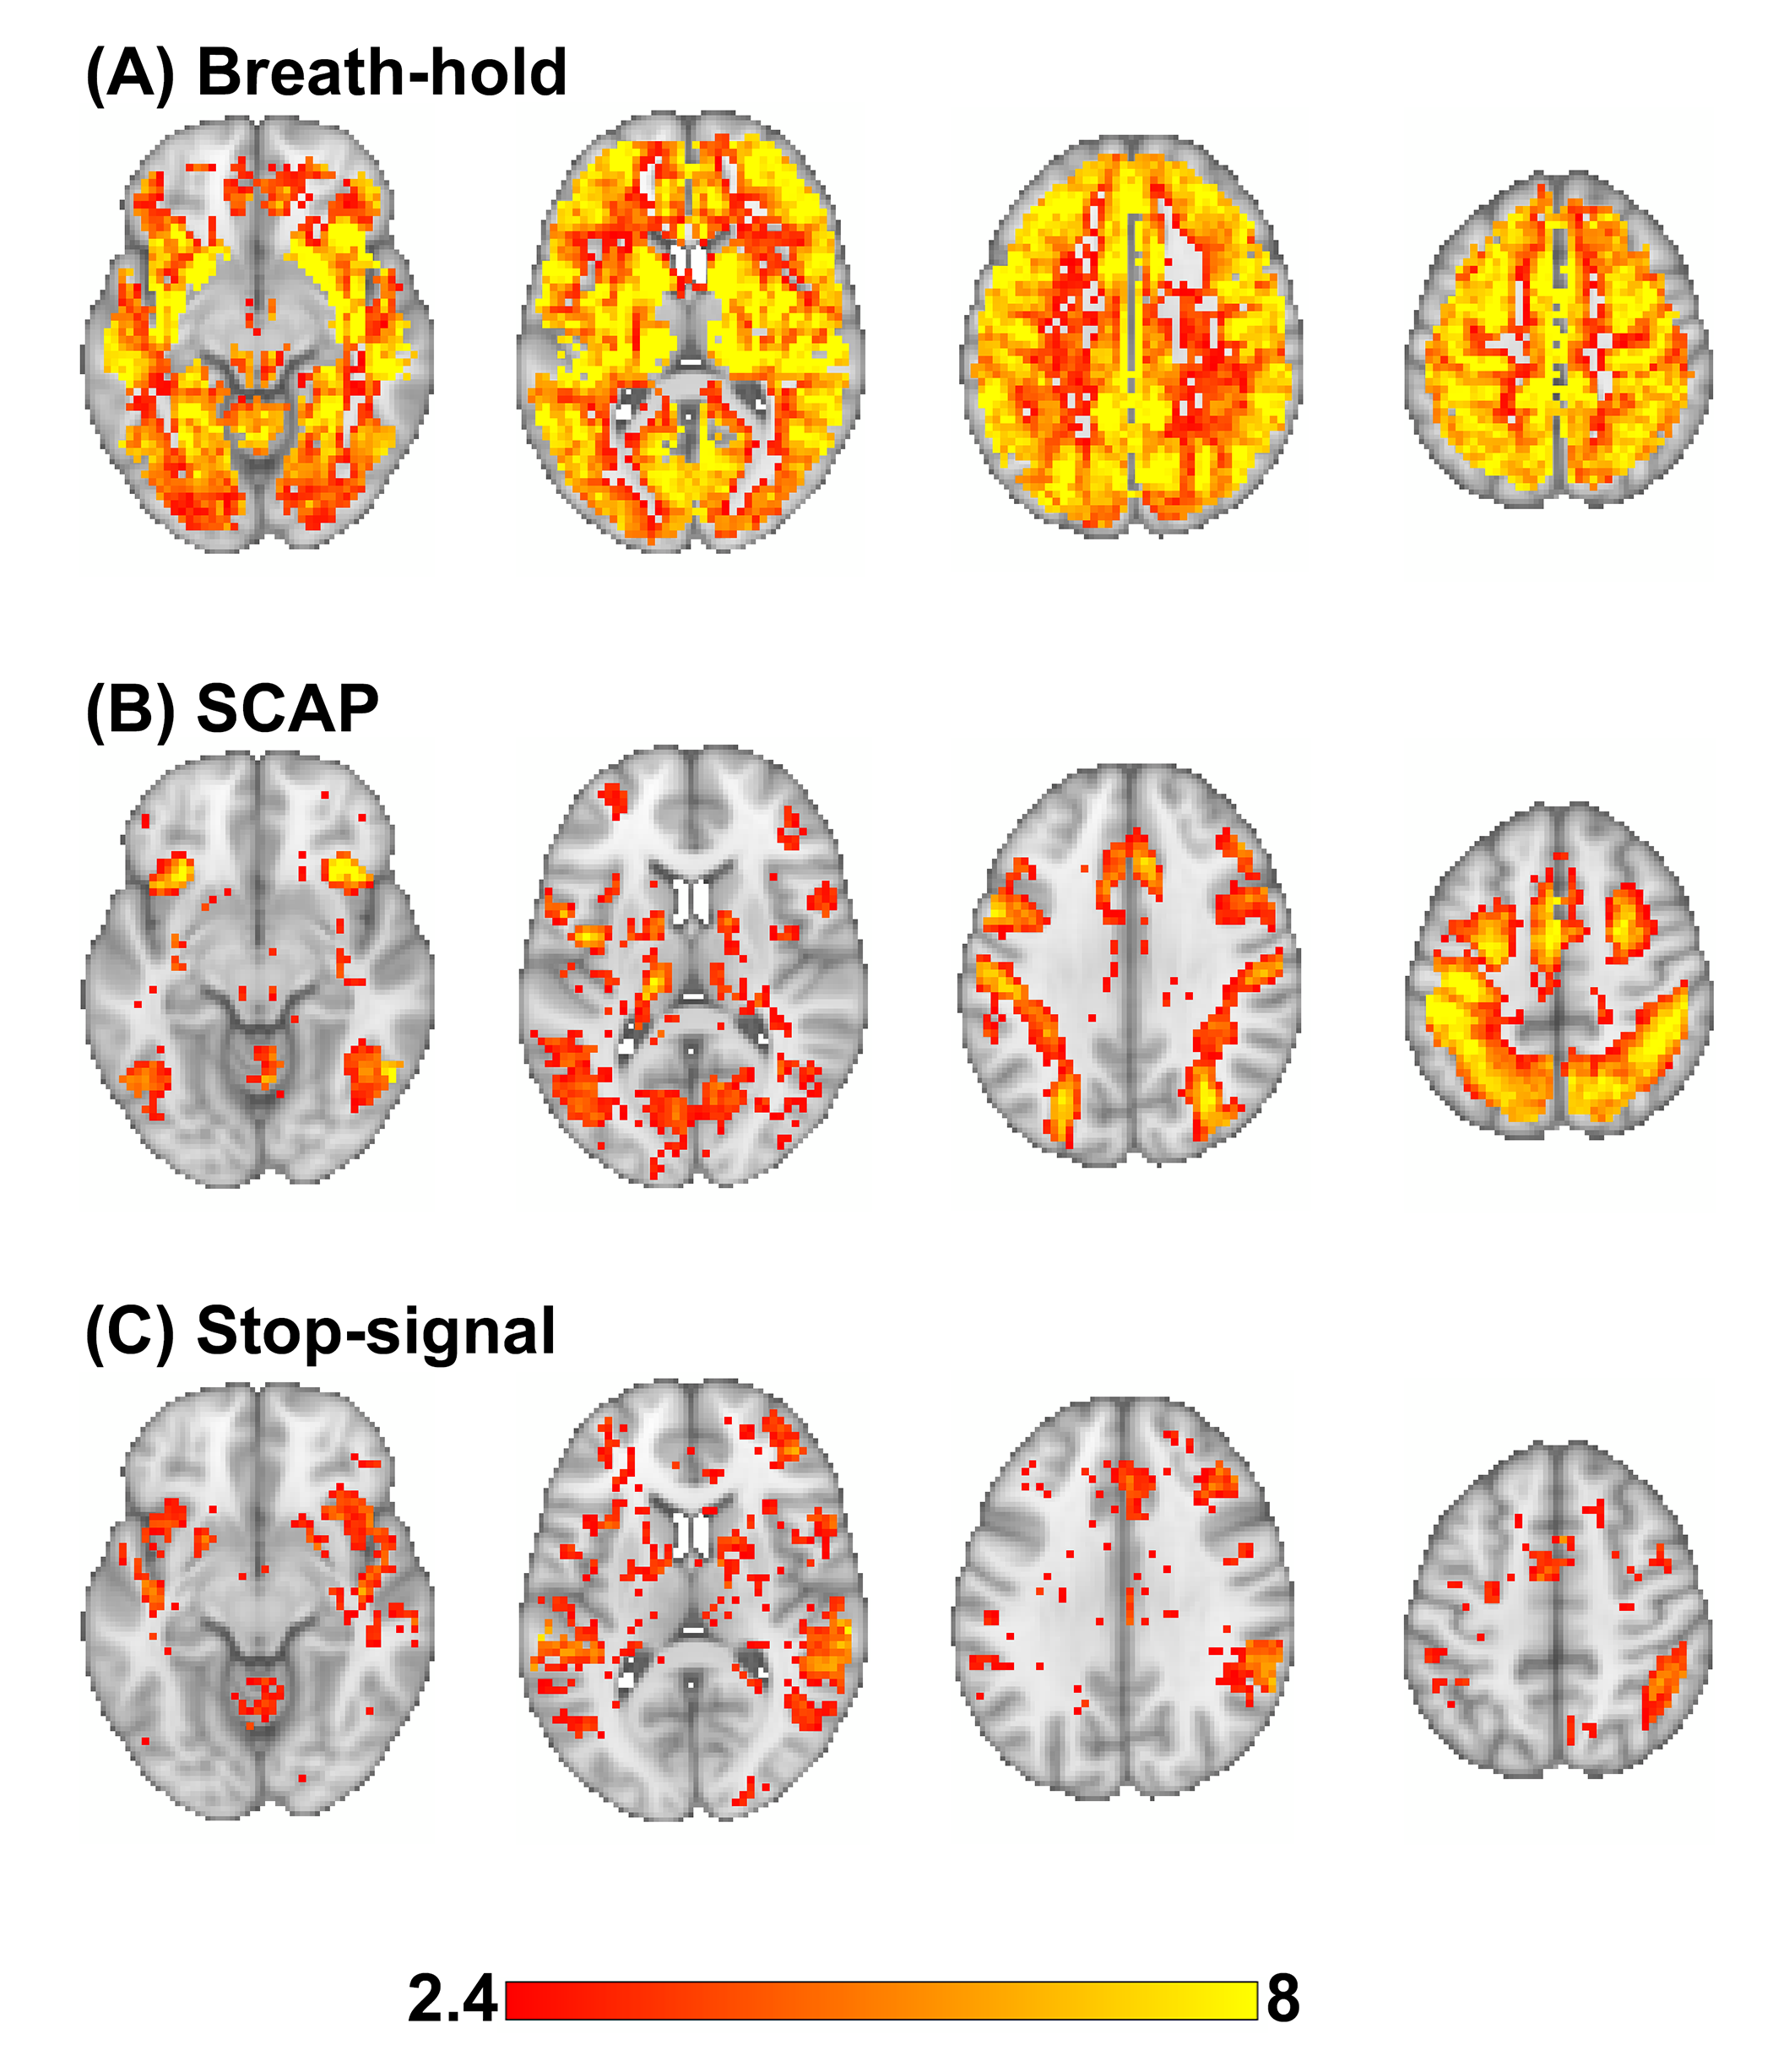
Participants completed 3 different tasks. BH involved 5x13.5s breath-hold epochs interleaved with 13.5s normal breathing. BH epochs were regulated using a visual stimulus. The first cognitive task was the spatial working memory capacity task (SCAP). This 4x3 design altered the number of stimuli displayed (1, 3, 5, or 7 dots) and the delay before presentation of target (1.5, 3, 4.5s). The second cognitive task was the stop-signal, a measure of response inhibition. There were 4 trial outcomes (successful go, successful stop, unsuccessful go, unsuccessful stop).
Data analysis: fMRI
fMRI data underwent slice-timing correction and motion correction (SPM12). Registration to each subject’s T1 and within-subject fMRI registrations were performed using Advanced Normalization Tools11,12. For the first-level analyses, BH data were modelled using a 13.5-second ramp regressor convolved with either the canonical hemodynamic response function (HRF) or the respiratory response function (RRF)13. A separate GLM was created for each response function (HRF or RRF), and temporal delays from 0 to 12 seconds (in steps of 2s), resulting in 14 BH models per participant. For each participant, the model with the largest number of significantly activated voxels was chosen for all further analyses. For 15 participants this was the HRF, and for 99 participants the RRF was the best fit. The median delay was 6-seconds. Motion parameters were included as regressors.
For the SCAP task, all 12 possible trial types were modelled. The contrast-of-interest was five circles at all delays, as this is a high-load condition without overloading short-term memory capacity14. The regressors for the stop-signal task included all four possible trial types and the contrast-of-interest was successful stop. Activation maps were P<0.05 FDR-corrected and converted to percent signal change (PSC).
Regions-of-interest (ROI) analyses
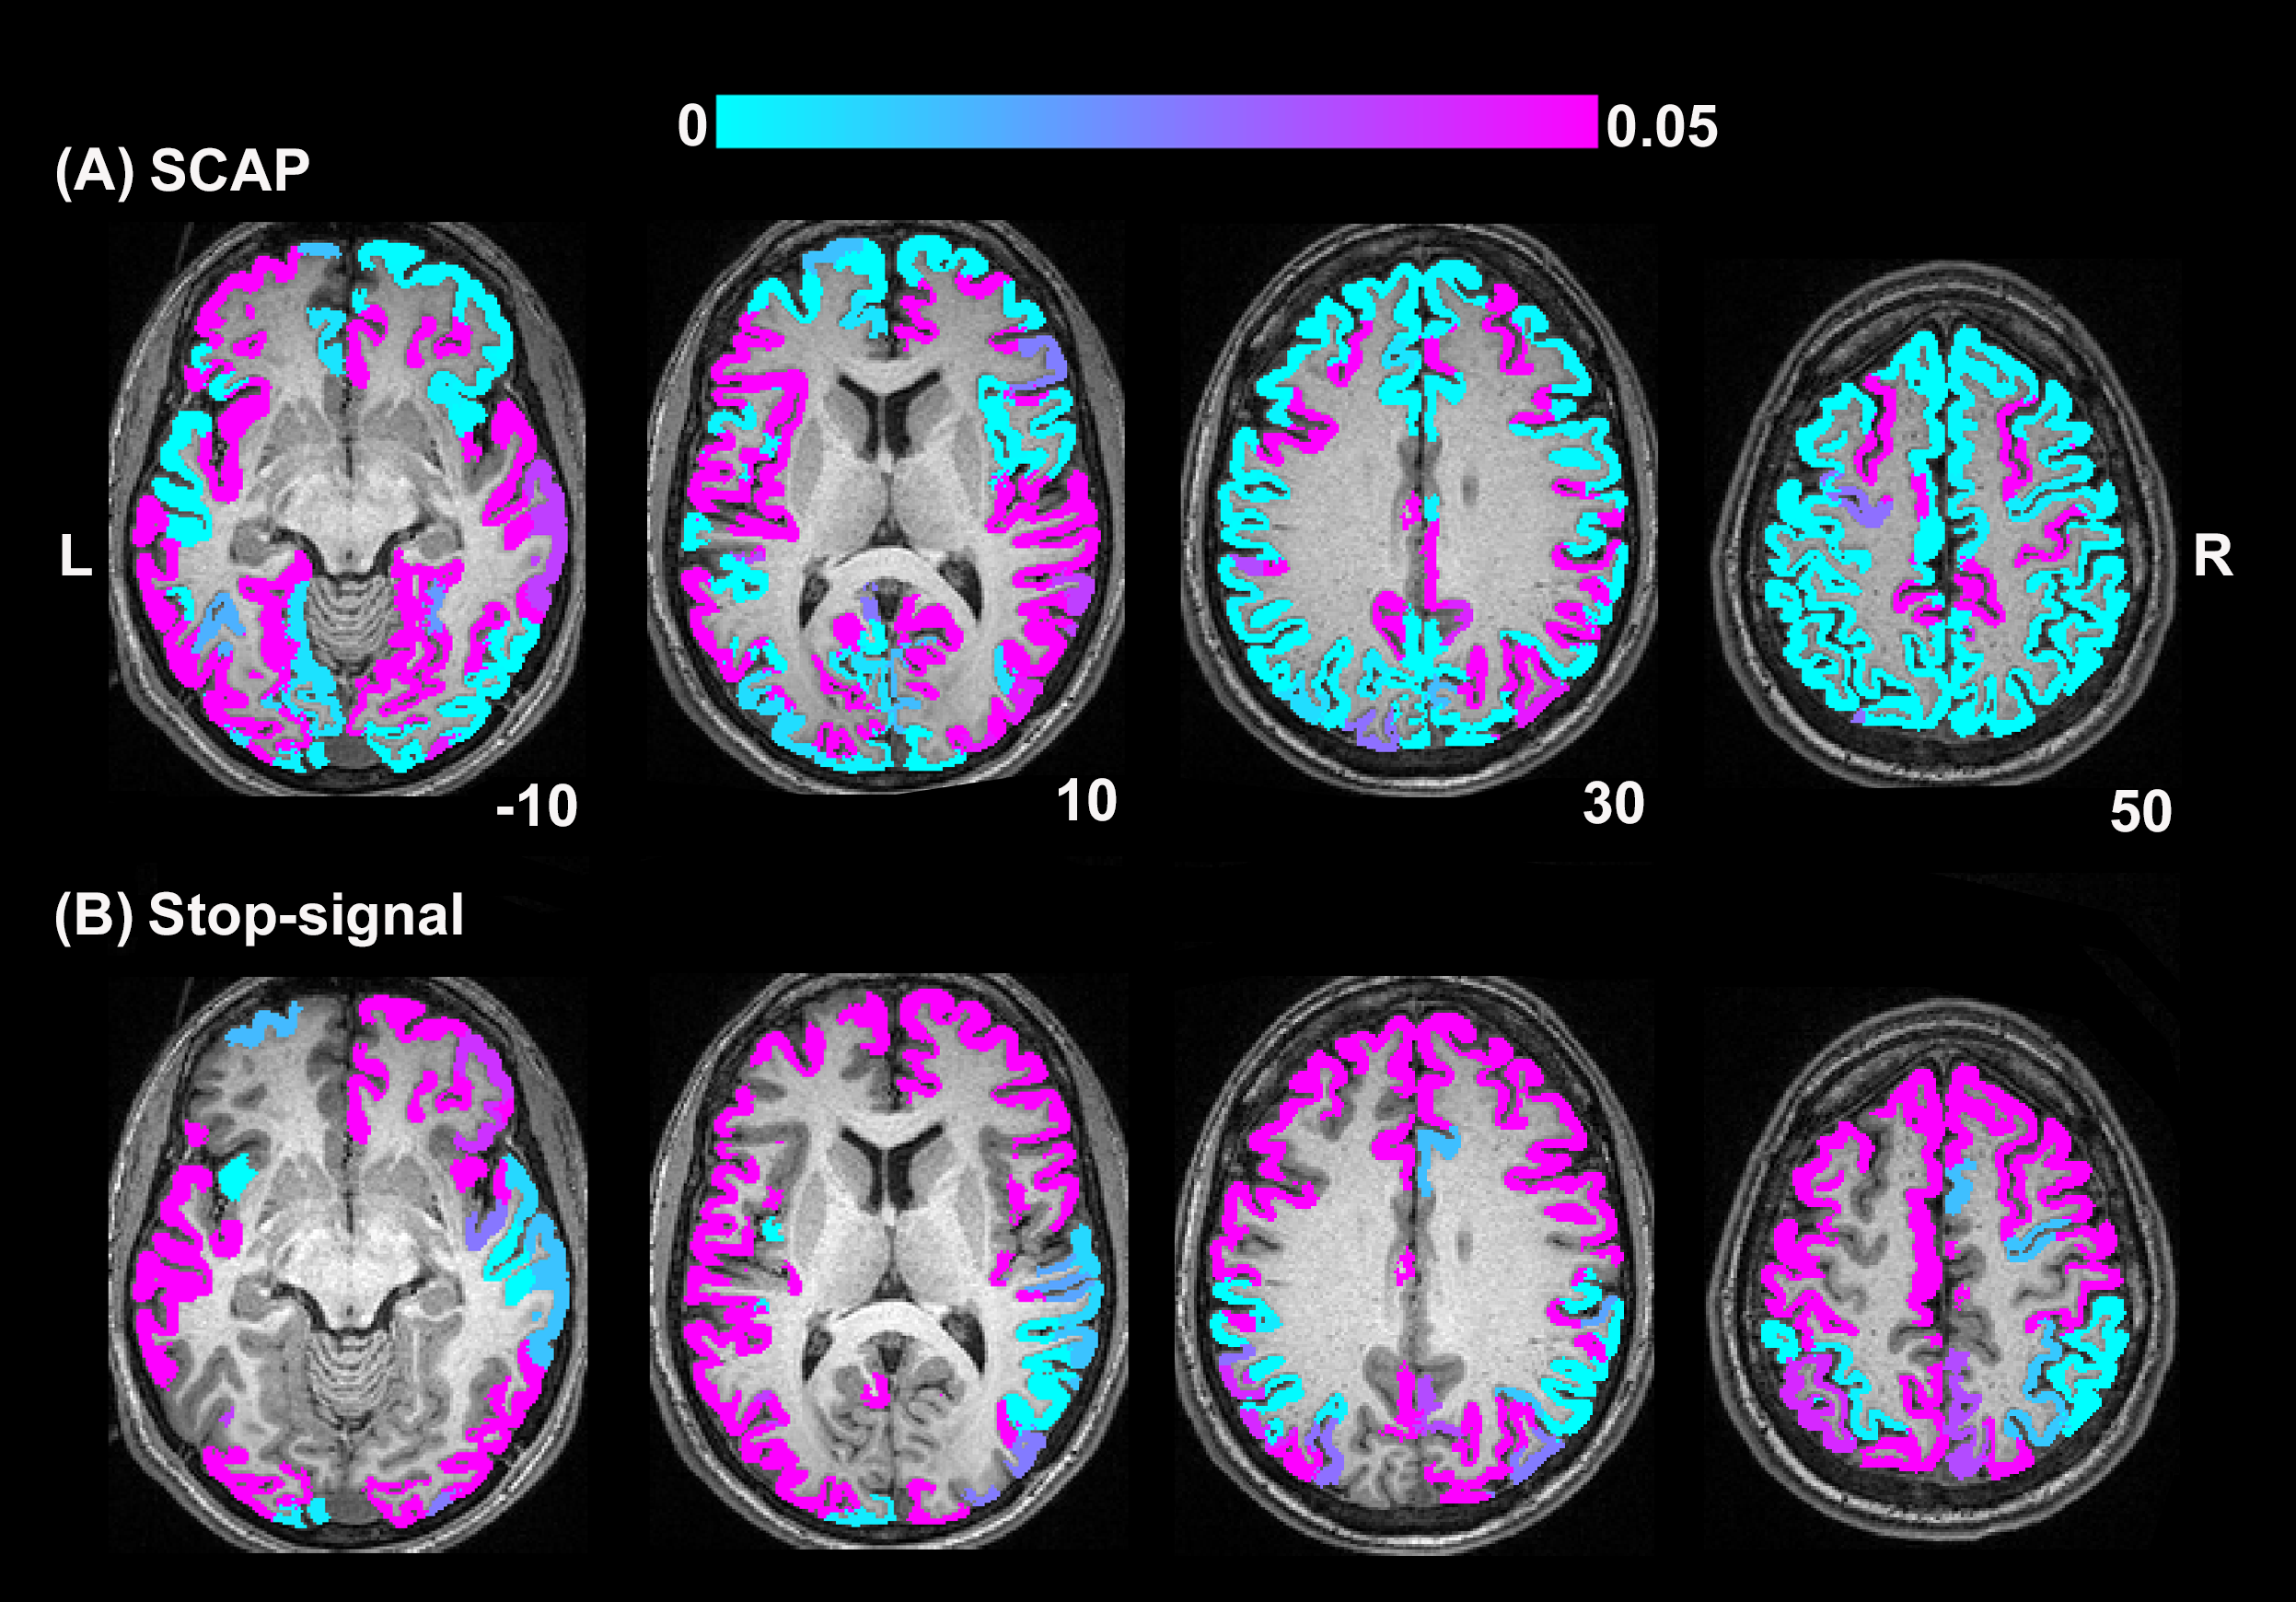
Each participant’s MPRAGE underwent cortical parcellation in FreeSurfer15 with automatic assignment of cortical regions determined by the Destrieux Atlas16. On a per-subject basis, each ROI was resampled to the resolution of the fMRIs. PSC was averaged for all voxels within each ROI with significant (P<0.05, FDR-corrected) BH and task (SCAP or stop-signal) activation. ROI-averaged values were entered into linear regression analyses using MATLAB. Separate models were fit for each ROI, and for both cognitive tasks with BH PSC as predictor variable.
Results
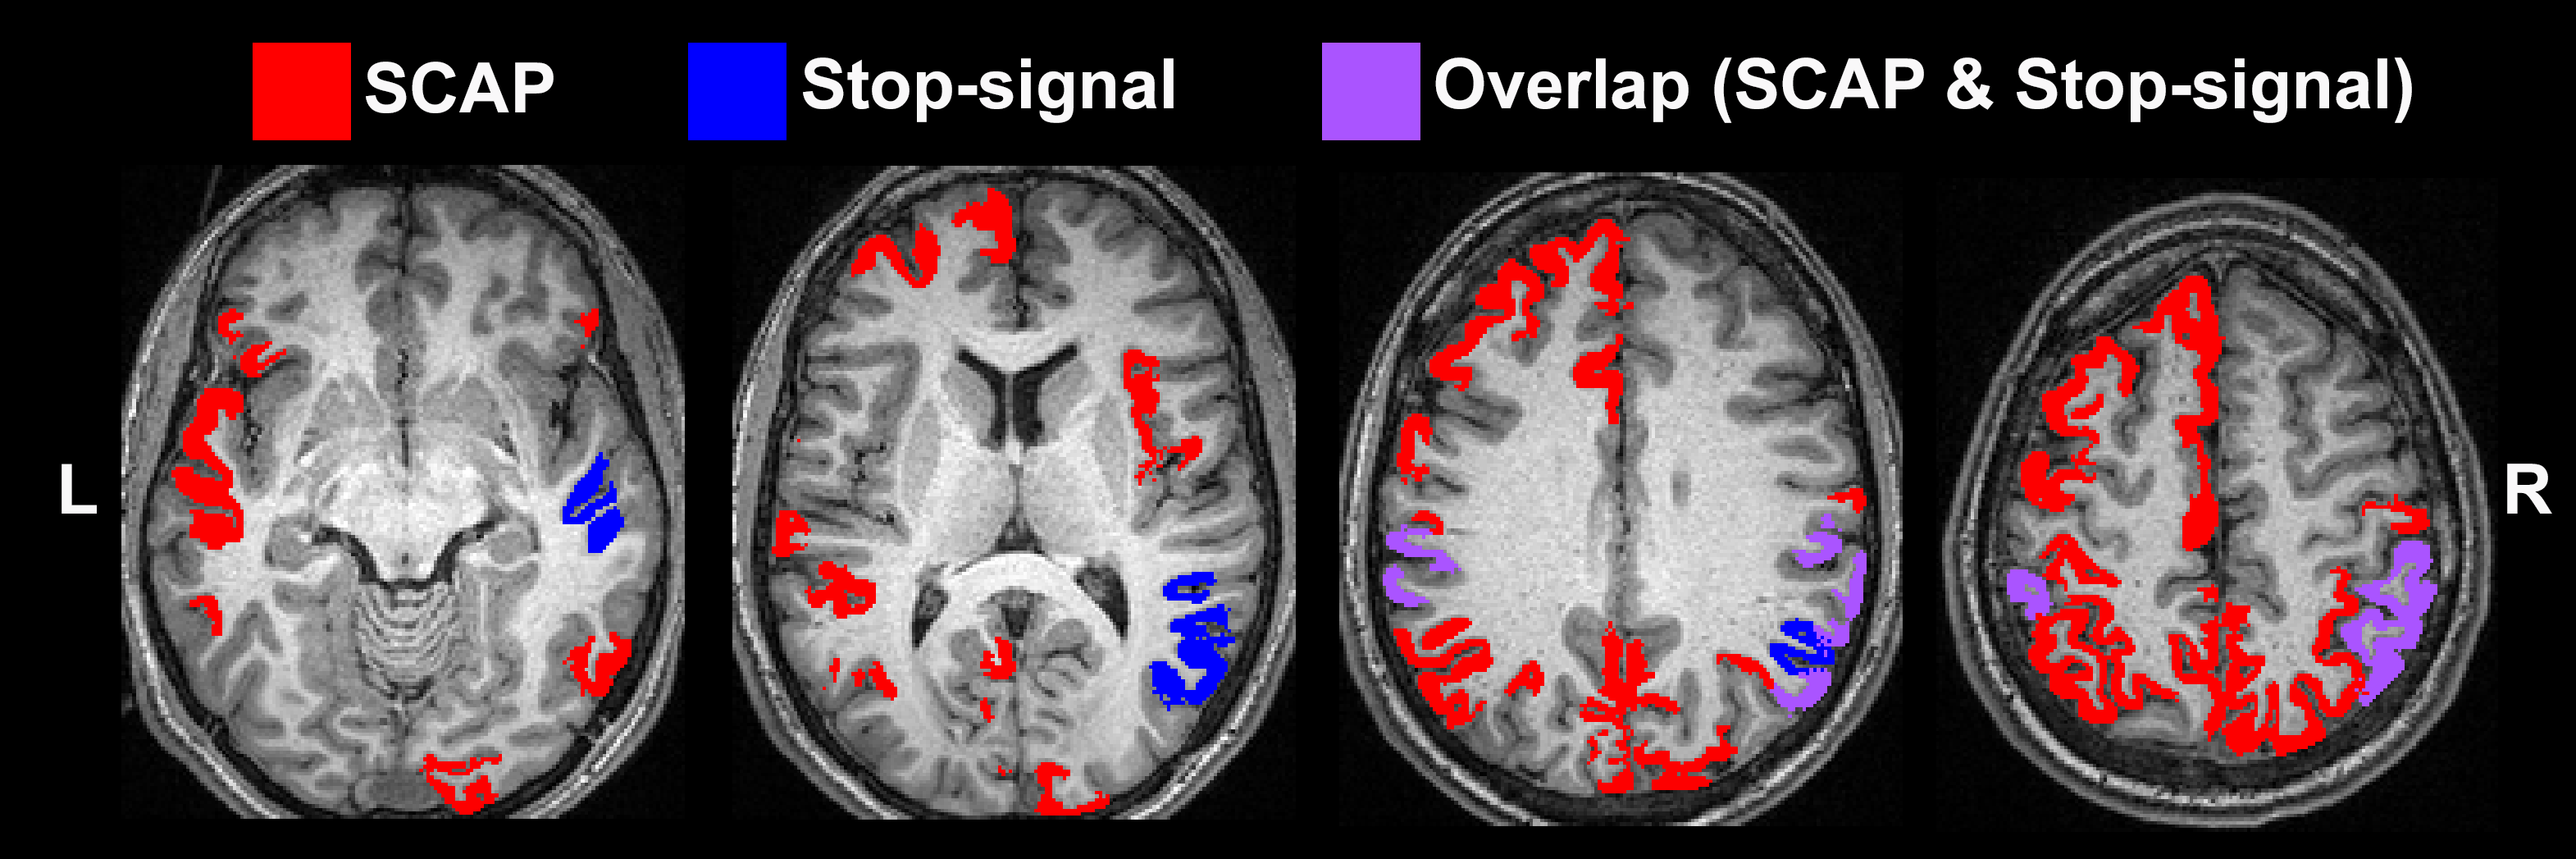
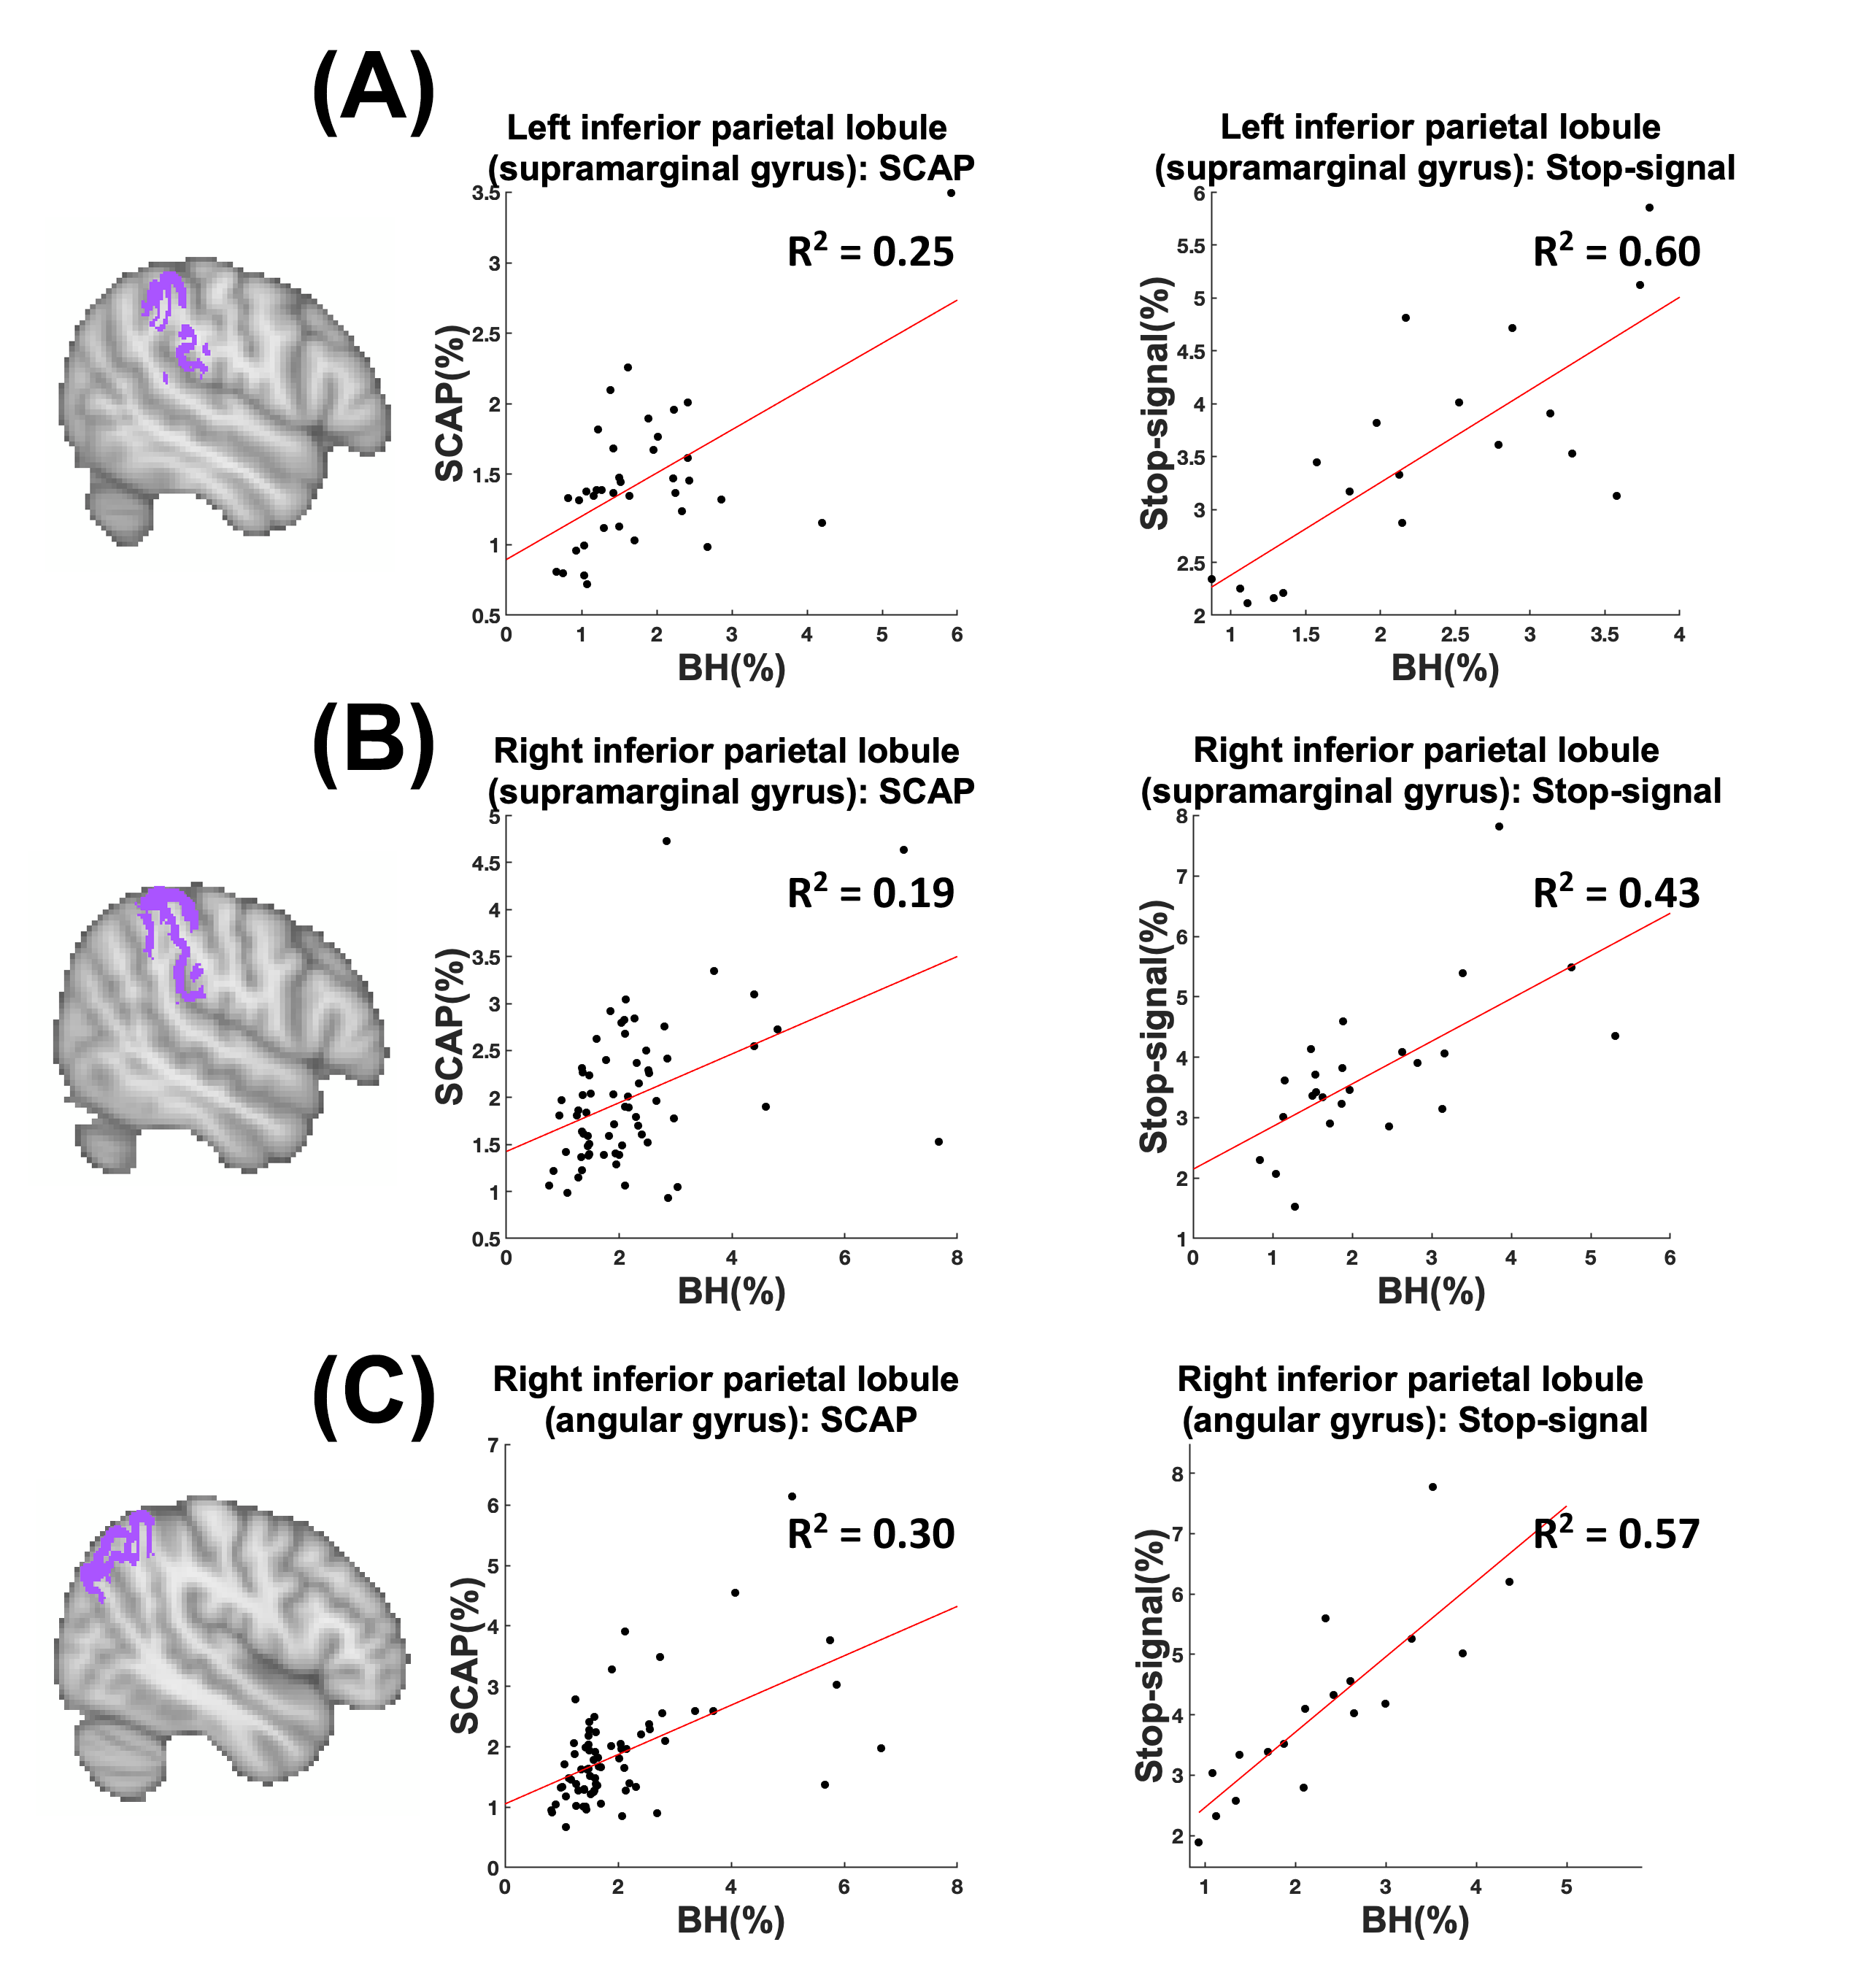
BH, SCAP and stop-signal tasks all produced robust responses across participants (Fig.1). Linear regression analyses between BH and task responses showed more significant ROIs for the SCAP compared to stop-signal (Fig.2). When considering only ROIs significant after Bonferroni-correction (for number of ROIs) (Fig.3), most of the significant ROIs in the stop-signal were also significant in the SCAP. These overlapping ROIs were located in the parietal regions (Fig.4).Discussion
In this large group of mainly young and healthy adults, significant linear relationships between BH-responses and cognitive fMRI were observed in the posterior cortex for two different cognitive tasks. One task (SCAP) showed more cortical regions, including significant ROIs anteriorly. This might suggest that anterior regions show a more task-dependent relationship with BH-responses, but lack of frontal activation to the stop-signal task also needs to be taken into consideration. Further work with tasks producing robust frontal activation is required. Posterior-anterior differences have been reported in fMRI studies of aging17; the present findings suggest that BOLD responses in parietal regions might be linked to CVR, which could explain some age-related differences.Acknowledgements
No acknowledgement found.References
1. Williams R, MacDonald M, Mazerolle E, Pike G. The Relationship Between Cognition and Cerebrovascular Reactivity: Implications for Task-Based fMRI. Frontiers in Physics 2021;9. DOI: 10.3389/fphy.2021.645249.
2. Bandettini PA, Wong EC. A hypercapnia-based normalization method for improved spatial localization of human brain activation with fMRI. NMR in biomedicine 1997;10(4-5):197-203. DOI: 10.1002/(SICI)1099-1492(199706/08)10:4/5<197::AID-NBM466>3.0.CO;2-S [pii].
3. Liu P, Hebrank AC, Rodrigue KM, et al. Age-related differences in memory-encoding fMRI responses after accounting for decline in vascular reactivity. NeuroImage 2013;78:415-425. DOI: 10.1016/j.neuroimage.2013.04.053 [doi].
4. Biswal BB, Kannurpatti SS, Rypma B. Hemodynamic scaling of fMRI-BOLD signal: validation of low-frequency spectral amplitude as a scalability factor. Magn Reson Imaging 2007;25(10):1358-69. DOI: 10.1016/j.mri.2007.03.022.
5. Liau J, Liu TT. Inter-subject variability in hypercapnic normalization of the BOLD fMRI response. Neuroimage 2009;45(2):420-30. DOI: 10.1016/j.neuroimage.2008.11.032.
6. Golestani AM, Kwinta JB, Strother SC, Khatamian YB, Chen JJ. The association between cerebrovascular reactivity and resting-state fMRI functional connectivity in healthy adults: The influence of basal carbon dioxide. Neuroimage 2016;132:301-313. DOI: 10.1016/j.neuroimage.2016.02.051.
7. Pinto J, Bright MG, Bulte DP, Figueiredo P. Cerebrovascular Reactivity Mapping Without Gas Challenges: A Methodological Guide. Front Physiol 2020;11:608475. DOI: 10.3389/fphys.2020.608475.
8. Kannurpatti SS, Motes MA, Biswal BB, Rypma B. Assessment of unconstrained cerebrovascular reactivity marker for large age-range FMRI studies. PLoS One 2014;9(2):e88751. DOI: 10.1371/journal.pone.0088751.
9. Kannurpatti SS, Motes MA, Rypma B, Biswal BB. Neural and vascular variability and the fMRI-BOLD response in normal aging. Magn Reson Imaging 2010;28(4):466-76. DOI: 10.1016/j.mri.2009.12.007.
10. Poldrack RA, Congdon E, Triplett W, et al. A phenome-wide examination of neural and cognitive function. Sci Data 2016;3:160110. DOI: 10.1038/sdata.2016.110.
11. Avants BB, Tustison NJ, Song G, Cook PA, Klein A, Gee JC. A reproducible evaluation of ANTs similarity metric performance in brain image registration. Neuroimage 2011;54(3):2033-44. DOI: 10.1016/j.neuroimage.2010.09.025.
12. Avants BB, Tustison NJ, Stauffer M, Song G, Wu B, Gee JC. The Insight ToolKit image registration framework. Front Neuroinform 2014;8:44. DOI: 10.3389/fninf.2014.00044.
13. Birn RM, Smith MA, Jones TB, Bandettini PA. The respiration response function: the temporal dynamics of fMRI signal fluctuations related to changes in respiration. Neuroimage 2008;40(2):644-654. DOI: 10.1016/j.neuroimage.2007.11.059.
14. Todd JJ, Marois R. Capacity limit of visual short-term memory in human posterior parietal cortex. Nature 2004;428(6984):751-4. DOI: 10.1038/nature02466.
15. Fischl B, van der Kouwe A, Destrieux C, et al. Automatically parcellating the human cerebral cortex. Cereb Cortex 2004;14(1):11-22. DOI: 10.1093/cercor/bhg087.
16. Destrieux C, Fischl B, Dale A, Halgren E. Automatic parcellation of human cortical gyri and sulci using standard anatomical nomenclature. Neuroimage 2010;53(1):1-15. DOI: 10.1016/j.neuroimage.2010.06.010.
17. Zhang H, Lee A, Qiu A. A posterior-to-anterior shift of brain functional dynamics in aging. Brain Struct Funct 2017;222(8):3665-3676. DOI: 10.1007/s00429-017-1425-z.
Figures