1737
In vivo direct imaging of visually evoked neuronal responses at milliseconds temporal resolution1Department of Biomedical Engineering, Sungkyunkwan University, Suwon, Korea, Republic of, 2Department of Intelligent Precision Healthcare Convergence, Sungkyunkwan University, Suwon, Korea, Republic of, 3Korea Radioisotope Center for Pharmaceuticals, Korea Institute of Radiological & Medical Sciences, Seoul, Korea, Republic of
Synopsis
There has been a long-standing demand for high temporospatial resolution in non-invasive neuroimaging. Using our previously proposed approach for direct imaging of neuronal activity (DIANA-fMRI) with a high temporal resolution of milliseconds, we continued to demonstrate DIANA-fMRI performance in mice in vivo at 9.4T using visual stimulation. The DIANA signal change was significantly increased (~0.2-0.4%) in response to flashing light stimulus, and it was found that DIANA responses of sSC, V1, and V2 were sequentially activated in that order. The DIANA response times of sSC, V1, and V2 were consistent with previous electrophysiological studies.
Introduction
Electroencephalography (EEG), magnetoencephalography (MEG), and hemodynamic-based functional MRI are widely used to understand brain functional networks. However, they have limitations in either temporal or spatial resolution. Therefore, high spatial resolution MRI with millisecond temporal resolution as in EEG/MEG has been long desired. Recently, we proposed a novel approach for in vivo direct imaging of neuronal activity (DIANA-fMRI) at high temporal resolution (5ms)1–4 with convincing results for mouse whisker-pad stimulation validated by electrophysiology. To continue the progression of DIANA-fMRI in different stimulations, we here report the preliminary results of mouse DIANA-fMRI using visual stimulation at 9.4T.Methods
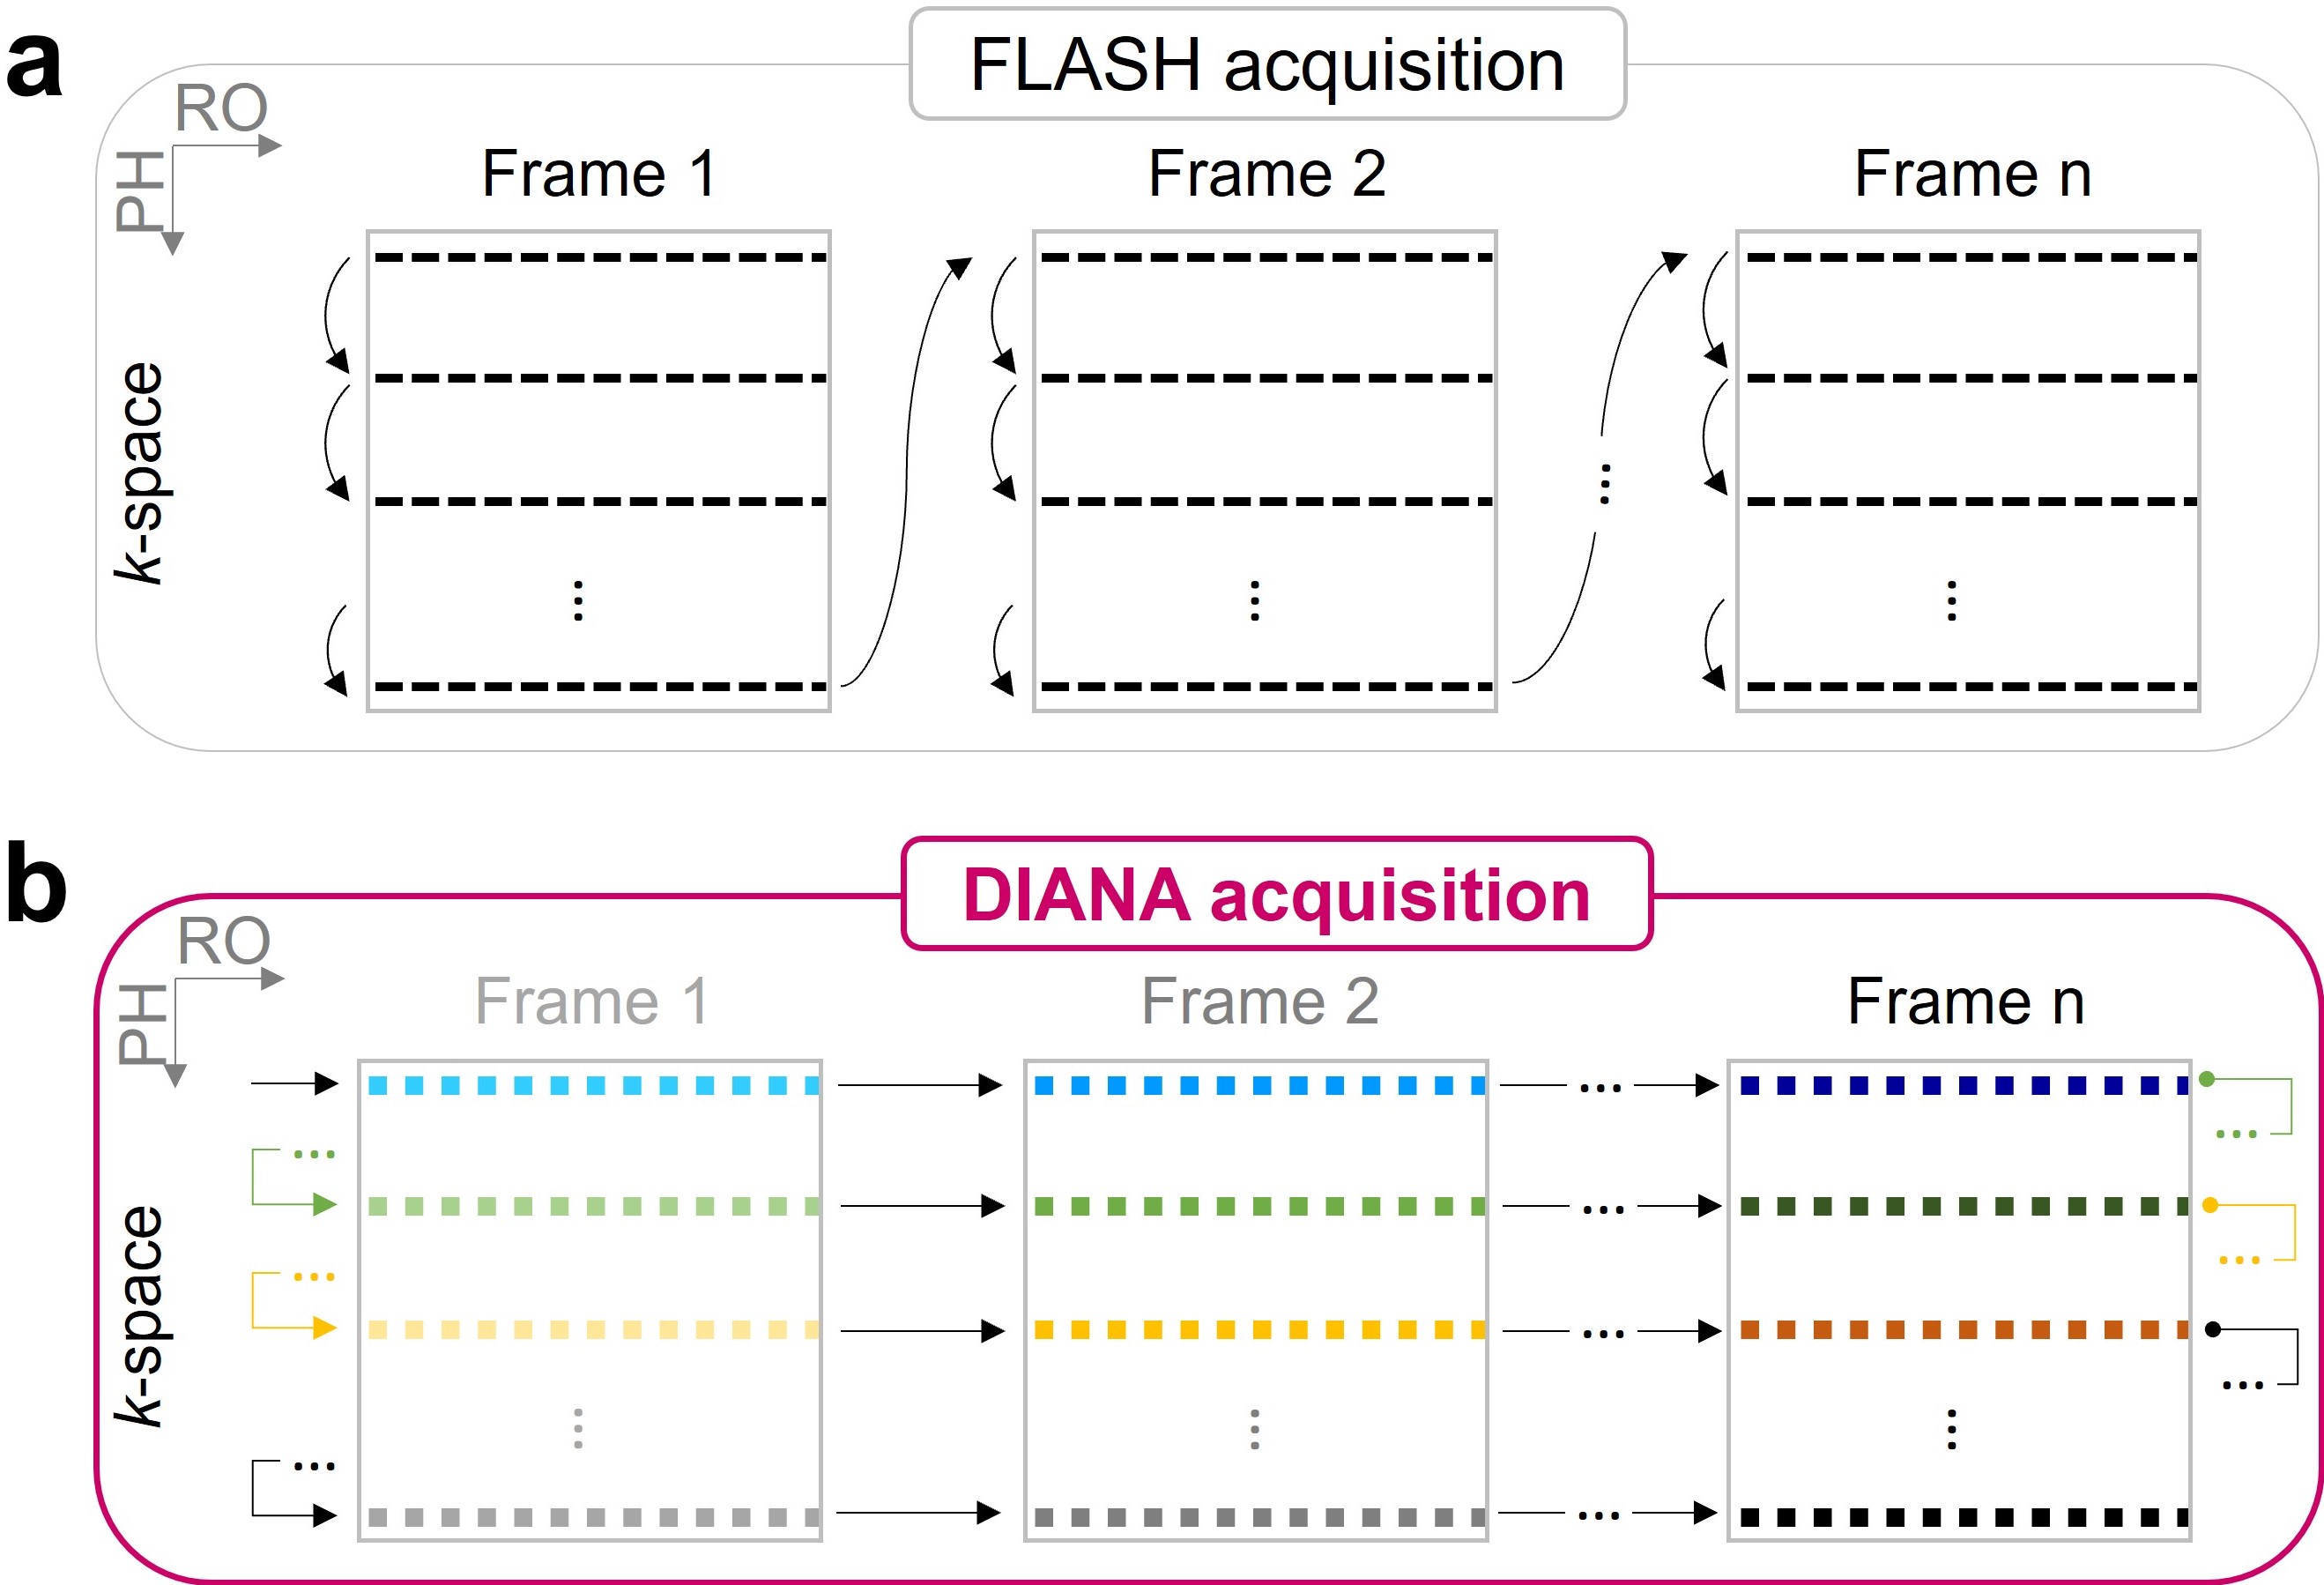
DIANA-fMRI acquisition:As previously suggested1–4, we hypothesize that high temporal resolution is pivotal in directly capturing fast, transient neuronal events in milliseconds. To implement this idea, we employed a 2D line-scan method5 based on a 2D fast low-angle shot (FLASH) sequence, achieving a 5ms temporal resolution (Fig.1).
DIANA-fMRI experiments:
In vivo mouse brain imaging was performed at 9.4T (Bruker, BioSpec 94/30). Adult C57BL/6 male mice were used under the approval of IACUC at Sungkyunkwan University and Korea Institute of Radiological & Medical Sciences.
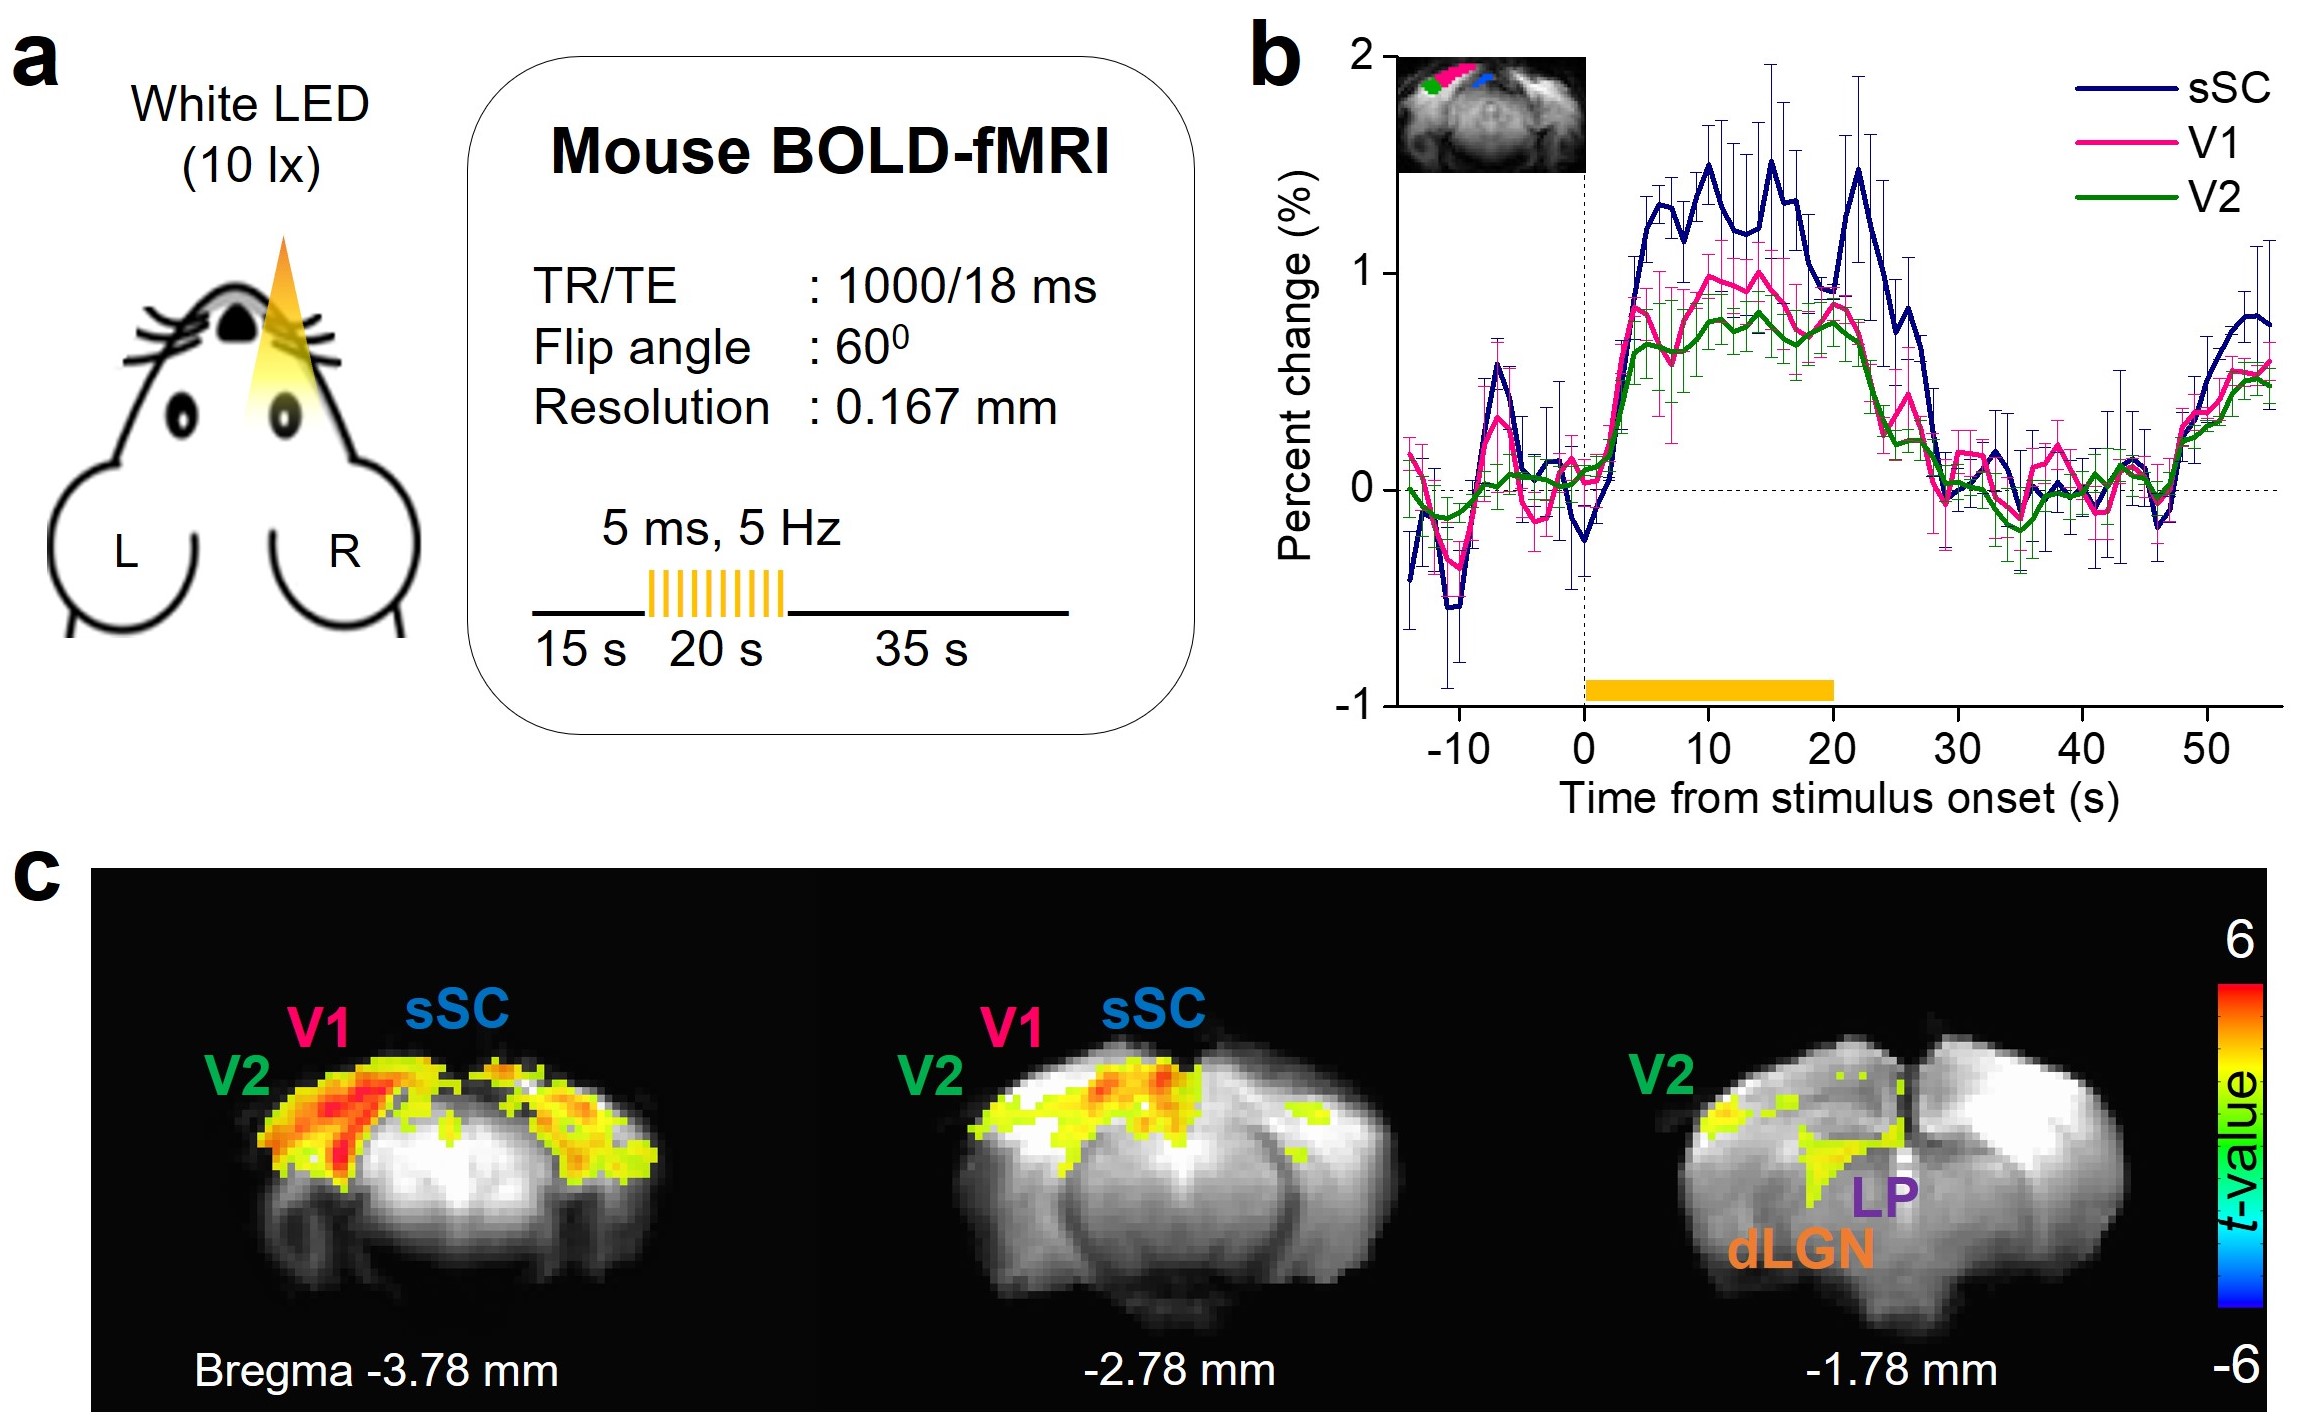
As a reference, BOLD-fMRI was conducted to acquire activation maps in three adjacent coronal slices. Scan parameters were: TR/TE, 1000/18ms; FA, 60°; FOV, 16×12mm; image matrix, 96×72; slice thickness, 1mm. The stimulation paradigm consisted of 15s pre-stimulation, 20s stimulation, and 35s post-stimulation (Fig.2a). During stimulation, a flashing light from a white cold LED was delivered to the right eye (illuminance, ~10lx; duration, 5ms; frequency, 5Hz).
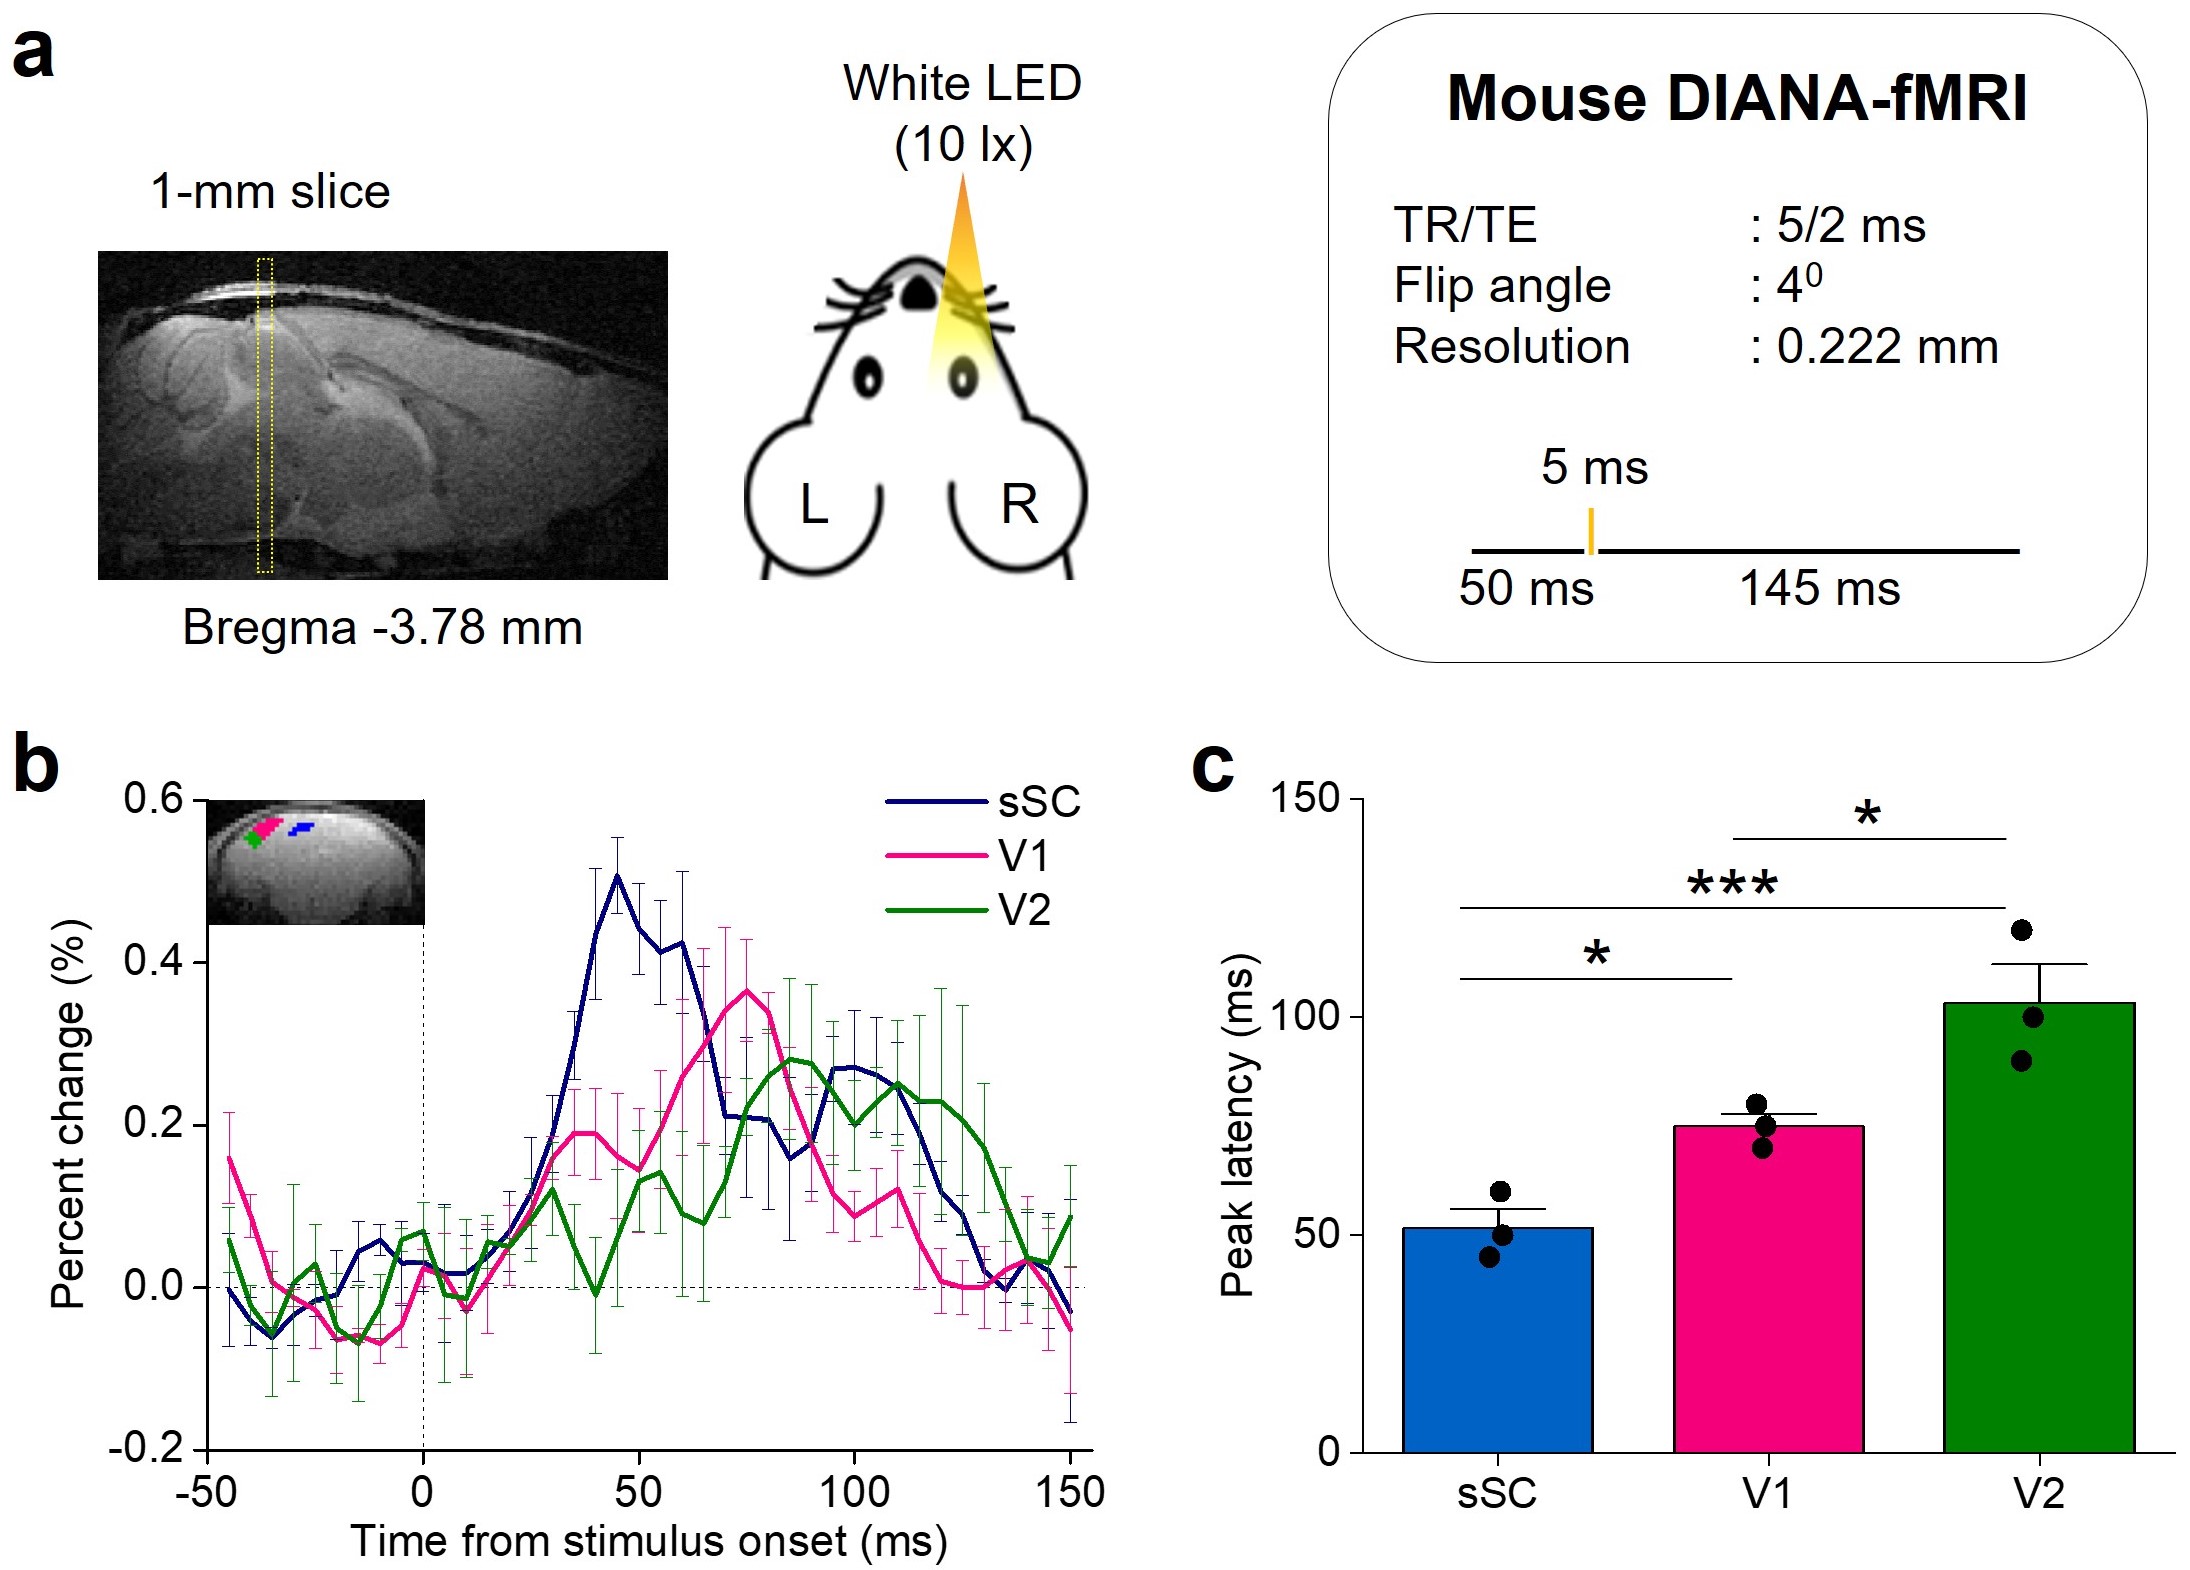
DIANA-fMRI was conducted to acquire a time series of 40 single coronal slices with 5ms temporal and 0.22mm spatial resolution. Scan parameters were: TR/TE, 5/2ms; FA, 4°; FOV, 16×12mm; matrix size, 72×54; slice thickness, 1mm; scan time, 10.8 s/trial; 40 trials/mouse. A single flashing light stimulus was repeatedly delivered to the right eye every 200ms (=40×5ms) interstimulus period consisting of 50ms pre-stimulation, 5ms stimulation, and 145ms post-stimulation (Fig.3a).
Data analysis:
All analyses of mouse DIANA-fMRI data (40 trials/mouse) were performed with home-built Matlab codes and support of AFNI6, FSL7, and ANTs8 software. For preprocessing, temporal smoothing (15ms) and detrending (if necessary) were applied to the time series. Spatial smoothing was applied using a median filter (5-voxels), and each image in the post-stimulation period was compared voxel-wise with the baseline (mean of pre-stimulation signals) using paired t-test. Positive t-value voxels were displayed and overlaid on the original DIANA images (p<0.05, cluster > 5 voxels). BOLD-fMRI data (6-10 trials/mouse) were analyzed according to the regular pipeline. One-way analysis of variance (ANOVA) with Fisher’s LSD post hoc test was used for comparing three groups.
Results
Figure 2b shows the time courses of BOLD-fMRI in contralateral superficial superior colliculus (sSC), primary (V1), and secondary visual cortex (V2), showing the highest BOLD signal change in sSC. Figure 2c shows the group-averaged activation maps covering major regions of the mouse visual pathway (n=3 mice).Figure 3b shows the time series of DIANA-fMRI in sSC, V1, and V2 (n=3 mice). The highest DIANA signal change was observed in sSC (~0.5%) with a peak at 45ms. The DIANA signal change reached a peak in V1 at 75ms (~0.37%) and in V2 at 85ms (~0.28%). There was a secondary peak in sSC at 100ms and in V2 at 110ms. Figure 3c shows the average peak latencies, the difference being statistically significant (ANOVA, p<0.05).
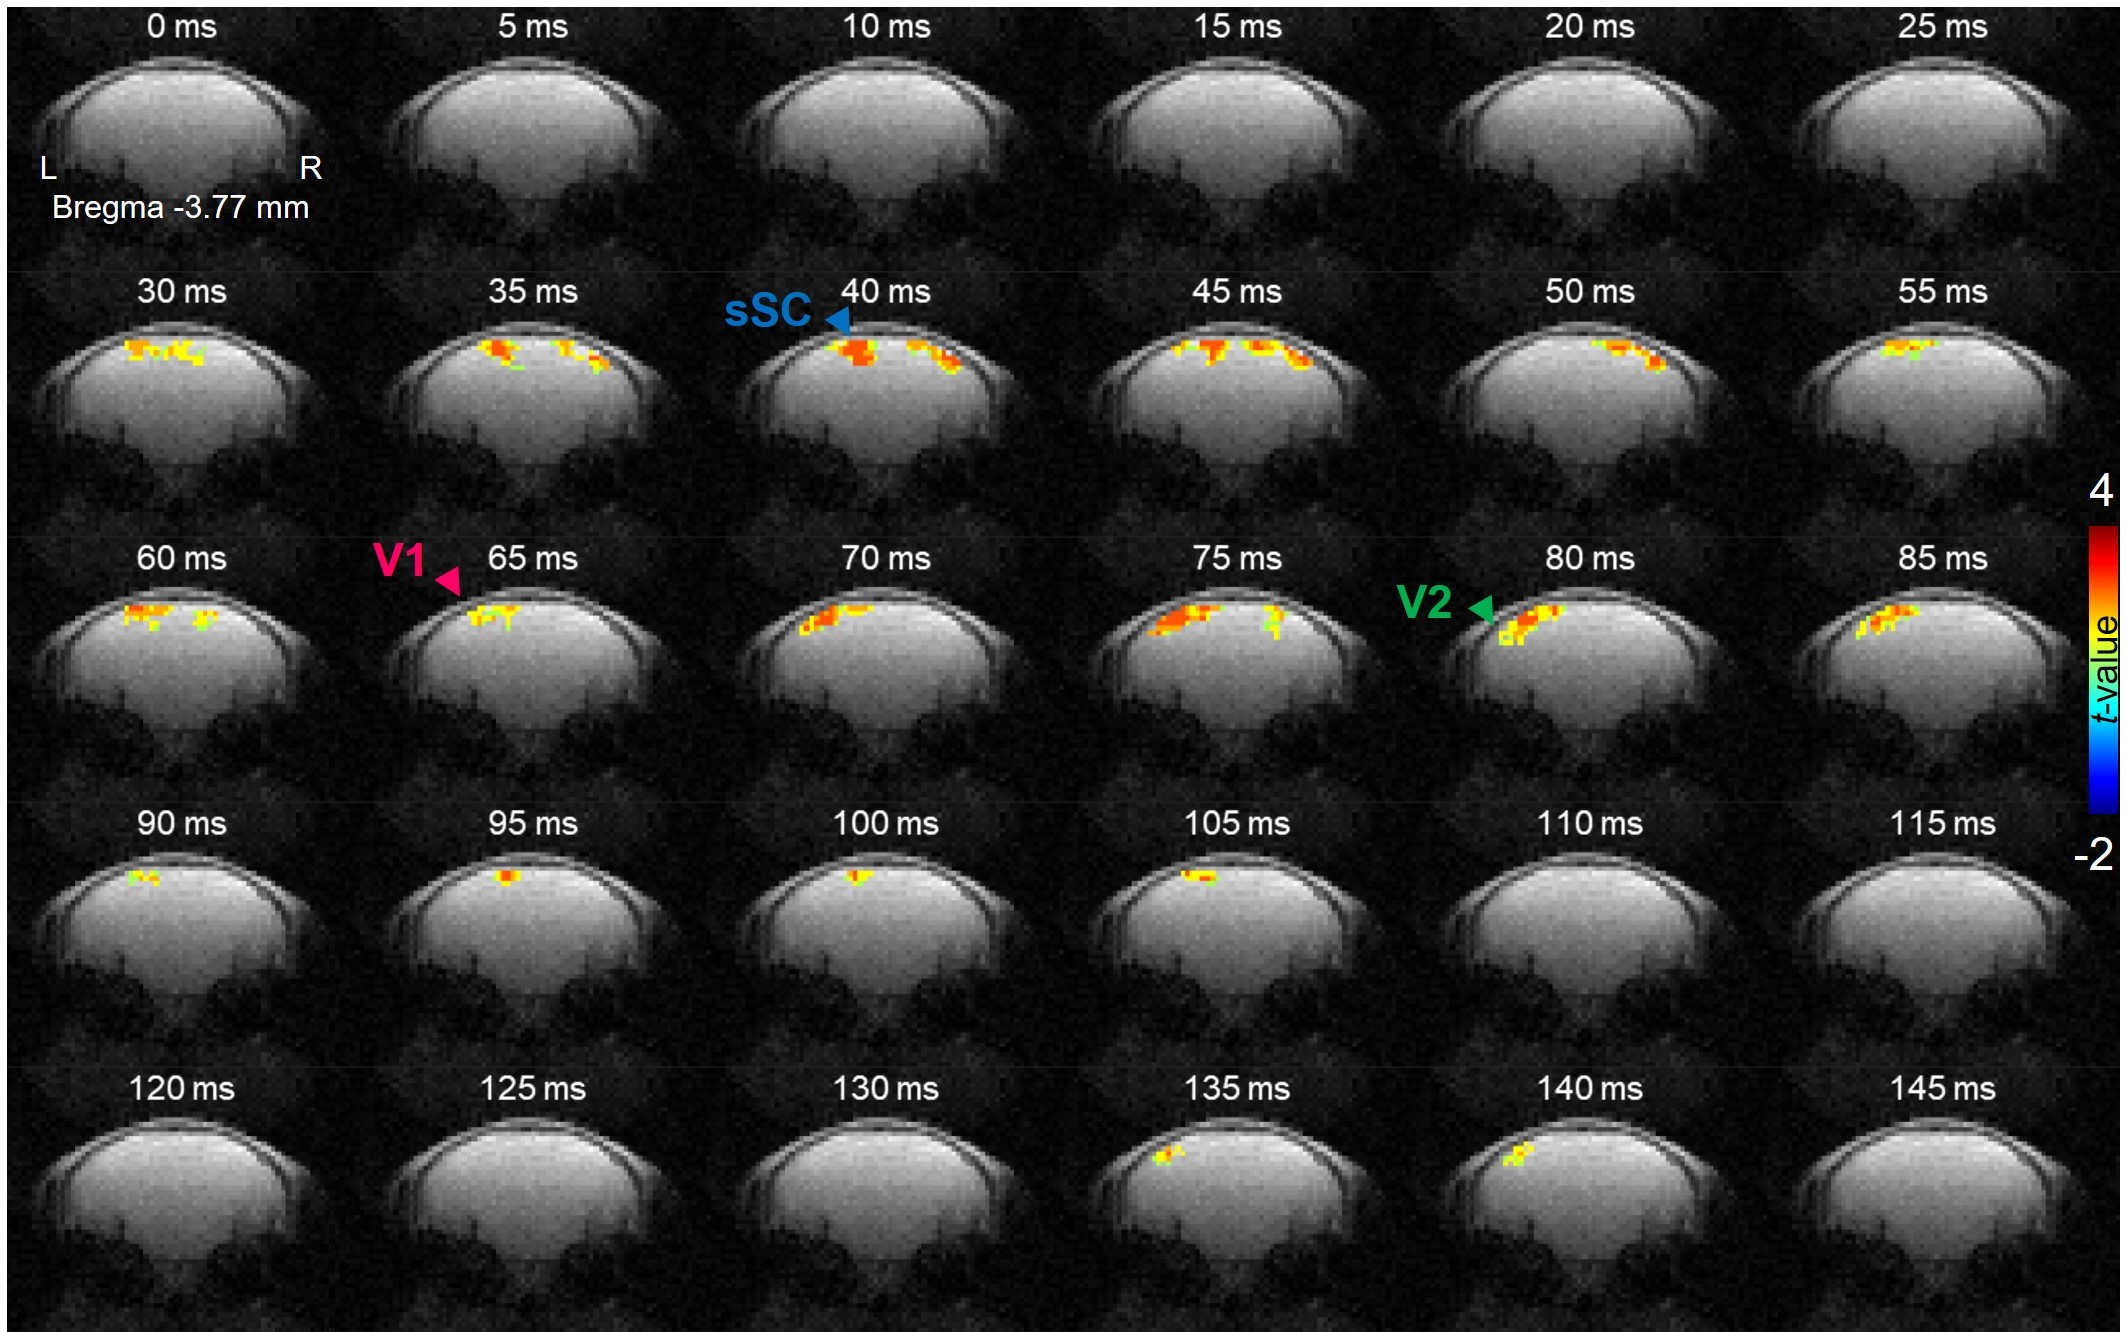
Figure 4 shows the time series of t-value maps in a representative mouse, exhibiting the temporospatial distribution of statistically significant activations in sSC, V1, and V2.
Discussion and conclusion
Following our previous work on somatosensory pathways, we demonstrated DIANA-fMRI performance using visual stimulation in mice in vivo, particularly showing sequential activations in the order of sSC, V1, and V2. The highest DIANA response to flashing light stimulation was observed in sSC, which receives input from ~85-90% retinal ganglion cells9. DIANA response times for sSC, V1, and V2 were consistent with previous studies showing latency of ~30-50ms for sSC10–13, ~70-110ms for V114–16, and ~10-25ms for V2 receiving input from V115,17. Interestingly, secondary peaks seem to appear in sSC at ~100ms and in V2 at 110ms. This could be a valuable observation since it was found that sSC also receives input from V19,18,19 and V2 receives input from sSC20.In this study, only a single slice of 1mm thickness was used, not covering all distal regions in either direct (dLGN to V1) or indirect visual pathway (sSC to LP, and LP to V2). Thus, multi-slice DIANA-fMRI would be more interesting for elucidating neural networks responding to specific stimuli. For the signal source of DIANA-fMRI, we hypothesize that the DIANA response is attributed to changes in T1 and T2 (mainly T2) due to changes in membrane potential21,22. With the fusion of high temporal and spatial resolution, DIANA-fMRI is expected to become a new and powerful tool for functional brain imaging.
Acknowledgements
This work was supported by NRF-2019M3C7A1031993.References
1. Lee, J., Lee, S.-K. & Park, J.-Y. A novel method for direct detection and spatial mapping of neuronal activity. in Proceedings of Scientific Meeting of the International Society for Magnetic Resonance in Medicine vol. 26 0703 (2018).
2. Toi, P. T., Lee, H., Lee, J., Lee, S.-K. & Park, J.-Y. Progress towards direct in-vivo detection and mapping of neuronal activity. in Proceedings of Scientific Meeting of the International Society for Magnetic Resonance in Medicine vol. 27 2991 (2019).
3. Toi, P. T. & Park, J.-Y. In vivo direct MR imaging of mouse whisker sensory responses. in Proceedings of Scientific Meeting of the International Society for Magnetic Resonance in Medicine vol. 28 3821 (2020).
4. Toi, P. T. et al. In vivo direct imaging of neuronal activity at high temporo-spatial resolution. 2021.05.21.444581 https://www.biorxiv.org/content/10.1101/2021.05.21.444581v2 (2021) doi:10.1101/2021.05.21.444581.
5. Yu, X., Qian, C., Chen, D., Dodd, S. J. & Koretsky, A. P. Deciphering laminar-specific neural inputs with line-scanning fMRI. Nat Methods 11, 55–58 (2014).
6. Cox, R. W. AFNI: Software for Analysis and Visualization of Functional Magnetic Resonance Neuroimages. Computers and Biomedical Research 29, 162–173 (1996).
7. Smith, S. M. et al. Advances in functional and structural MR image analysis and implementation as FSL. NeuroImage 23, S208–S219 (2004).
8. Avants, B. B. et al. A reproducible evaluation of ANTs similarity metric performance in brain image registration. NeuroImage 54, 2033–2044 (2011).
9. Seabrook, T. A., Burbridge, T., Crair, M. & Huberman, A. Architecture, Function, and Assembly of the Mouse Visual System. Annual review of neuroscience (2017) doi:10.1146/annurev-neuro-071714-033842.
10. Ghose, D., Maier, A., Nidiffer, A. & Wallace, M. T. Multisensory Response Modulation in the Superficial Layers of the Superior Colliculus. J. Neurosci. 34, 4332–4344 (2014).
11. De Franceschi, G. & Solomon, S. G. Visual response properties of neurons in the superficial layers of the superior colliculus of awake mouse. The Journal of Physiology 596, 6307–6332 (2018).
12. Khademi, F., Chen, C.-Y. & Hafed, Z. M. Visual feature tuning of superior colliculus neural reafferent responses after fixational microsaccades. Journal of Neurophysiology 123, 2136–2153 (2020).
13. Gharaei, S., Arabzadeh, E. & Solomon, S. G. Integration of visual and whisker signals in rat superior colliculus. Sci Rep 8, 16445 (2018).
14. Gao, E., DeAngelis, G. C. & Burkhalter, A. Parallel input channels to mouse primary visual cortex. J Neurosci 30, 5912–5926 (2010).
15. Goldbach, H. C., Akitake, B., Leedy, C. E. & Histed, M. H. Performance in even a simple perceptual task depends on mouse secondary visual areas. eLife 10, e62156 (2021).
16. Wang, X., Chen, C., Zhang, D. & Yao, H. Cumulative latency advance underlies fast visual processing in desynchronized brain state. PNAS 111, 515–520 (2014).
17. Siegle, J. H. et al. Survey of spiking in the mouse visual system reveals functional hierarchy. Nature 592, 86–92 (2021).
18. White, B. J., Kan, J. Y., Levy, R., Itti, L. & Munoz, D. P. Superior colliculus encodes visual saliency before the primary visual cortex. PNAS 114, 9451–9456 (2017).
19. Ito, S. & Feldheim, D. A. The Mouse Superior Colliculus: An Emerging Model for Studying Circuit Formation and Function. Frontiers in Neural Circuits 12, 10 (2018).
20. Tohmi, M., Meguro, R., Tsukano, H., Hishida, R. & Shibuki, K. The Extrageniculate Visual Pathway Generates Distinct Response Properties in the Higher Visual Areas of Mice. Current Biology 24, 587–597 (2014).
21. Min, K. et al. A change in membrane potential induces measurable changes in relaxation times. in Proceedings of Scientific Meeting of the International Society for Magnetic Resonance in Medicine vol. 28 0173 (2020).
22. Min, K. et al. Noninvasive detection of changes in membrane potential with MR measurements. in Proceedings of Scientific Meeting of the International Society for Magnetic Resonance in Medicine vol. 29 0086 (2021).
Figures