1736
Correlation between fMRI signals and oscillatory neuronal responses during audiovisual information processing1Physical Sciences Platform, Sunnybrook Research Institute, Toronto, ON, Canada, 2Department of Medical Biophysics, University of Toronto, Toronto, ON, Canada, 3Turku PET Centre, University of Turku, Turku, Finland, 4Department of Psychology, University of Turku, Turku, Finland, 5Turku University Hospital, Turku, Finland, 6Department of Neurology, Taipei Veterans General Hospital, Taipei, Taiwan, 7Brain Research Center, National Yang Ming Chiao Tung University, Taipei, Taiwan, 8Department of Neurosurgery, Taipei Veterans General Hospital, Taipei, Taiwan, 9Institute of Neuroscience, National Yang Ming Chiao Tung University, Taipei, Taiwan
Synopsis
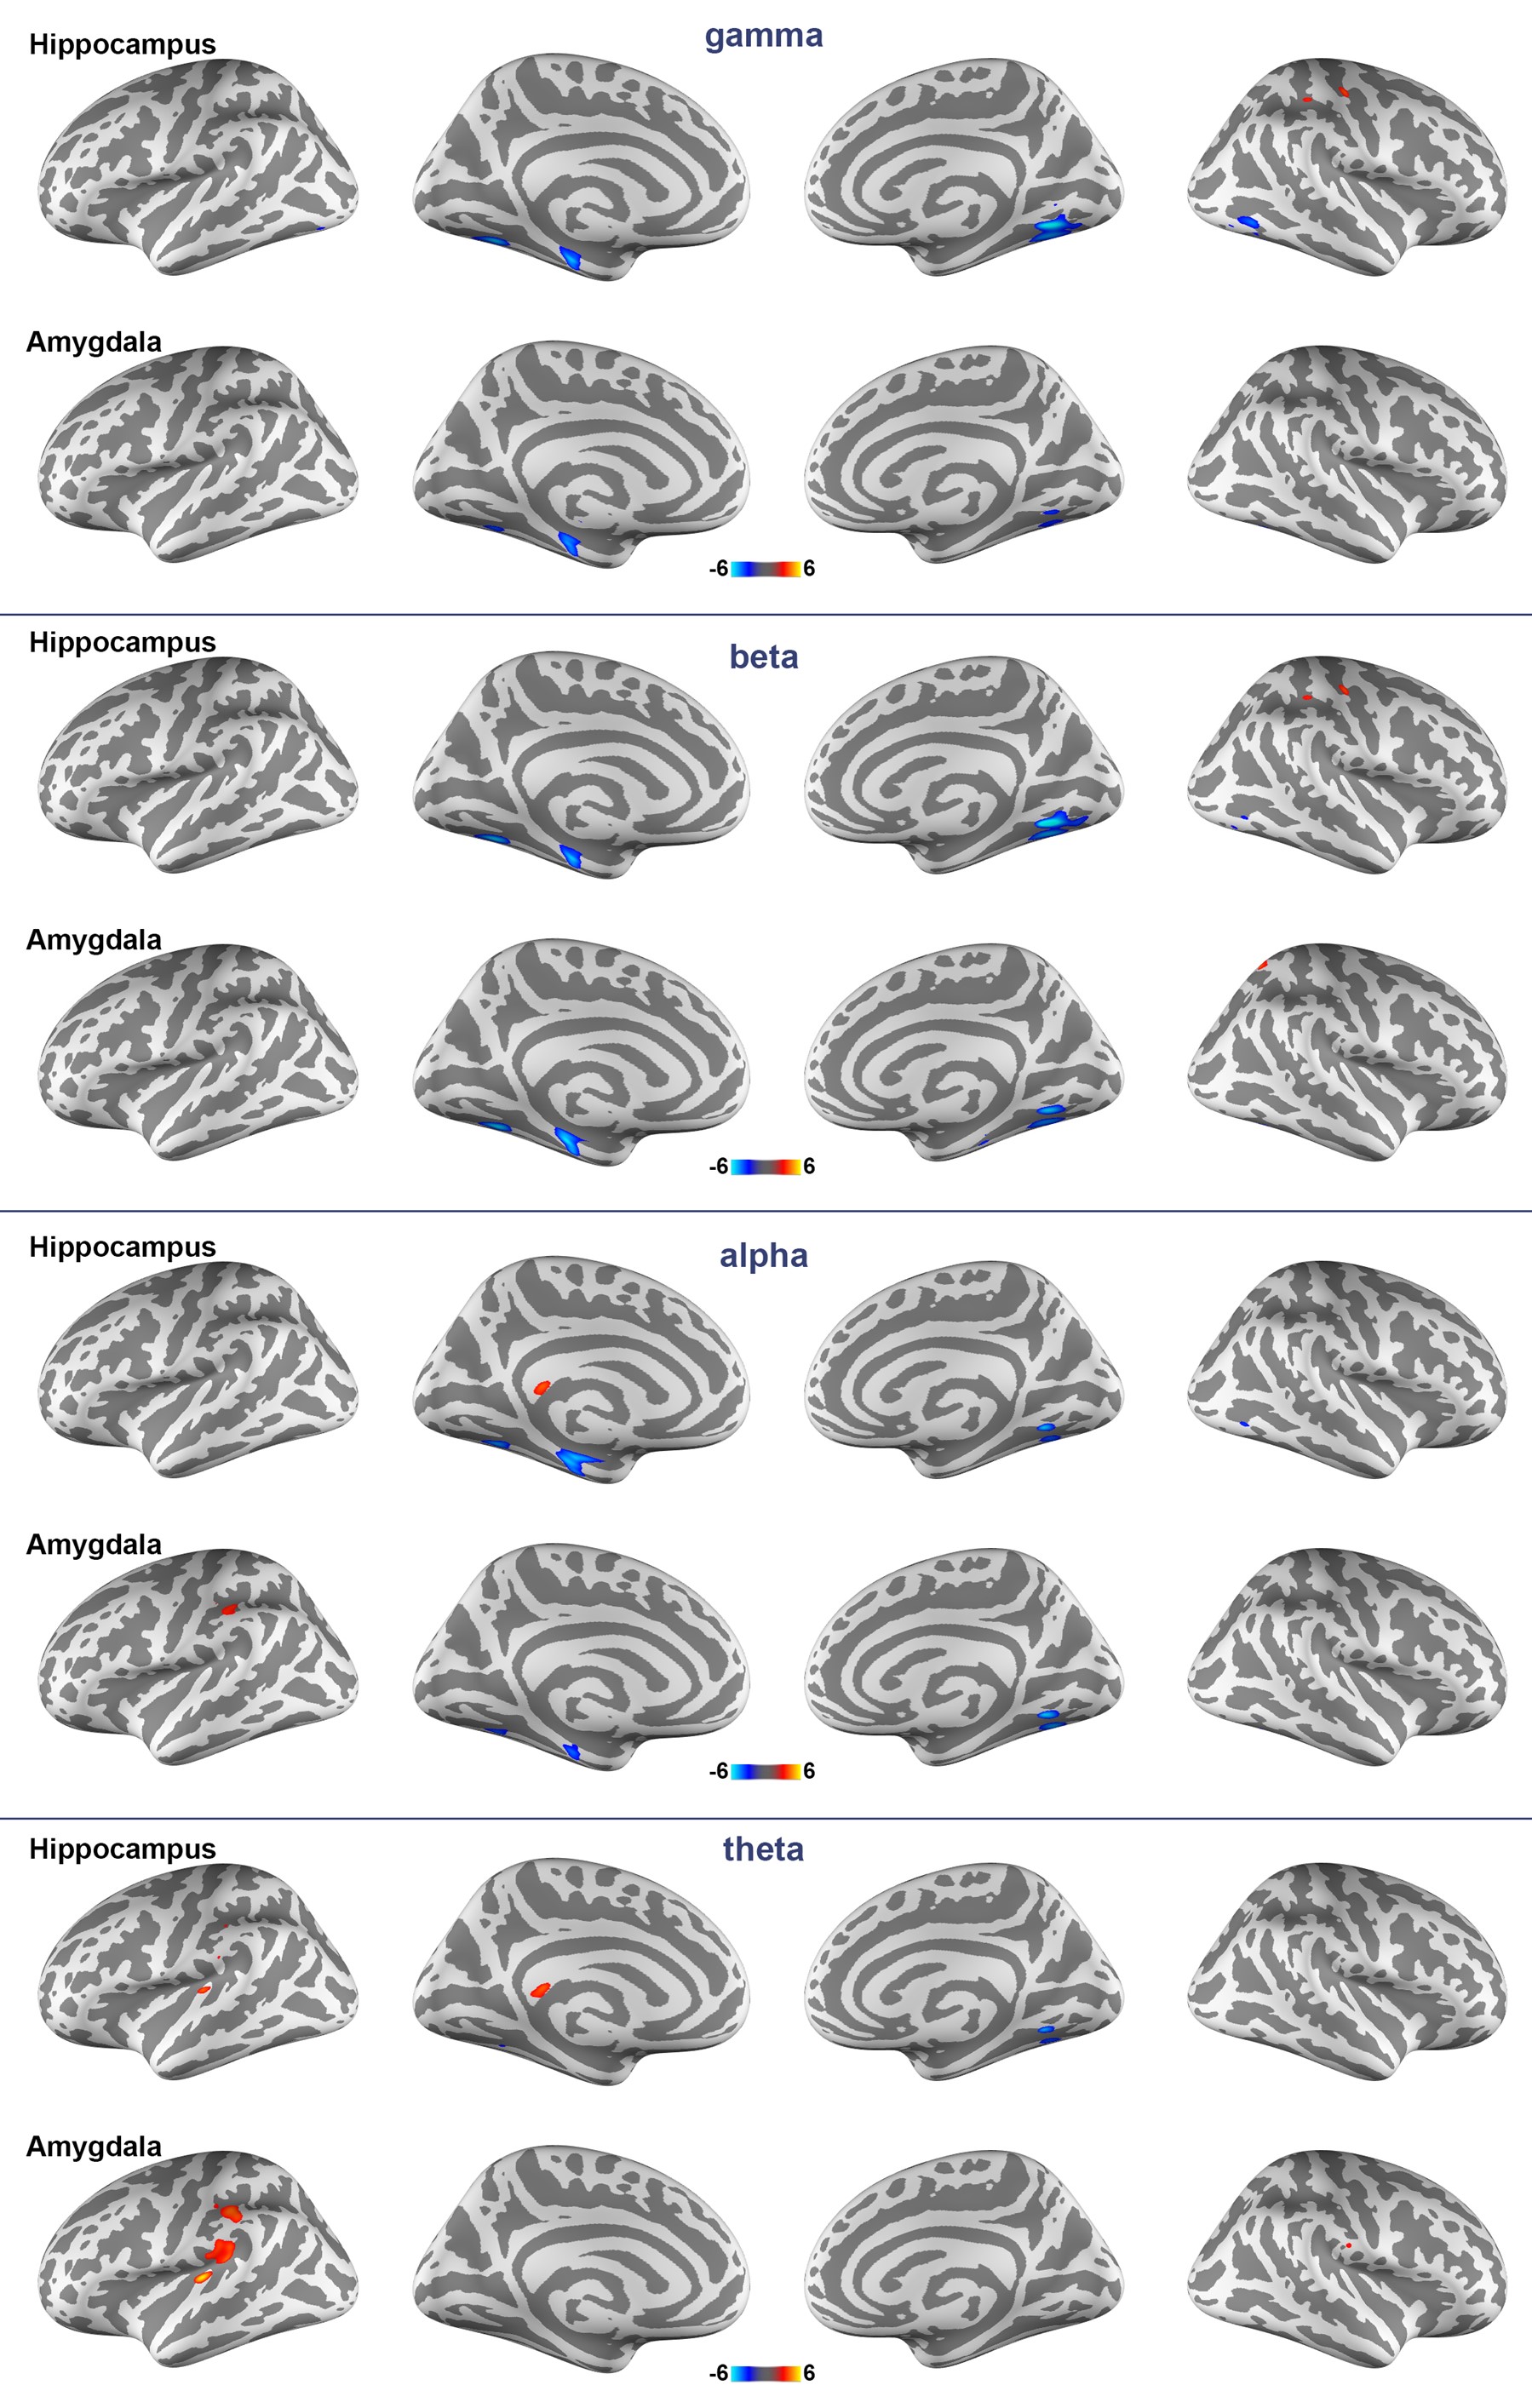
We studied how fMRI signal is related to neural oscillations by taking both fMRI and invasive recordings from epilepsy patients. Specifically, we examined the neurovascular coupling during complex naturalistic stimuli processing. A significant negative correlation between gamma-band neural oscillations at hippocampus/amygdala and fMRI signals was found at the amygdala, hippocampus, and inferior occipital lobes while viewing short movie clips. These correlations sustain across gamma, beta, and alpha bands. The left angular gyrus shows a positive correlation between neural oscillations and fMRI dynamics at the theta band.
Introduction
Conventional experimental paradigms using still images or simple sound clips fail to induce emotional responses reliably. Complex naturalistic stimuli encapsulating a wide variety of sensory inputs in everyday life provide ideal materials to induce emotion robustly [1-4]. Naturalistic stimuli have been used to elicit synchronized regional neural responses across subjects [2, 5-7] and cause high within- and between-subject functional connectivity, with high test-retest reliability in the network topology [8]. However, the neurophysiological basis of brain activity underpinning the processing of such rich audiovisual information is not fully understood. While electroencephalography (EEG) and magnetoencephalography (MEG) can probe neural activity non-invasively, they lack spatial specificity and sensitivity to neural activity in the deep areas, such as the hippocampus and the amygdala, two important regions in emotion regulation.Here we tackle this challenge by measuring the neural activity at the hippocampus and amygdala from the invasive recordings on medically refractory epilepsy patients. Patients viewed compilations of movie clips during oscillatory neural activity recording and fMRI. These measurements allow the discovery of neurovascular coupling between deep and superficial brain areas during complex naturalistic stimuli processing.
Methods
All patients joined this study with written informed consents after the approval of the Institute Review Boards. Functional MRI data were acquired on a 3T MRI system (Skyra, Siemens) with a 32-channel whole-head coil array. Six medically refractory epilepsy patients were recruited to this study. Structural and functional images were acquired with MPRAGE 1-mm isotropic resolution. The video stimuli were 87 segments (on average, 12 ± 3 s in length) cut from Hollywood feature films such as When Harry Met Sally and The Godfather [8]. Each patient watched the compilation of movie segments in a randomized order.Electrophysiological responses were measured from six epilepsy patients by stereotactic electroencephalography (sEEG). All patients had an electrode (Ad-Tech Medical Instrument, Oak Creek, WI, USA) with up to eight contacts (5 mm separation) at the temporal lobe. Pre-surgery and post-surgery structural MRI were obtained from patients to identify electrode and contacts locations.
The sEEG data were re-referenced to the average of each electrode. Spatial distributions of neural currents generating sEEG measurements were estimated by a distributed source modeling method [10]. Time series at regions of interest, including the hippocampus and amygdala, were then extracted. Frequency-specific oscillatory neural activities were estimated by first applying the Morlet wavelet transform (the central frequencies varying between 4 Hz and 60 Hz and 7-cycle width) to the sEEG time series and then taking the absolute values. At each central frequency, a modeled fMRI time series was created by convolving a canonical hemodynamic response function to the oscillatory neural activities at that frequency. At each central frequency, a General Linear Model was used to correlate the sEEG and fMRI data.
Results
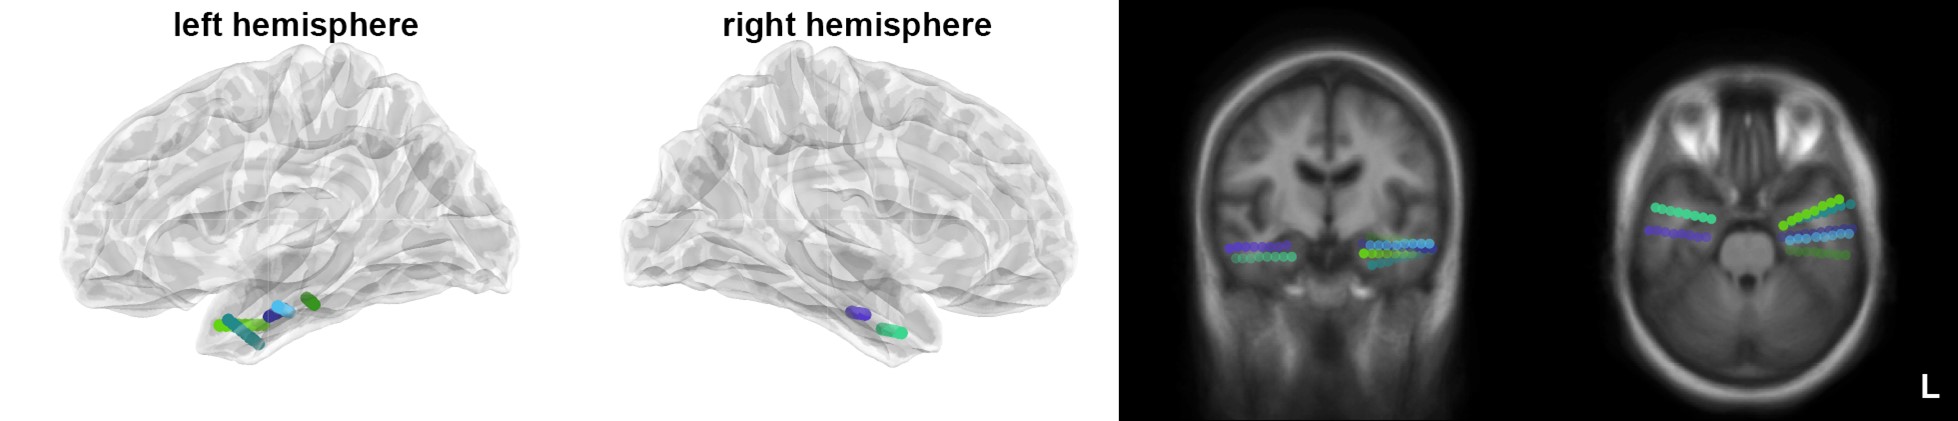
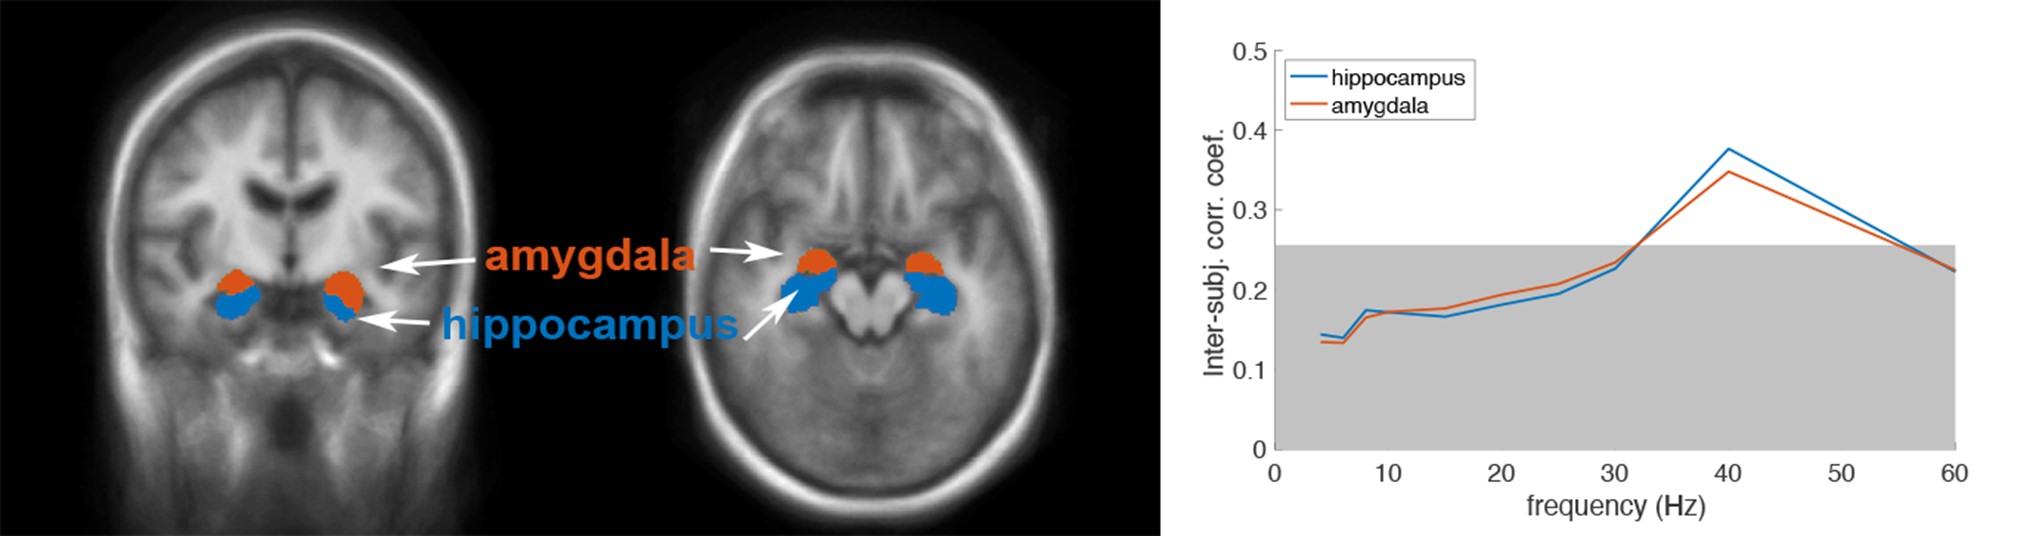
Figure 1 shows locations of the implanted electrodes at the hippocampus and amygdala. The reproducibility of the estimated regional neural currents at both regions was demonstrated by the significant inter-subject correlation (Figure 2), where significantly synchronized neural oscillations around 40 Hz (gamma band) were found. Figure 3 shows distributions of significant regional fMRI signals correlated to neural oscillations in gamma, beta, alpha, and theta bands at the hippocampus and amygdala. Significant negative correlation between gamma-band neural oscillations at hippocampus/amygdala and fMRI signals was found at the amygdala, hippocampus, and inferior occipital lobes —These correlations sustained across gamma, beta, and alpha bands. At the theta band, the left angular gyrus shows a positive correlation between neural oscillations and fMRI dynamics.Discussion
To date, invasive recording is the only approach to provide high temporal resolution recoding of neural activity with high spatial accuracy. Our study revealed that the fMRI signal at the cortex is positively and negatively correlated to subcortical neural oscillations at theta and gamma bands, respectively. This neurovascular coupling is different from that at the cortical areas, where human auditory and visual cortices are significantly negatively and positively correlated with neuronal oscillation in alpha/beta band and gamma band, respectively [11, 12]. Potential confounds of the present study included the limited number of patients and thus a possible bias due to inter-subject variability. Future investigation on neural signatures at cortical areas can elucidate how neural oscillations at both cortical and subcortical areas act in concert to elicit the fMRI waveforms during high-order cognitive and emotional processing.Acknowledgements
This study was supported by Canadian Institutes of Health Research (202104PJT-463545-MPI-CEAF-293013), Natural Sciences and Engineering Research Council of Canada (RGPIN-2020-05927), MITACS (IT25405), Sunnybrook Research Institute, Canadian Foundation for Innovation, Ministry of Science and Technology, Taiwan (108-2410-H-010-006-MY2 and 109-2314-B-075 -053), and National Health Research Institutes, Taiwan (NHRI-EX109-10905NI).References
1. Hasson, U., et al., J Neurosci, 2008. 28(10): p. 2539-50.
2. Jaaskelainen, I.P., et al., Sci Rep, 2016. 6: p. 27741.
3. Lin, F.H., et al., Sci Rep, 2019. 9(1): p. 13251.
4. Regev, M., et al., J Neurosci, 2013. 33(40): p. 15978-88.
5. Karjalainen, T., et al., Cereb Cortex, 2017. 27(8): p. 4257-4266.
6. Karjalainen, T., et al., Cereb Cortex, 2019. 29(9): p. 4006-4016.
7. Lahnakoski, J.M., et al., Front Hum Neurosci, 2012. 6: p. 233.
8. Vanderwal, T., et al., Neuroimage, 2017. 157: p. 521-530.
9. Nummenmaa, L., et al., Proc Natl Acad Sci U S A, 2012. 109(24): p. 9599-604.
10. Lin, F.H., et al., Neuroimage, 2021. 230: p. 117746.
11. Mukamel, R., et al., Science, 2005. 309(5736): p. 951-4.
12. Scheeringa, R., et al., Proc Natl Acad Sci USA, 2016. 113(24): p. 6761-6766.
Figures