1734
Comparison of Language Areas determined by Resting State and Task Based fMRI using healthy subjects HCP data.1Department of Imaging and pathology, Translational MRI, Leuven, Belgium, KU Leuven, Leuven, Belgium, 2Leuven Brain Institute, Department of Neurosciences, Leuven, Belgium, KU Leuven, Leuven, Belgium, 3Department of Radiology, University Hospitals Leuven, Leuven, Belgium, University Hospital Leuven, Leuven, Belgium
Synopsis
Adding to the literature of resting state fMRI (rsfMRI) in preoperative planning, we investigated the similarity of a task based fMRI (tbfMRI) language protocol to a pan-language functional connectivity map in 10 healthy subjects. When comparing the whole brain there is relatively low Jaccard and Sorensen-Dice similarity between rsfMRI and tbfMRI language activity, however when looking at separate cortical anatomical regions the language areas are among those having the highest similarity. Additionally, there is a significantly higher similarity in the left IFG pars triangularis. This suggests that rsfMRI could be used reliably to determine Broca’s area in preoperative planning.
Introduction
Determining the location of Broca’s area, Wernicke's area and general language laterality is imperative in pre-operative planning. Task based fMRI (tbfMRI) is currently used to help determine this, but what if your patients cannot complete such tasks? Recent works have described resting state fMRI (rsfMRI) as a possible alternative(1–4). However, the data is limited, mostly including clinical patients and the conclusions are variable(5). Further building on this work, we investigate the similarity in language area activity in tbfMRI and rsfMRI in 10 healthy subjects.Methods
The data used was available from the S1200 release of the WU-Minn Human Connectome Project consortium (HCP) (6). Anatomical data, resting state, and task-based language conditions for 10 subjects were chosen for analysis.The resting state data was acquired with a TR of 720 ms. The language task was organized as described by Binder et al. (7) For each subject one run per tbfMRI and rsfMRI condition was used.
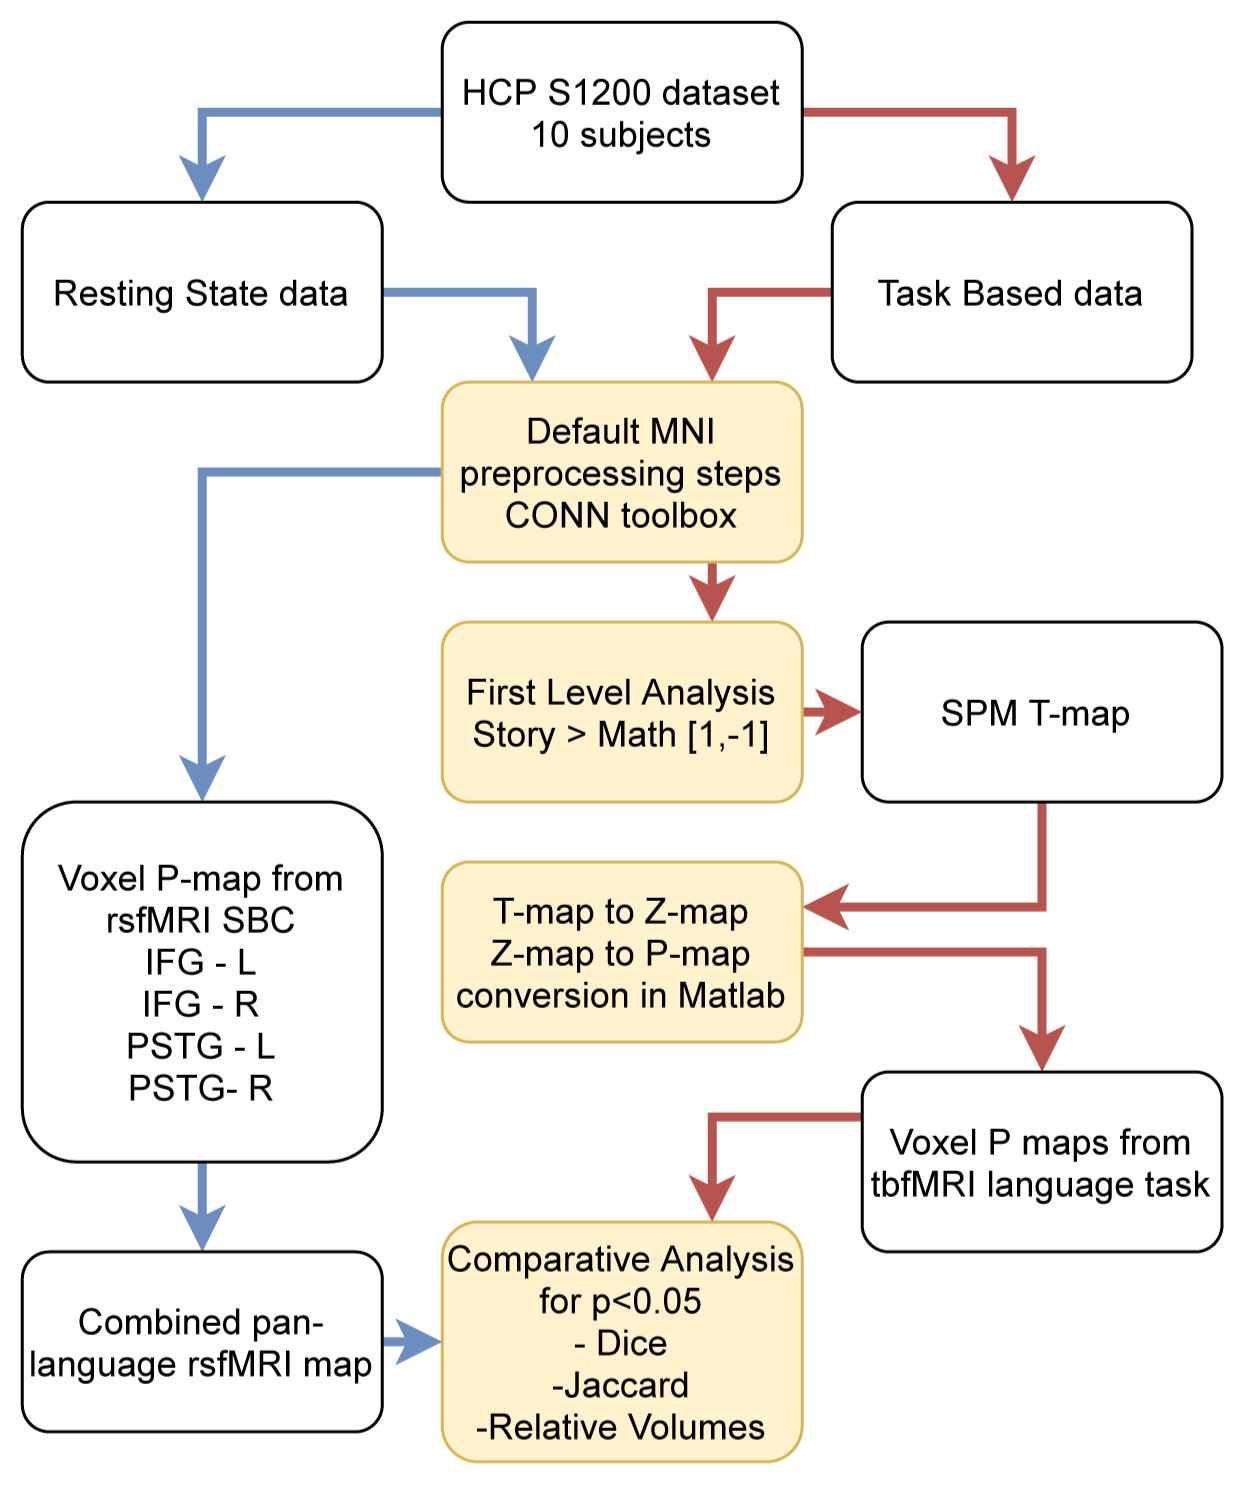
Data analysis (summarised in Fig. 1) consisted of preprocessing steps, first level analysis and comparative analysis. Software packages used to achieve this were CONN-toolbox (8), Statistical Parametric Mapping (SPM) and custom scripting in MATLAB (MathWorks). Preprocessing was done using CONN’s ‘default-MNI’ preprocessing pipeline. A spatial smoothing kernel with FWHM of 6 was used.
The same preprocessing was applied to rsfMRI and tbfMRI data with the sole difference being the bandpass filter used in the denoising step. The results are mapped to MNI space.
For rsfMRI data, after denoising, seed based connectivity (SBC) was calculated using the default conn network parcellation atlas. The left and right Inferior Frontal Gyrus (IFG) and posterior superior temporal gyrus (pSTG) language networks were chosen as seeds. The p-maps were thresholded at p<0.05. A combined pan-language functional connectivity (FC) map was created by selecting only those voxels present in all 4 SBC p-maps.
For first level analysis of tbfMRI data, a Math < Story contrast (vector: [-1,1] for [math, story] conditions) was created. The corresponding t-map was converted to p-maps and thresholded at p<0.05.
The above was repeated for each subject and comparisons were made between subject specific tbfMRI first level results and the pan-language FC maps. Jaccard index and Sorensen-Dice index were used as similarity metrics. The comparison was made for the whole brain volume and for separate cortical ROIs. These regions were determined by parcellating the MNI space with the Harvard-Oxford atlas (9-12).
Results
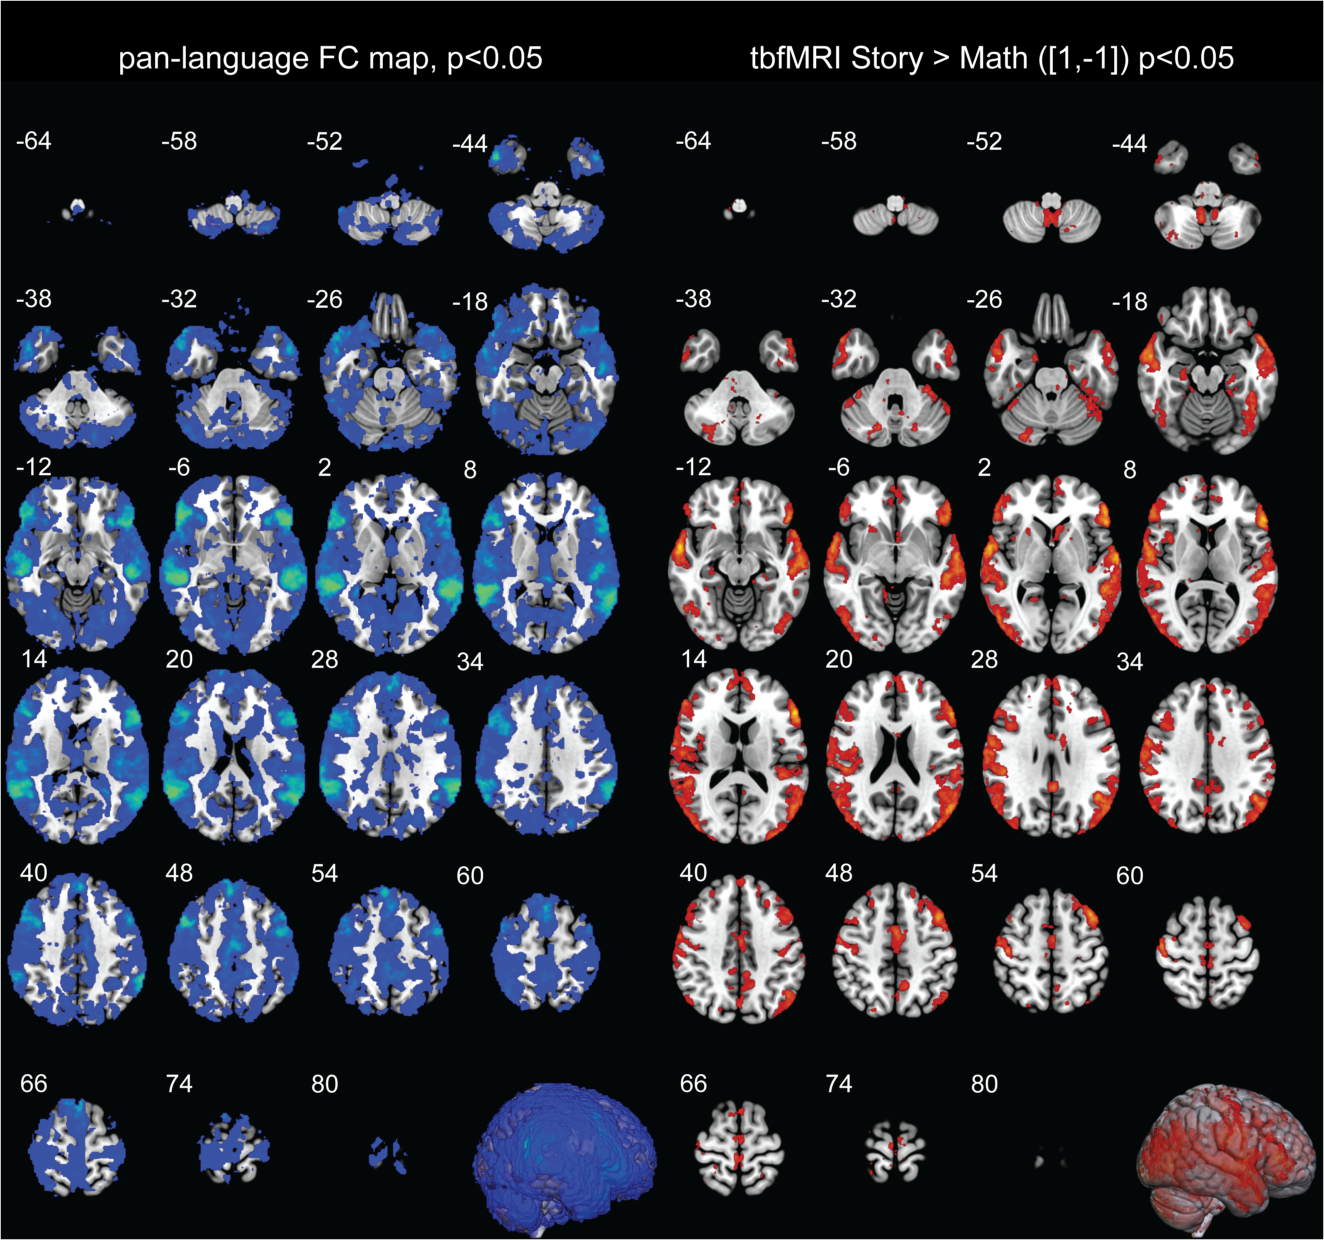
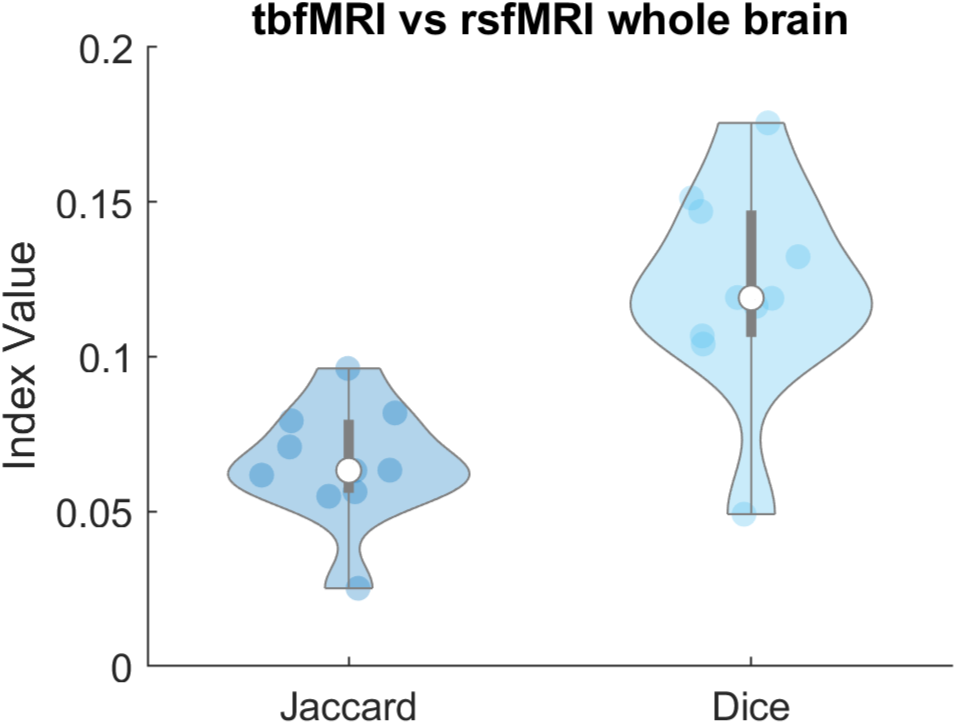
First level results of tbfMRI show activation in Broca’s area (IFG) and Wernicke’s area (pSTG) as expected (Fig. 2A). The resting state first level seed-based correlation results also show expected activation patterns for each of the four language networks results. The pan-language FC map shows a slightly asymmetric activity pattern in the language areas. (Fig. 2B).When comparing the whole brain volumes of tbfMRI and the pan-language FC maps the Jaccard index values are 0.0653 ± 0.0191 and Sorensen Dice indices are 0.1220 ± 0.0339 (Fig. 3).
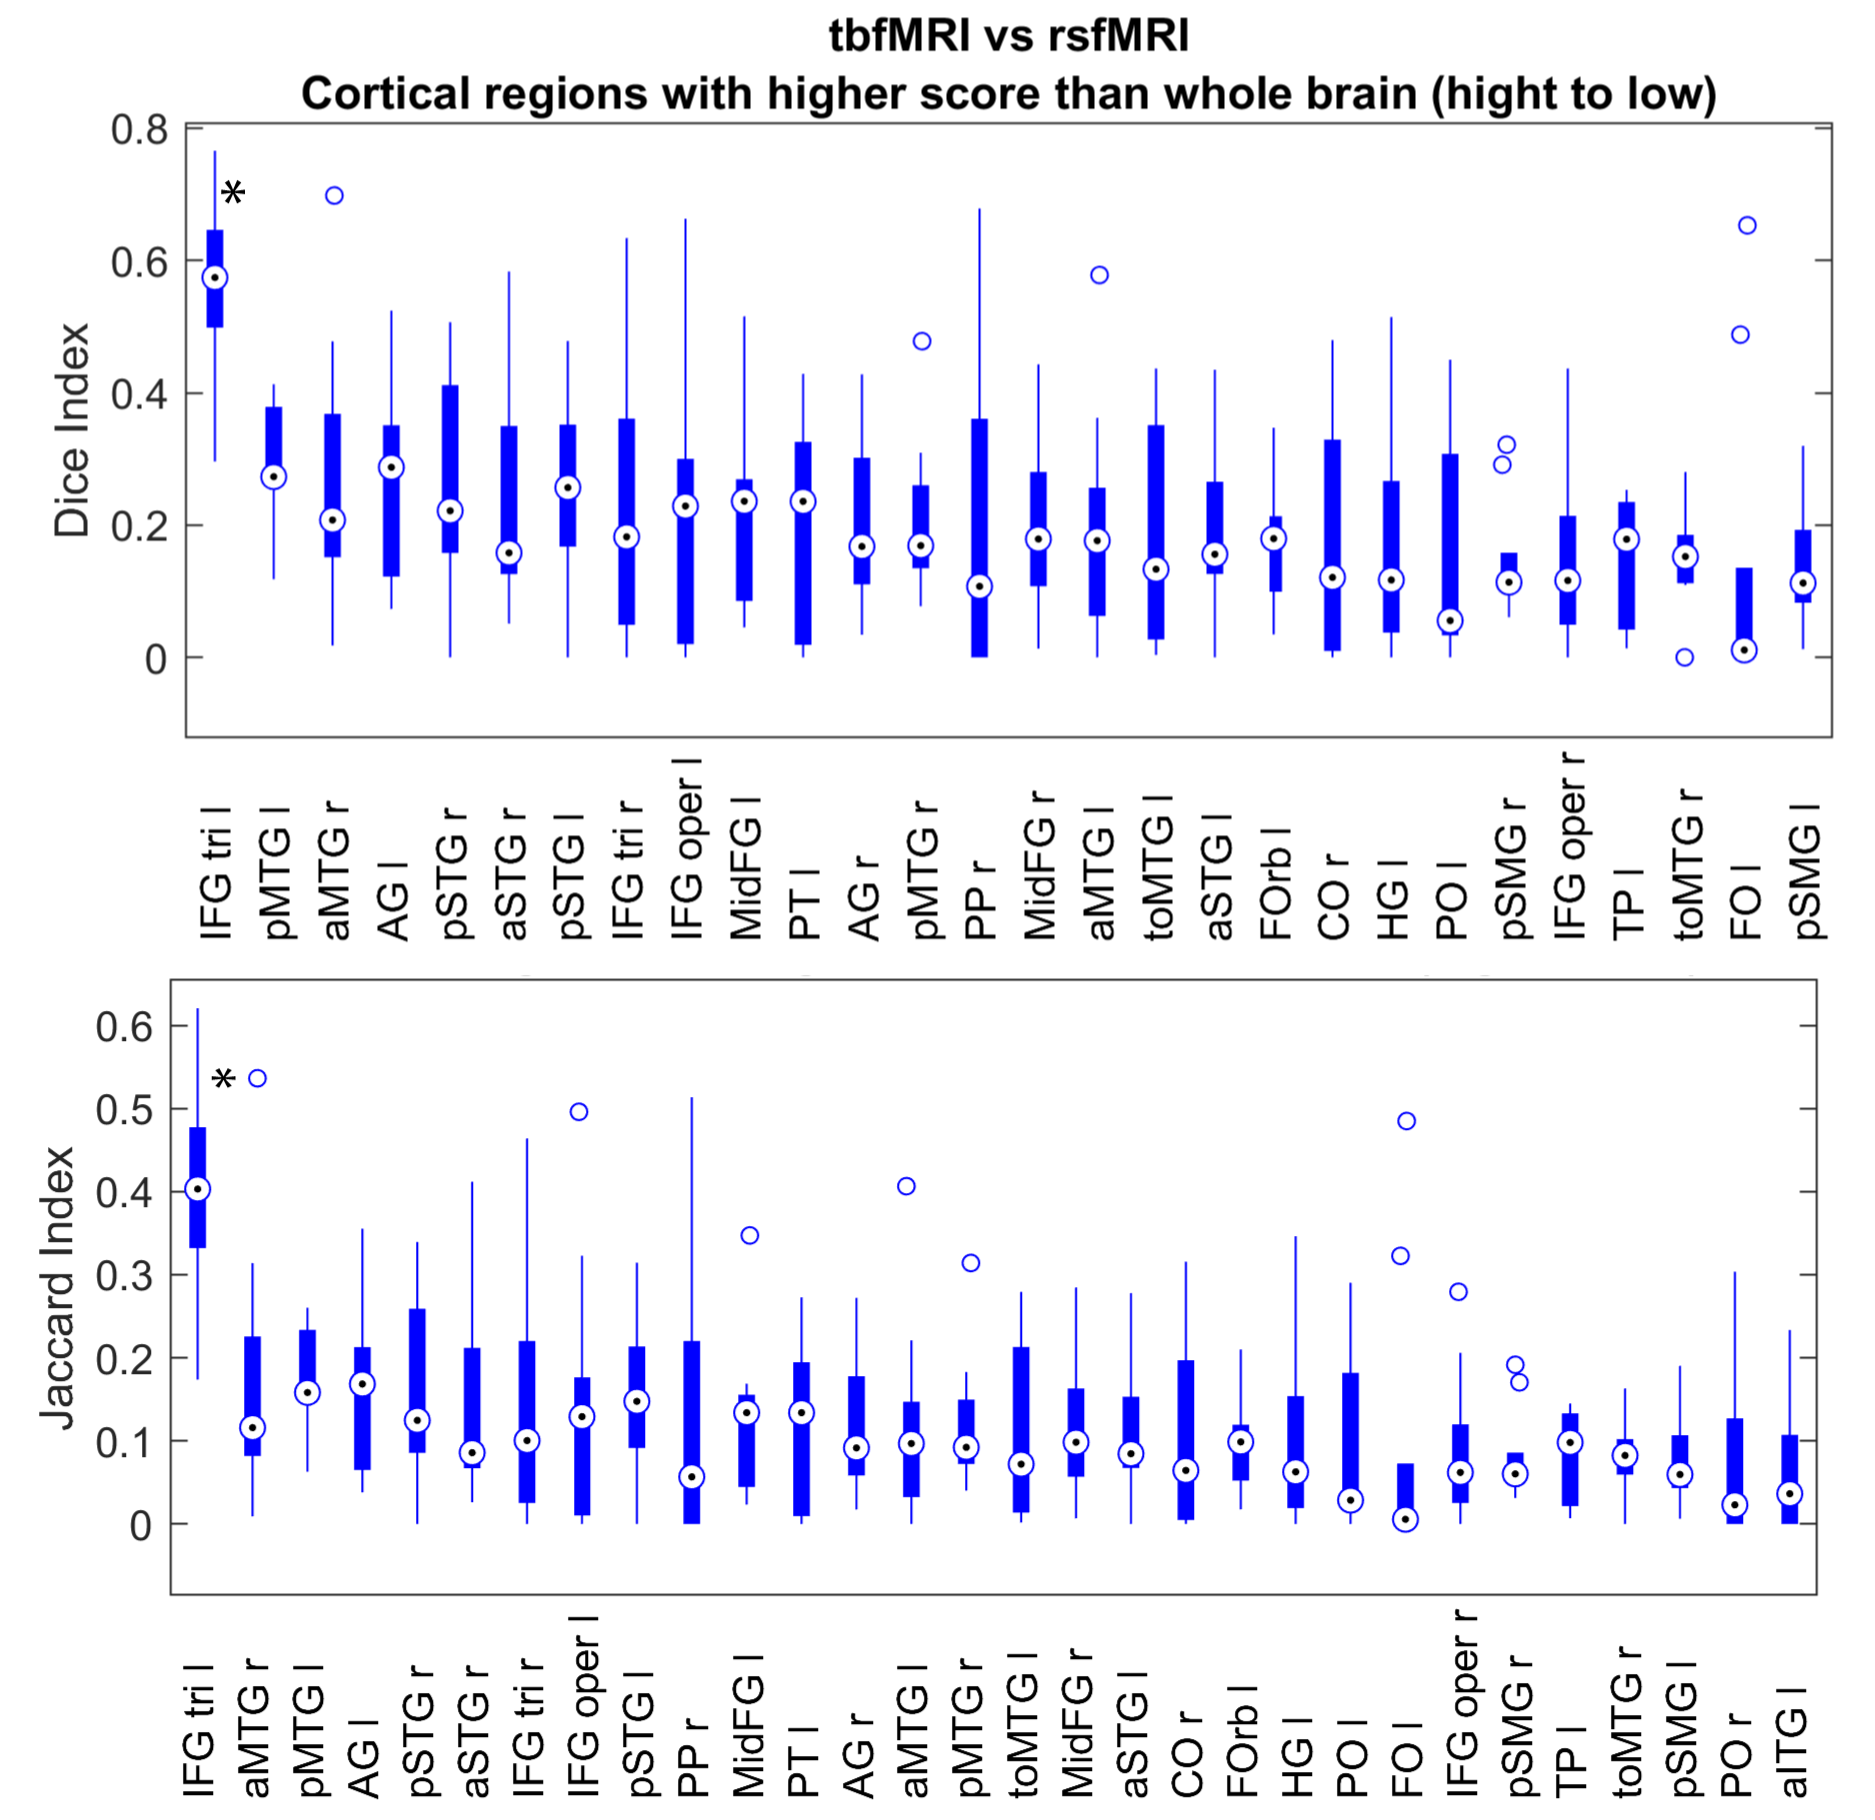
Looking at separate brain regions, there are 28 regions with higher Sorensen Dice indices and 30 regions with higher Jaccard indices than the whole brain values. For Both Jaccard and Dice values the language areas are among the highest scoring areas (Fig. 4). A significantly higher value for Dice and Jaccard can be found in the left IFG pars triangularis (p<0.001, Wilcoxon rank sum test).
Discussion
The tbfMRI first level activity map and pan-language FC map seem quite widespread. FDR correction of the p-maps could solve this, however more subjects would be needed to increase the power of the analysis.The dice and Jaccard scores when comparing the whole brain are relatively low. This might indicate that the four chosen language networks are not sufficient as correlates for task-based language area determinants. The choice of analysis using the pan-language FC map might also not be optimal. In addition, the Story > Math contrast as described by Binder et al. (7) might not be as good an indicator of language laterality as other protocols that are used in the clinic such as verb-to-noun generation, sentence completion or object naming.
However, when separating out the cortical anatomical regions, the language areas are among the highest scoring areas, albeit with relatively low scores. A marked exception to this is the left sided IFG pars triangularis, which scores significantly higher than the rest. This could indicate that the localization of Brocca’s area using rsfMRI in healthy subjects might be valid. However, a limitation of this finding is that there was no information available at the time about the handedness of the subjects.
Conclusion
When comparing language in tbfMRI and rsfMRI in healthy subjects there is a low similarity when looking at the whole brain. However when looking at separate cortical areas the language areas score the highest in similarity. Moreover there is a significantly higher similarity index for the left IFG pars triangularis compared to other areas.This work further opens the door towards determining language localisation using rsfMRI in preoperative planning. Future work includes a bigger sample size, the addition of motor networks and development of predictive models.
Acknowledgements
No acknowledgement found.References
1. Catalino MP, Yao S, Green DL, Laws ER, Golby AJ, Tie Y. Mapping cognitive and emotional networks in neurosurgical patients using resting-state functional magnetic resonance imaging. Neurosurg Focus. 2020 Feb 1;48(2):E9.
2. Branco P, Seixas D, Deprez S, Kovacs S, Peeters R, Castro SL, et al. Resting-state functional magnetic resonance imaging for language preoperative planning. Front Hum Neurosci. 2016;10(FEB2016):1–14.
3. Tie YM, Rigolo L, Norton IH, Huang RY, Wu WT, Orringer D, et al. Defining language networks from resting-state fMRI for surgical planning-a feasibility study. Hum Brain Mapp. 2014;35(3):1018–30.
4. Rolinski R, You X, Gonzalez-Castillo J, Norato G, Reynolds RC, Inati SK, et al. Language lateralization from task-based and resting state functional MRI in patients with epilepsy. Hum Brain Mapp. 2020;41(11):3133–46.
5. Manan HA, Franz EA, Yahya N. The utilisation of resting-state fMRI as a pre-operative mapping tool in patients with brain tumours in comparison to task-based fMRI and intraoperative mapping: A systematic review. Eur J Cancer Care (Engl). 2021;30(4):1–15.
6. HCP Young Adult - Connectome - Publications [Internet]. Humanconnectome.org. 2017 [cited 10 November 2021]. Available from: https://www.humanconnectome.org/study/hcp-young-adult
7. Binder J, Gross W, Allendorfer J, Bonilha L, Chapin J, Edwards J et al. Mapping anterior temporal lobe language areas with fMRI: A multicenter normative study. NeuroImage. 2011;54(2):1465-1475.
8. Whitfield-Gabrieli S, Nieto-Castanon A. Conn: A Functional Connectivity Toolbox for Correlated and Anticorrelated Brain Networks. Brain Connectivity. 2012;2(3):125-141.
9. Makris N, Goldstein JM, Kennedy D, Hodge SM, Caviness VS, Faraone SV, Tsuang MT, Seidman LJ. Decreased volume of left and total anterior insular lobule in schizophrenia. Schizophr Res. 2006;83(2-3):155-171.
10. Frazier JA, Chiu S, Breeze JL, Makris N, Lange N, Kennedy DN, Herbert MR, Bent EK, Koneru VK, Dieterich ME, Hodge SM, Rauch SL, Grant PE, Cohen BM, Seidman LJ, Caviness VS, Biederman J. Structural brain magnetic resonance imaging of limbic and thalamic volumes in pediatric bipolar disorder.Am J Psychiatry 2005;162(7):1256-1265
11. Desikan RS, Ségonne F, Fischl B, Quinn BT, Dickerson BC, Blacker D, Buckner RL, Dale AM, Maguire RP, Hyman BT, Albert MS, Killiany RJ. An automated labeling system for subdividing the human cerebral cortex on MRI scans into gyral based regions of interest. Neuroimage 2006;31(3):968-980
12. Goldstein JM, Seidman LJ, Makris N, Ahern T, O'Brien LM, Caviness VS Jr, Kennedy DN, Faraone SV, Tsuang MT Hypothalamic abnormalities in schizophrenia: sex effects and genetic vulnerability. Biol Psychiatry 2007;61(8):935-945
Figures