1733
Retinotopic connectivity in the cerebellum for different cognitive states
Wietske Zuiderbaan1, Wietske van der Zwaag1, and Tomas Knapen1,2
1Spinoza Centre for Neuroimaging, Amsterdam, Netherlands, 2Behavioral and Movement Sciences, Vrije Universiteit, Amsterdam, Netherlands
1Spinoza Centre for Neuroimaging, Amsterdam, Netherlands, 2Behavioral and Movement Sciences, Vrije Universiteit, Amsterdam, Netherlands
Synopsis
We used the retinotopic connective field model to investigate how retinotopic organization in the cerebellum depends on cognitive state. Previous work found three retinotopic clusters in the cerebellum. These regions were found using a standard bar mapping stimulus with fixation task. Here, we show that with a more naturalistic condition, we find an extra cluster to be retinotopically organized. Furthermore, we show that the oculomotor vermis shows a gradient in visual field eccentricity, that was not revealed using the simple stimulus. Our results underline the importance of using a naturalistic condition in studying the retinotopic organization of the cerebellum.
Introduction
Where the role of the cerebellum has long been suggested to be only sensorimotor, this view has changed to the involvement in a broader set of functioning in both cognitive and associative tasks. Recent studies found the cerebellum to be involved in visual processing1,2,3. In the study of van Es et al1, 3 retinotopically organized clusters were identified in the cerebellum. These regions were found using the population receptive field (pRF)-model4. This model is estimated using a simple bar mapping stimulus and subjects have to maintain fixation on a specific point. This situation is very different from our everyday vision where we make eye movements and visual stimulation is complex and active. This makes it hard to translate the previous results to natural, active vision. In this study, we use retinotopic connectivity (Fig. 1) to investigate the retinotopic organization in the cerebellum in different cognitive situations (movie watching and resting state). The advantage of this technique is that it can be used for any type of stimulus. We investigate how much of the cerebellum is retinotopically organized under different cognitive states, and if this retinotopic organization is consistent among these cognitive states.Methods
We used the 7T fMRI datasets of 174 subjects from the Human Connectome Project (HCP)5 for Movie Watching (MW) and Resting State (RS). The data was acquired at a resolution of 1.6mm3, with a TR of 1 second.The retinotopic connective field (CF)6,7 model combines the logic of the pRF model with functional connectivity4 (Fig. 1), as follows. The pRF-model estimates for every voxel the region of visual space that it responds to. The retinotopic connective field model projects the canonical visual field map of V1 into the cerebellum. For every voxel in the cerebellum a best-fitting connective field (CF) is estimated: a Gaussian patch on the surface of V1. This model timecourse originating from V1 shows the highest correlation with the measured voxel timecourse in the cerebellum. To ensure that the RC-model captures a spatially specific location in V1, the model was corrected using a null-model, which is the average time-course of V1. We derived for every CF the parameters for visual field position (x,y) from the underlying pRFs of the CF, and from these values, we calculated the corresponding eccentricity values.
To visualize the parameters of the CFs in the cerebellum, we used the spatially unbiased atlas template (SUIT)8. This toolbox projects the estimated parameter values of the CFs on a flattened 2D-representation of the cerebellum.
Results & Discussion
We compared the performance of the model fits between MW and RS visualized on the surface (Fig. 2A/B) and quantified performance per ROI (Fig. 2D). We see that in the previously found retinotopic maps (Fig. 2C), the fits for the MW condition explain more of the signal variance, whereas in the frontoparietal and default network regions of the cerebellum, the RS condition fits explain more.In Figure 3 we see for most of the retinotopic regions a comparable pattern for the eccentricity progression as found with the pRF-model1 (A) for both MW and RS (B). The CF results replicate earlier pRF based results of a cerebellar bias for representing the lower visual field. Interestingly, for region OMV we see an increase in the progression of eccentricity that was not previously seen (Fig 3A, blue lines) because of an overrepresentation of the fovea. This increase is particularly striking in the MW condition, where subjects were allowed to make eye movements and the stimuli were more complex. Here we see that this difference in cognitive state gives the ability to reveal changes in retinotopic organization. This pattern of findings, arising during naturalistic visual behavior, fits with the known role of region OMV in eye movements and spatial attention.
Lastly, we find a novel visually organized cluster, showing retinotopic organization during MW in the CRUS II-lobule. On the SUIT surface, we see a reversal in both the eccentricity and the Y-parameters of the CF (Fig. 4A, white outline). This reversal is further visualized in Figure 4B, where we plotted the eccentricity values of the SUIT-map along the direction on the surface as presented in Figure 4C. We see in both the left and the right ROI an increase followed by a decrease in eccentricity. The distribution of the CF centers (Fig. 4D) shows both for the left and right ROI an ipsilateral visual field representation (histogram of X) similar to known visually organized clusters in the cerebellum1. Finally, we see a preference for the lower visual hemifield (histogram of Y) in the new cluster. This again agrees with previously reported properties of retinotopic organizations in the cerebellum1, that shows a bias for a lower-visual-field representation.
Conclusion
We show how different cognitive states reveal differences in retinotopic organization in the cerebellum. When using a more naturalistic condition, we find a new retinotopically organized cluster in Crus II. Also, the oculomotor vermis shows a gradient in visual field eccentricity that was not found previously using a simple artificial stimulus. This shows the importance of using naturalistic conditions for studying the cerebellar retinotopic organization.Acknowledgements
Supported by an NWO Aspasia grant (015.014.038)References
- Van Es D.M., Van der Zwaag, W., Knapen T., Topographic maps of visual space in the human cerebellum. Curr. Biol., 2019; 29(10):1689-1694.
- Xue A., Kong R., Yang Q., et al., The detailed organization of the human cerebellum estimated by intrinsic functional connectivity within the individual. J. Neurophysiol., 2021;125(2):358-384.
- Brissenden J.A., Tobyne S.M., Osher D.E., et al., Topographic cortico-cerebellar networks revealed by visual attention and working memory. Curr Biol., 2018;28:3364-3372.
- Dumoulin S.O., Wandell B.A., Population receptive field estimates in human visual cortex. Neuroimage, 2008;39:647-660.
- Van Essen D.C. et al, The Wu-Minn human connectome project: An overview. Neuroimage, 2013;80:62-79.
- Haak K.V., et al., Connective field modeling. Neuroimage, 2012;66C:376-384.
- Knapen T., Topographic connectivity reveals task-dependent retinotopic processing throughout the human brain. PNAS, 2021;118(2) e2017032118.
- Diedrichsen J. & Zotow, E. Surface-based display of volume-averaged cerebellar data. PLoS One, 2015:7 e0133402.
- Buckner R.L., Krienen F.M., Castellanos A., et al., The organization of the human cerebellum estimated by intrinsic functional connectivity. J. Neurophysiol., 2011;106:2322-2345.
Figures
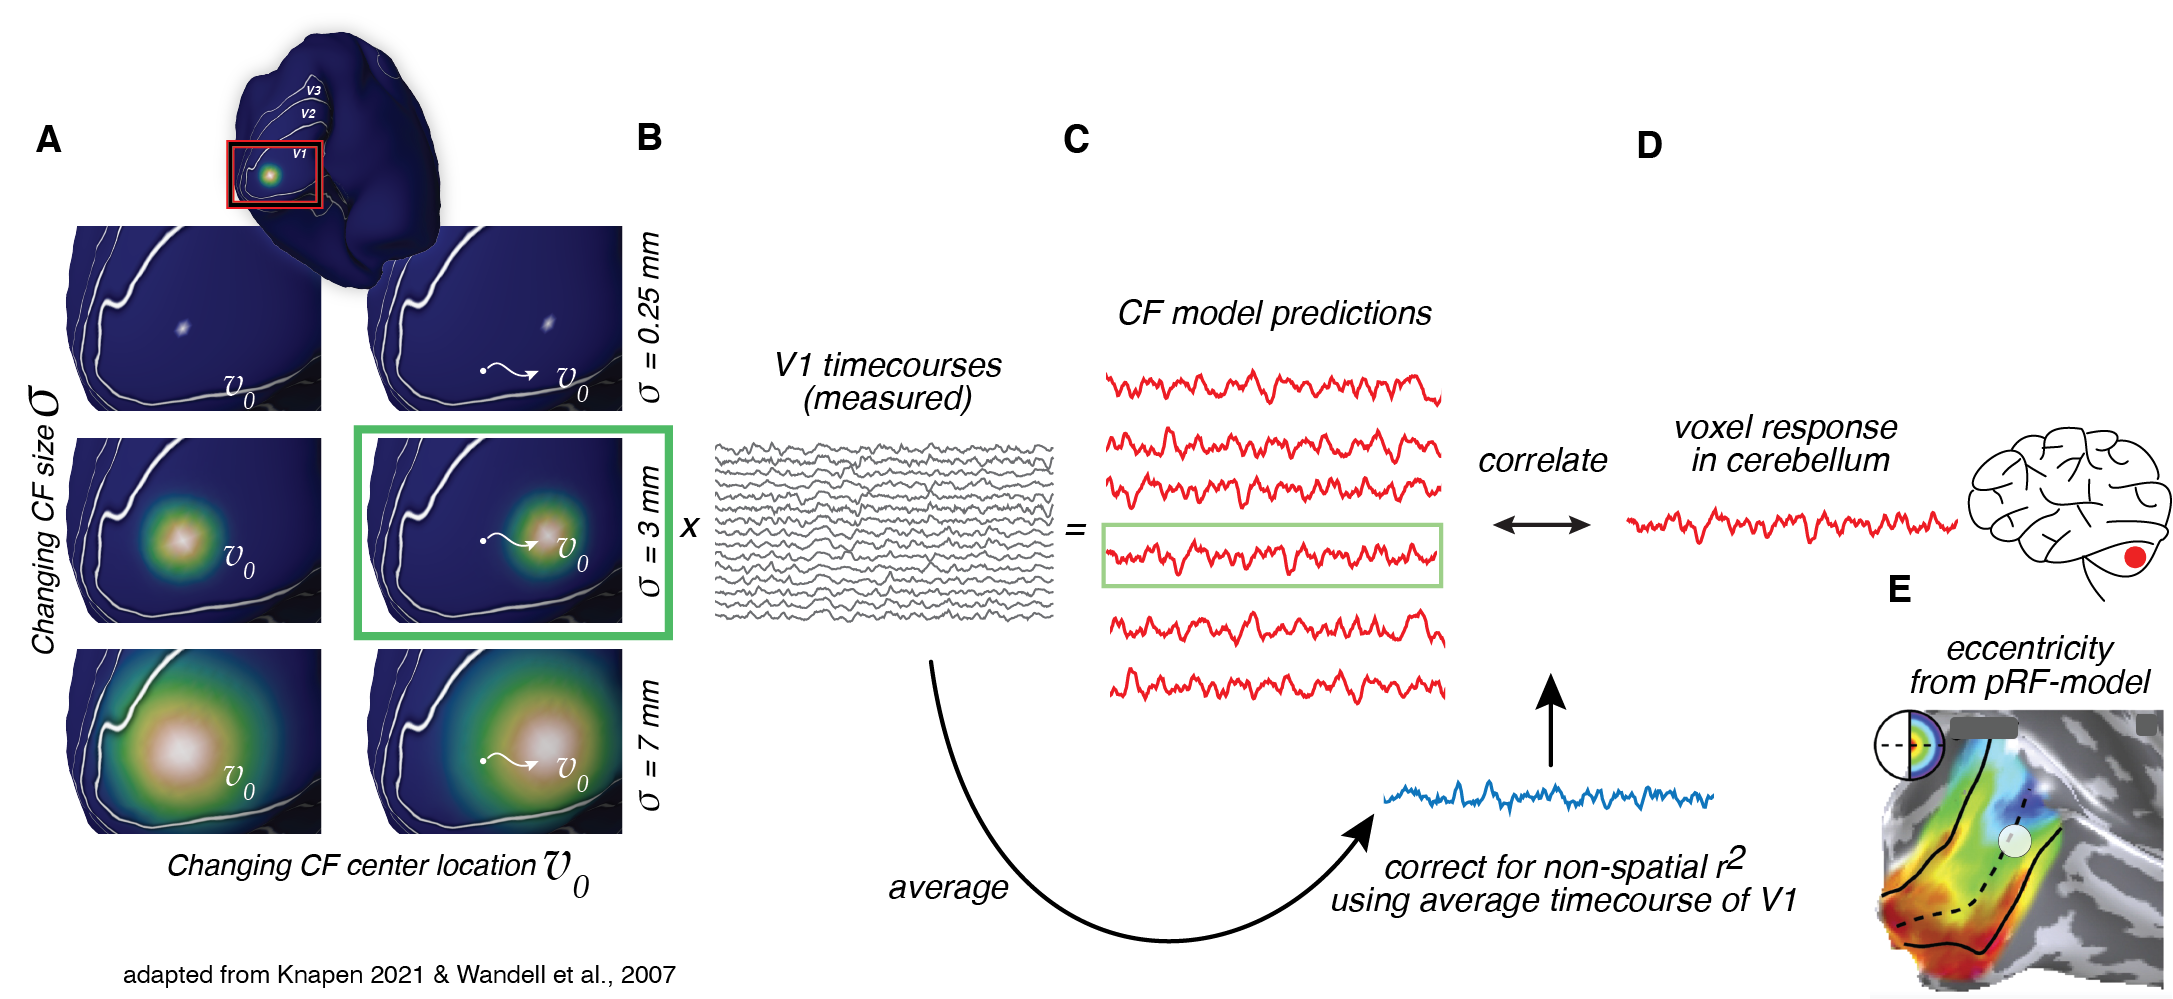
Retinotopic connective field mapping (CF)6,7. A CF is a Gaussian patch on the V1 surface, with position and size parameters. CF model predictions (C) are made for many CFs with different parameters (A) from the CF-weighted sum of the V1 timecourses (B). The CF model with the highest correlation with the measured cerebellar voxel timecourse is selected as the CF of that voxel (green box). Visual field position parameters of the CF are derived from the underlying pRF-parameters (E).
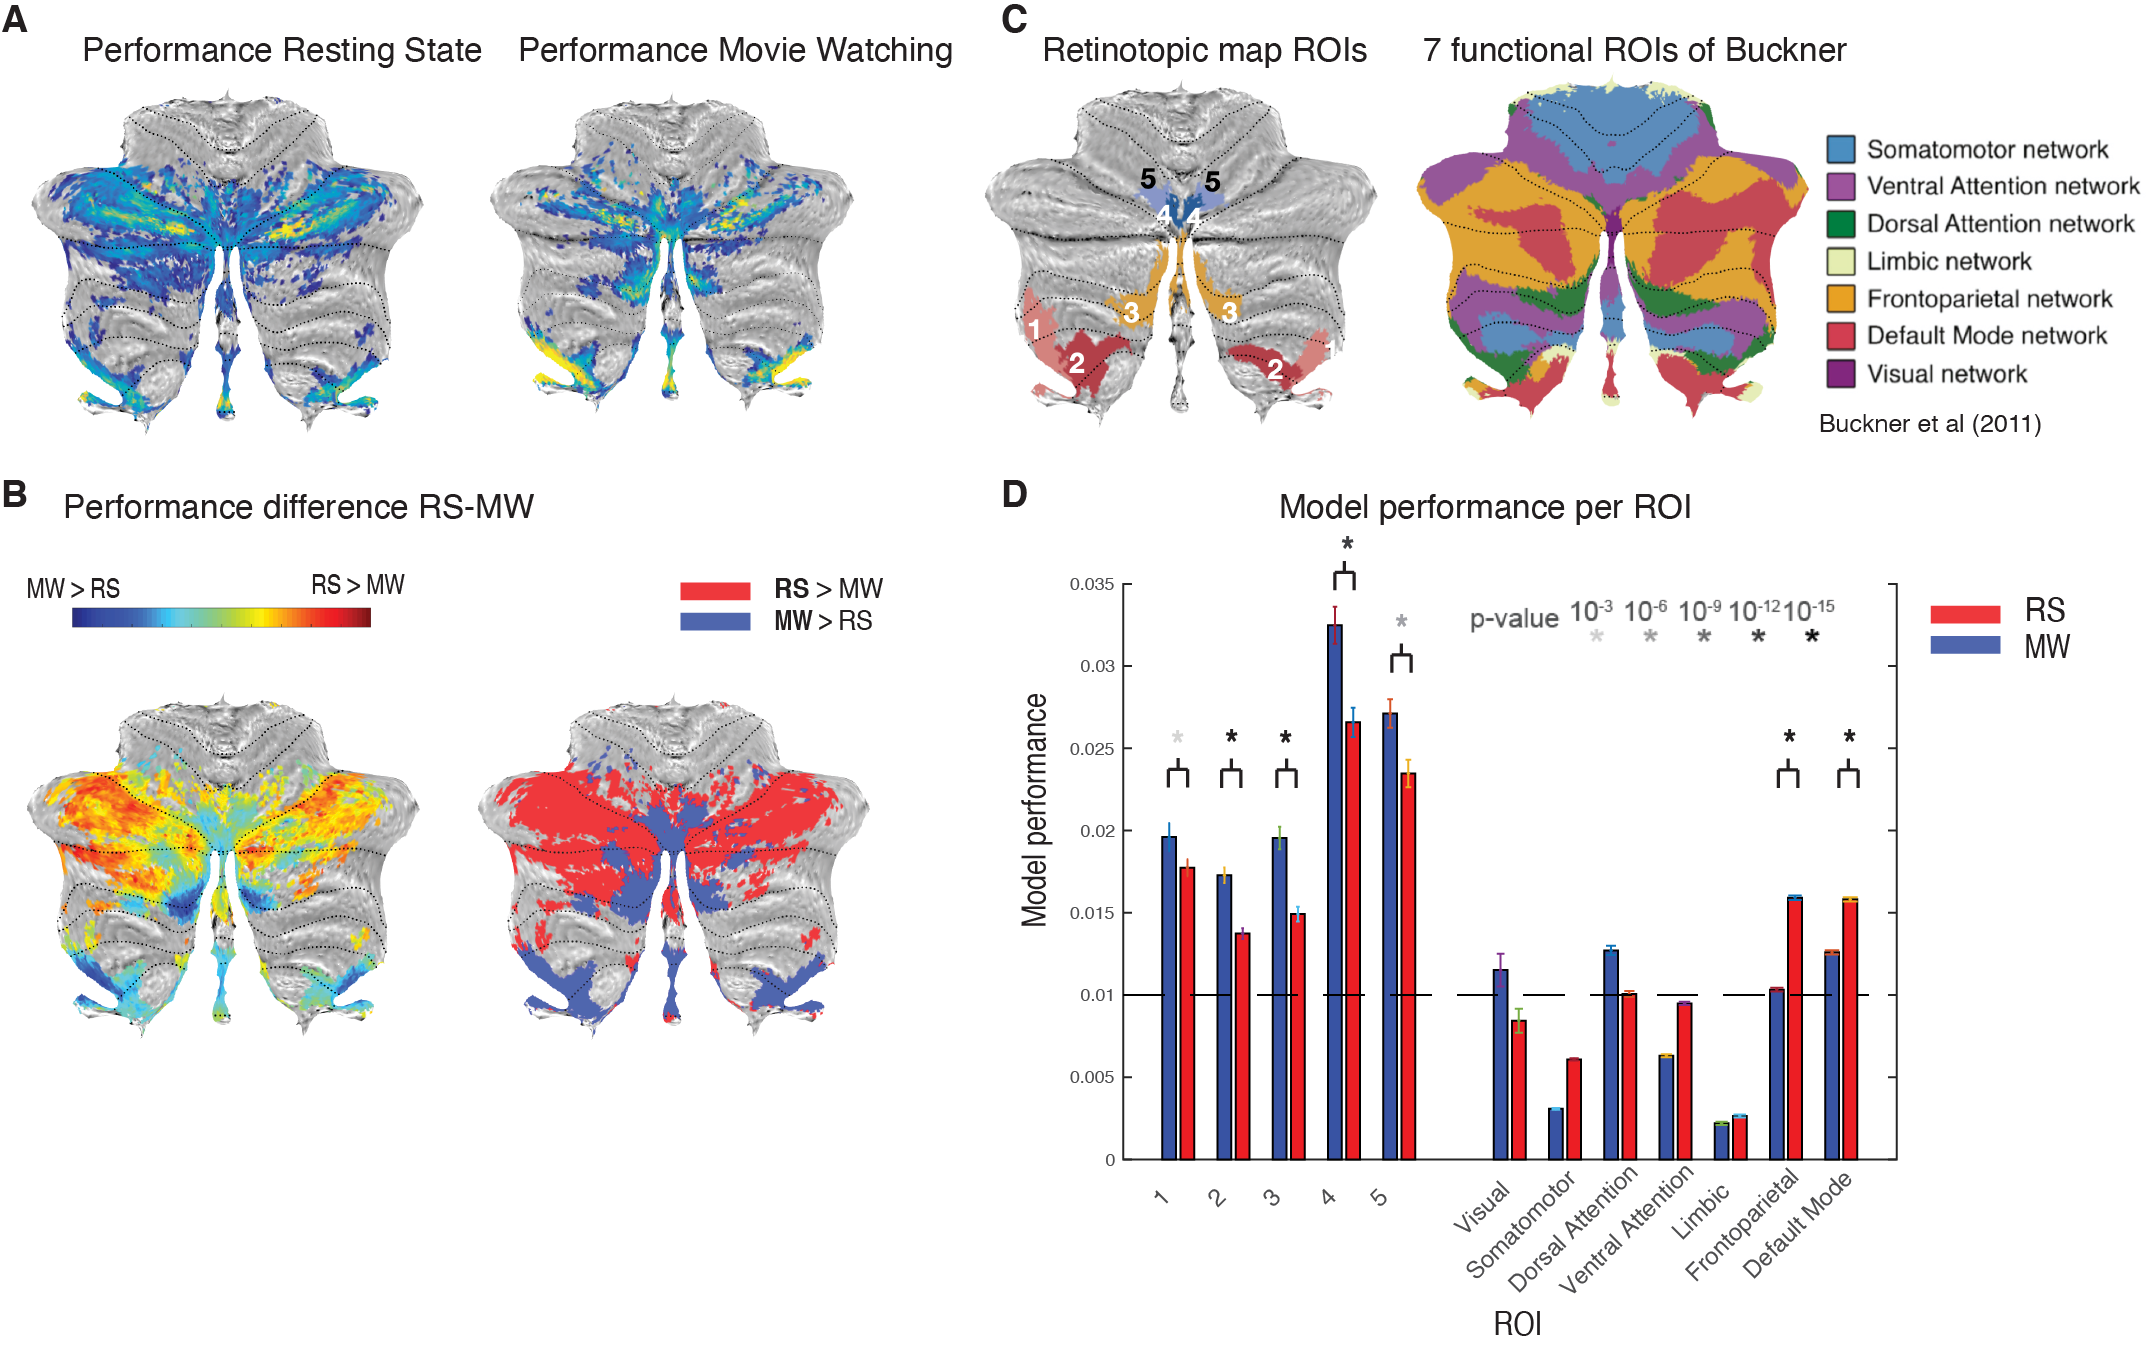
Model fits for RS and MW projected on the SUIT template (A). (B) performance difference for RS and MW (left) and after binarization (right). Blue regions in (B) are the areas where MW outperforms RS, we see that these regions correspond to areas identified in retinotopic mapping (C). (D) Model performance averaged over ROIs.
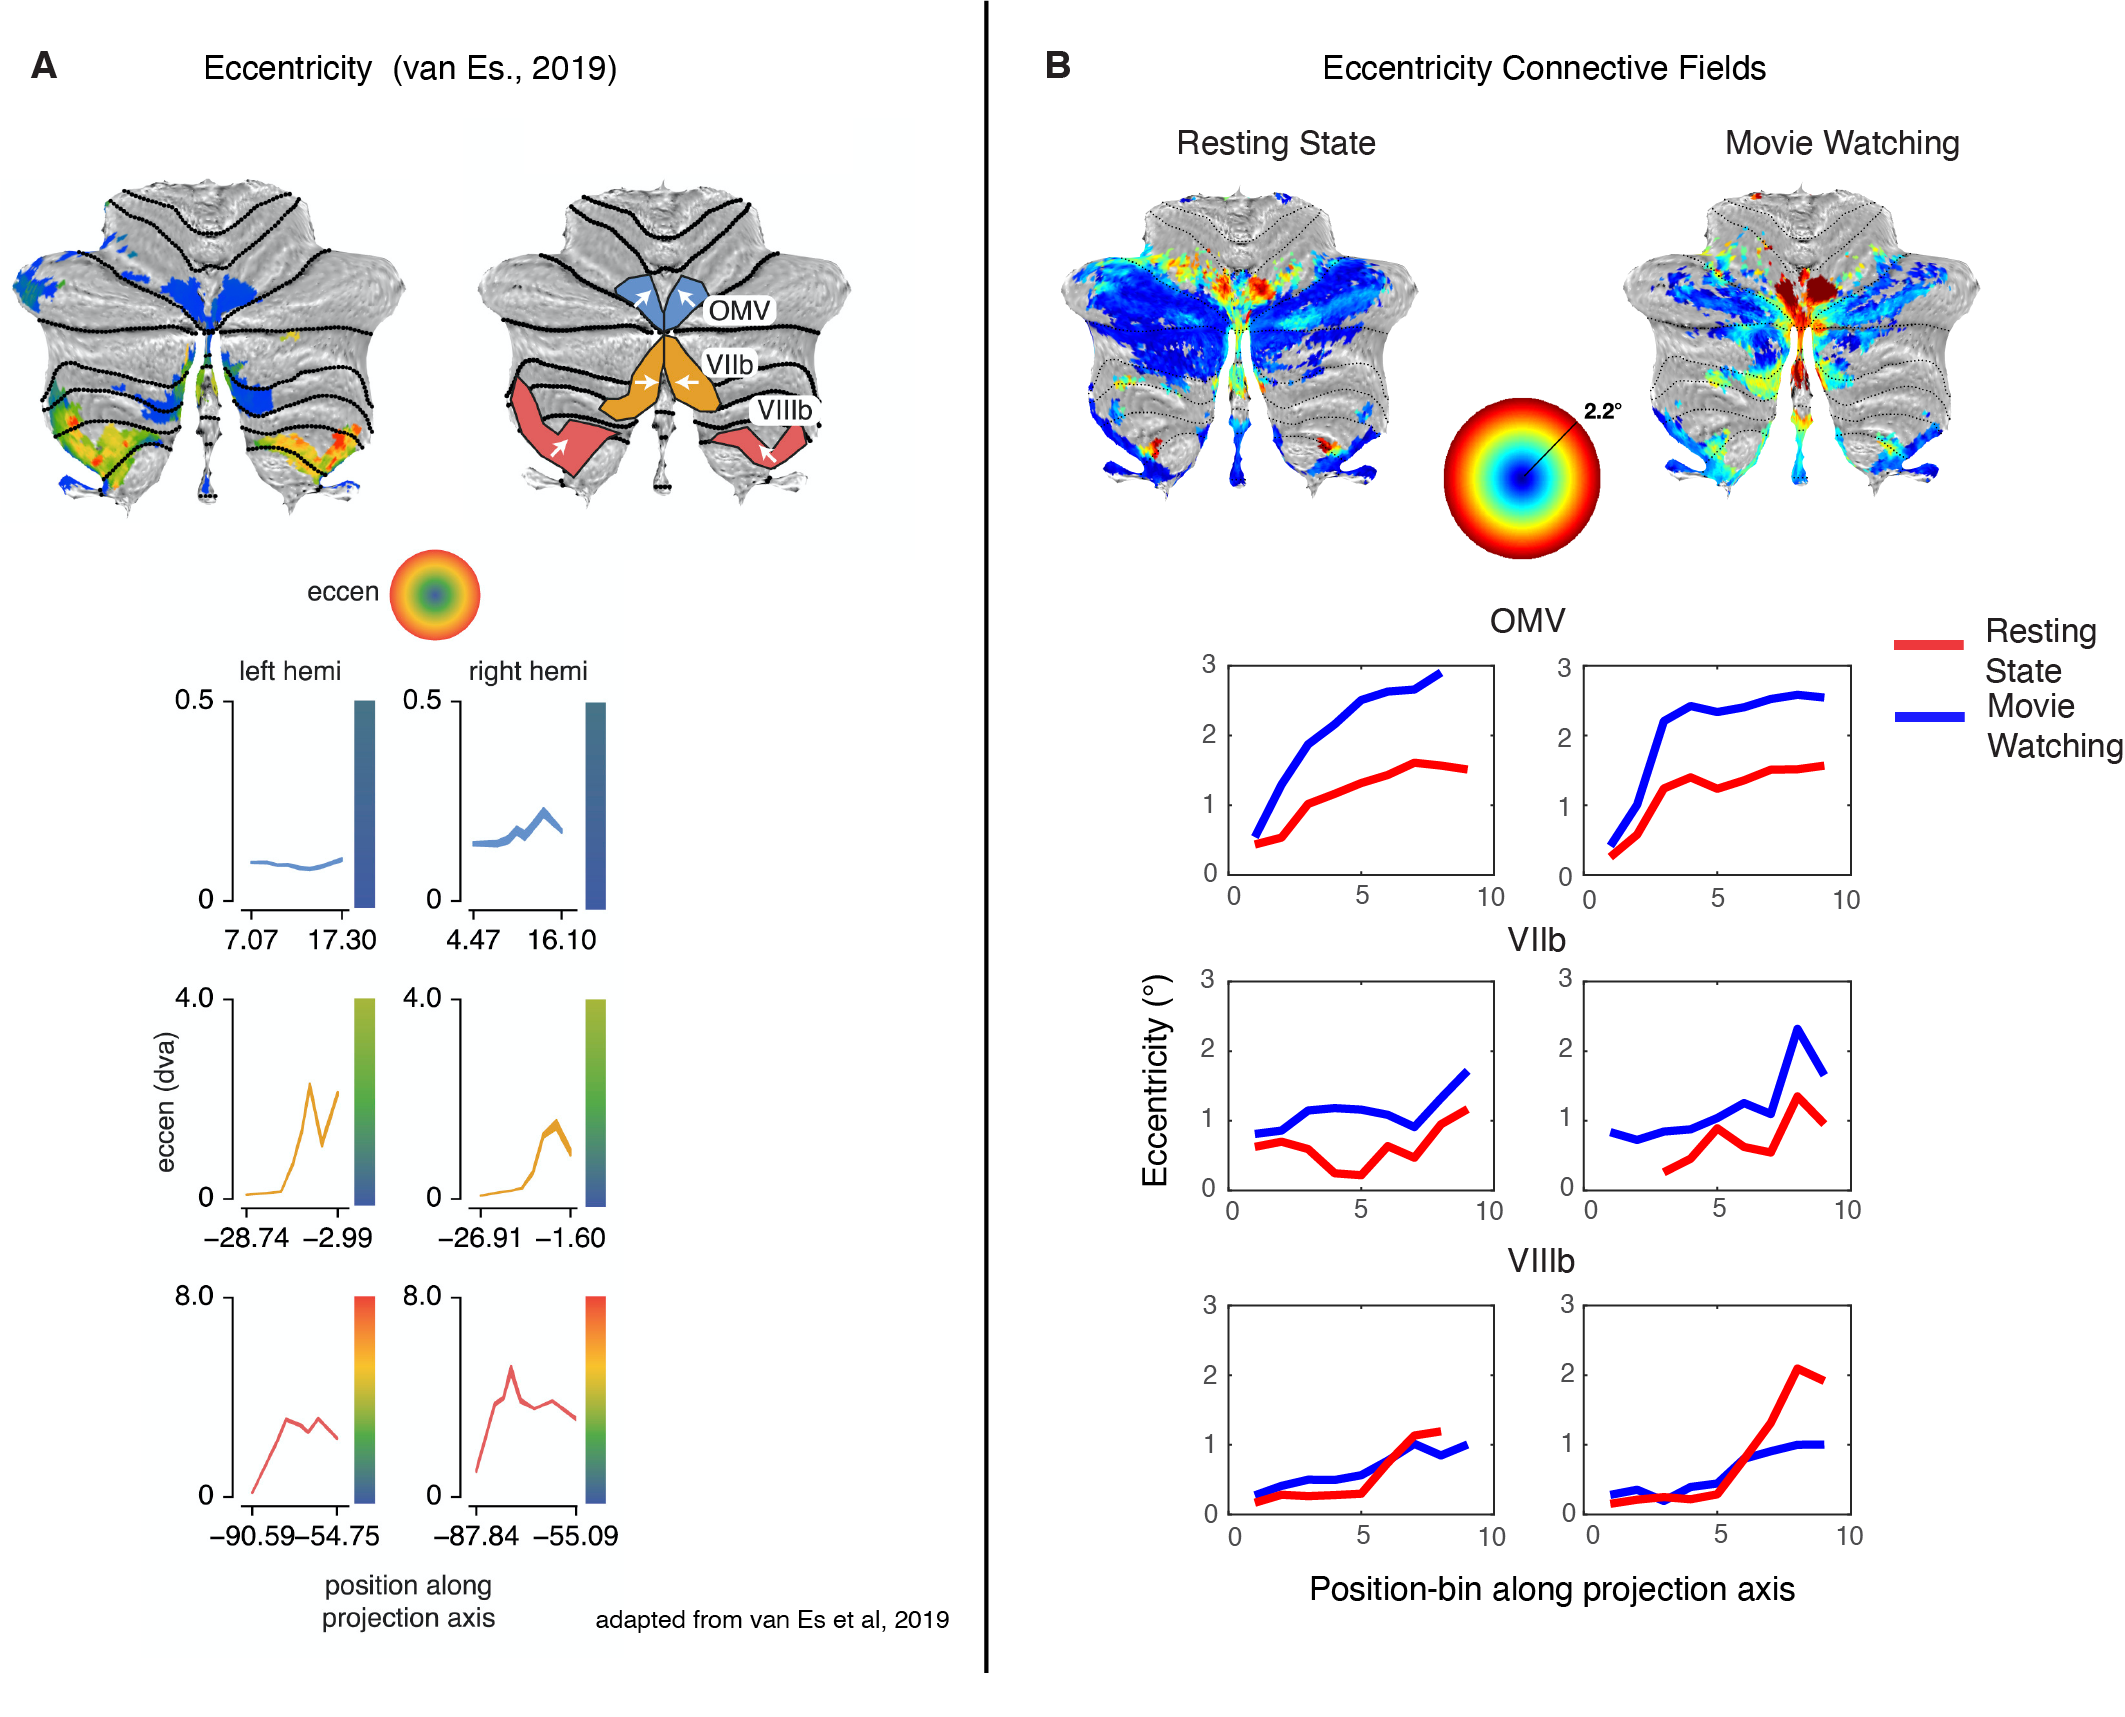
(A) Eccentricity progression as found with the pRF-model1. Line plots average eccentricity measures in the direction of the arrow. (B) Connective field map eccentricity for both MW and RS. OMV (top row) sees, especially for MW, an increase in the progression of eccentricity in (B), but not (A, blue line). VIIb (middle row) and VIIIb (bottom row) show comparable eccentricity progressions in (A) and (B).
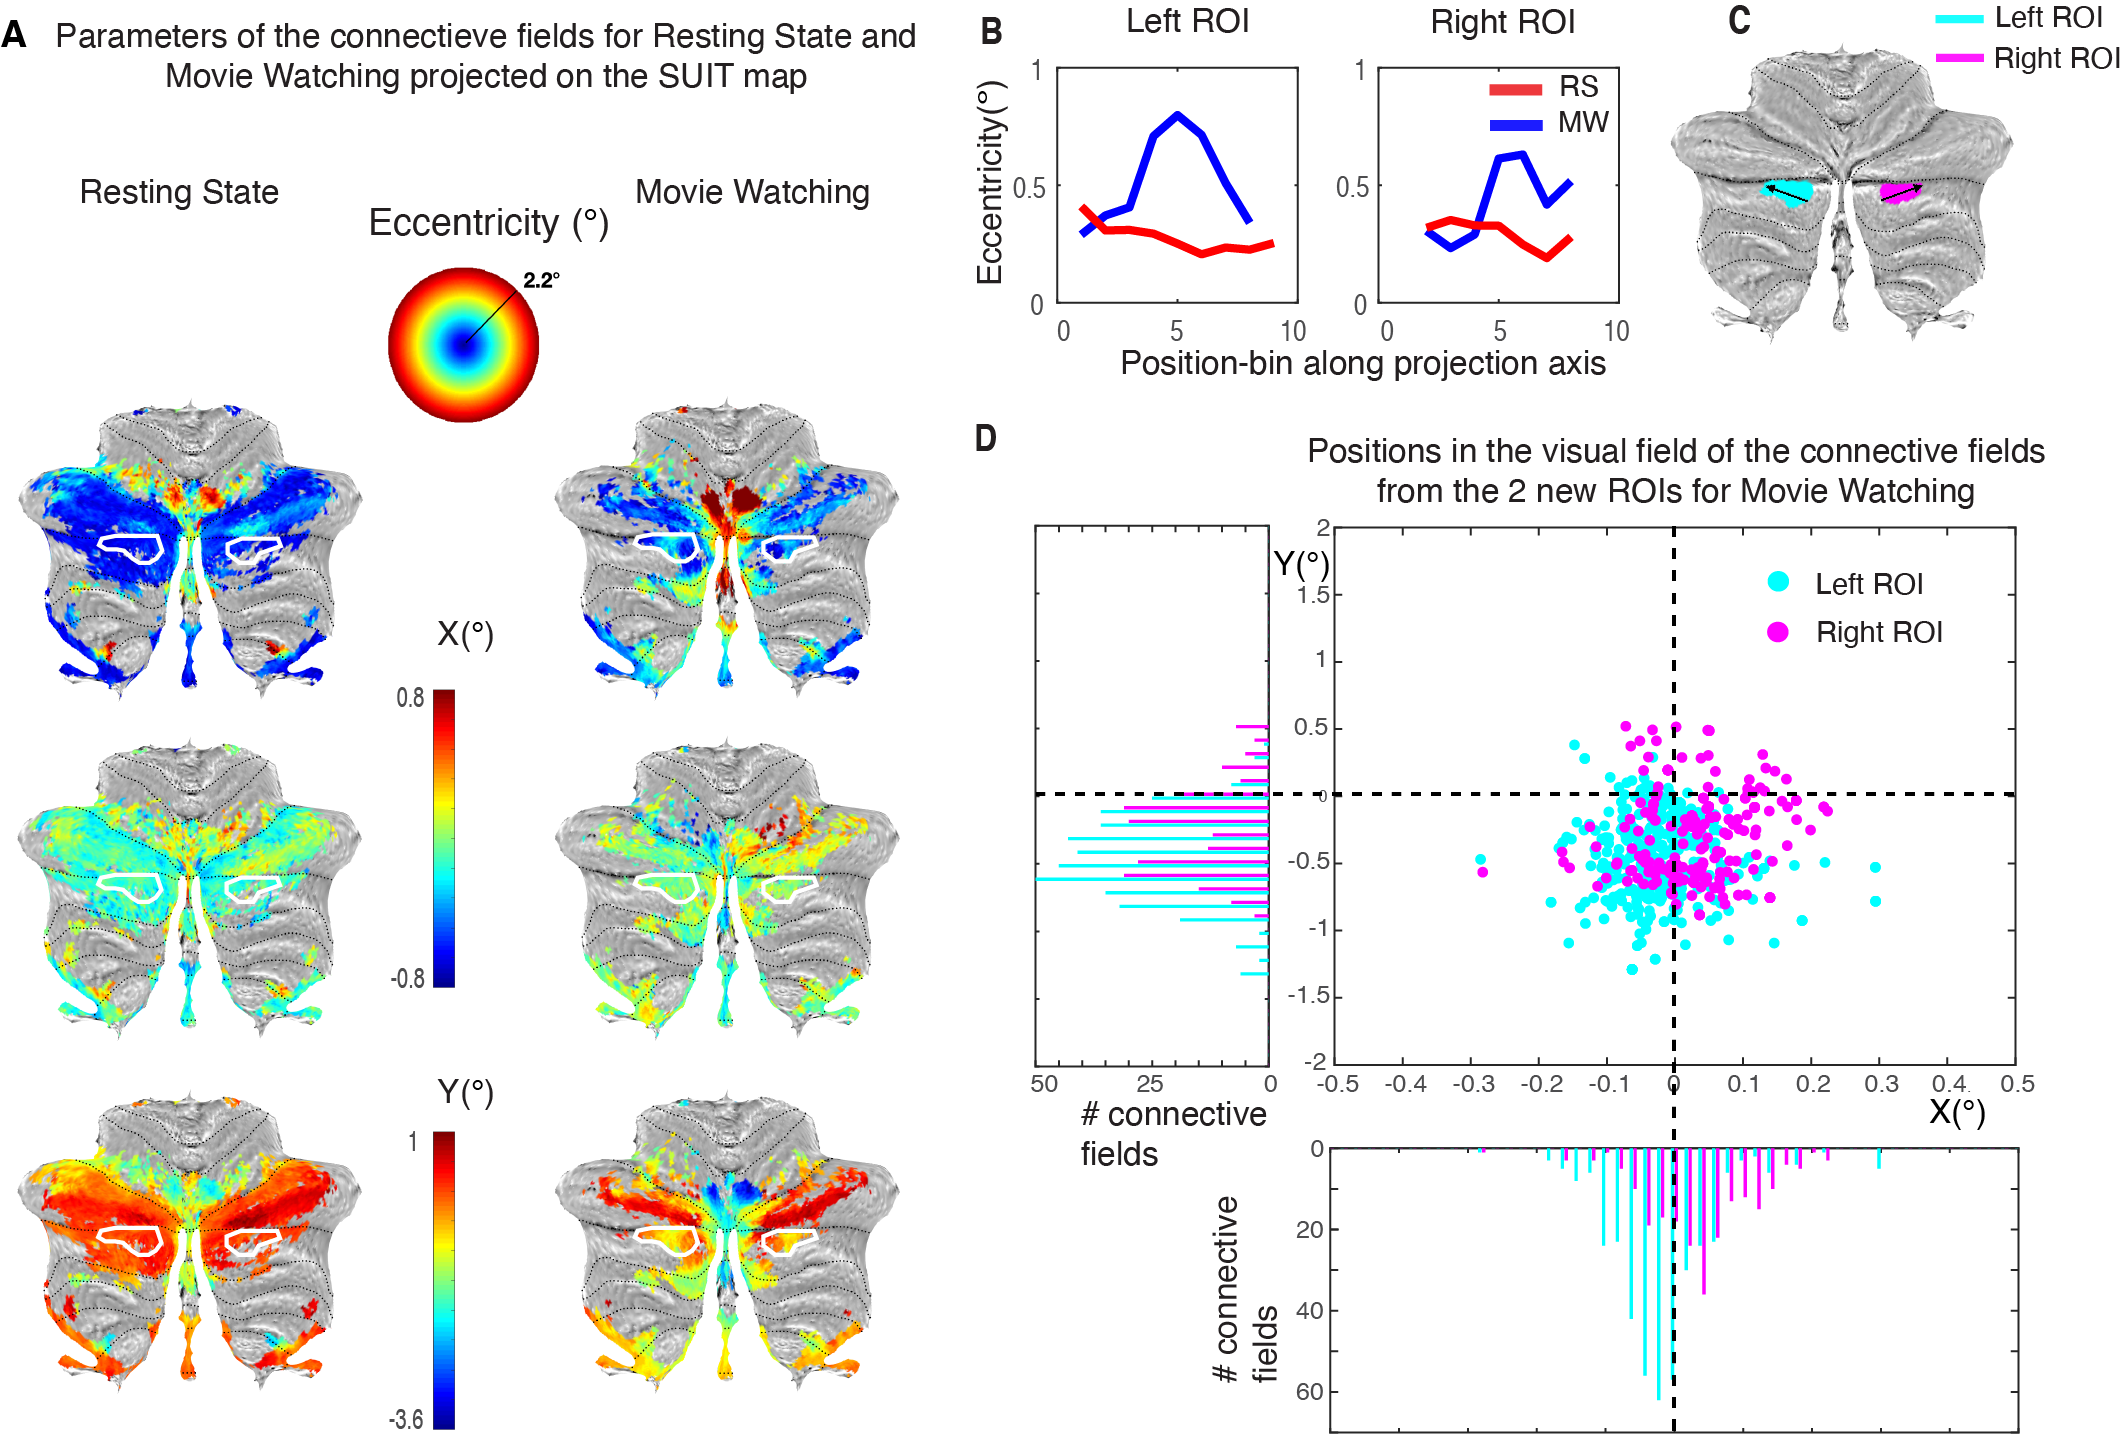
New cerebellar cluster with retinotopic organization during MW. (A) Both the eccentricity and the Y-parameters of the CF show a reversal in the white outlined area (blue-green-blue in eccentricity, red-yellow-red in Y. (B) eccentricity values sampled in the SUIT-map along the direction indicated in (C). (C) Distribution of the CF centers shows an ipsilateral visual field representation (pink right, blue left, in histogram of X) and a bias for the lower visual hemifield (negative Y-axis).
DOI: https://doi.org/10.58530/2022/1733