1731
How does language fMRI activation in tumour patients compare to healthy volunteers?1Neuroradiology, King's College Hospital, London, United Kingdom, 2School of Biomedical Engineering & Imaging Sciences, King's College London, London, United Kingdom, 3Computer Assisted Clinical Medicine, Mannheim Institute for Intelligent Systems in Medicine, Medical Faculty Mannheim, Heidelberg University, Heidelberg, Germany
Synopsis
Task-based language fMRI datasets from healthy volunteers (15) and tumour patients (4 with lesions near Wernicke’s area, 6 with lesions near Broca’s area) were compared, to assess the similarity of activation location and extent. Expected areas of the language network were consistently localised in both patients and volunteers. Although patients showed more variation in the extent and strength of activation, our activation metrics for the full patient cohort show similar amount of overlap compared to a size-matched group of volunteers. Furthermore, patient with lesions near Broca’s area had highly consistent activation in specific locations.
Introduction
Task-based language fMRI is recommended in pre-surgical planning for patients with brain tumours in language areas[1,2], most often used for language function lateralisation. However, additional information derived from spatial maps of language function could inform surgical risk and streamline the surgical procedure[3]. Language mapping is expected to be less successful in patients than healthy subjects, given possible reduction in or displacement of language function, BOLD signal loss[4], and reduced cooperation. This study investigates the differences, in terms of location, extent and strength of activation, between a cohort of brain tumour patients and healthy volunteers.Methods
Functional MRI datasets were acquired from 15 healthy right-handed volunteers and 10 left-hemisphere dominant patients with brain lesions (4 in the temporal lobe, close to Wernicke’s area; 6 in the frontal lobe, close to Broca’s area). The acquisition employed a BOLD EPI sequence (TE/TR=40/3000ms, voxel=2.5x2.5x3 mm3), consisting of 12 rest-task epochs of 30s. Three tasks were performed: Verb Generation, Object Naming and Word Fluency[5]. Per-subject t-maps were generated using SPM12, following registration and smoothing[6]; the maps were normalised to the maximum value in the brain, visual area excluded. Spatially normalised probability maps were also produced; these identify locations with higher probability of activation (consistency) across subjects and were calculated by 1) binarising the parametric maps with a 60% threshold, 2) warping into MNI152 space, and 3) summing across subjects and tasks.Two metrics were calculated:
- Activation Index: this measures both statistical significance and extent of activation from all tasks[7]. It is derived for each subject from the parametric maps (with a 10% cut-off used to remove negative t-values and noise) and is defined as the sum of t-values within language area atlas masks [8], normalised to the number of pixels in the mask and averaged over the three tasks. This is calculated both in Broca’s and Wernicke’s areas.
- Jaccard Index Plot: this quantifies the amount of overlap between subject activation, as captured by the spatially normalised probability maps. It is calculated as the intersection over union (Jaccard Index[9]), plotted as a function of threshold number of subjects with overlapping activation.
Results
The activation probability maps in Figure 1a show activation in both patients and volunteers, consistently located in areas of the language network: significant extent in Broca’s area, limited in Wernicke’s area, and in supporting areas of the language network; Supplementary Motor Cortex and Angular Gyrus. There are common areas of activation between patients and volunteers, however, other areas of activation in the patient group that are not consistently activated in volunteers exist. These are particularly prominent in patients with frontal lobe lesions (Figure1b).Figure 2 shows higher median Activation Index values in Broca’s area than Wernicke’s area, across all subject groups. This indicates greater extent and significance of activation; expected given predominant use of language production tasks. In patients, the Broca’s Activation Index has a larger inter-quartile range - higher variability, compared to volunteers. The temporal lobe lesion patient subset are characterised by lower activation, while patients with frontal lobe lesions show greater variability.
In the Jaccard Index Plot, curves with higher values indicate increased overlap between subjects across a range of threshold number of subjects. The whole patient and matched size volunteer groups have similar curves (Figure3a), but the curve from the subgroup of patients with frontal lobe lesions has higher values, with a difference larger than the confidence interval of a matched size volunteer cohort (Figure3b), indicating more consistently located activation. The opposite is true for the temporal lobe lesion patient subgroup (Figure3c).
Discussion
The reliability and consistency of activation should be considered prior to adopting language mapping in a clinical setting. Therefore, this work retrospectively evaluates the location and the extent of language activation areas in volunteers and brain tumour patients using language lateralisation fMRI datasets. Expected areas of the language network are consistently localised in both patients and volunteers, despite possible alterations to patient activation based on lesion location. Although patients show more variation in the extent and strength of activation (Activation Index, Figure2), the Jaccard Index for the full patient cohort shows similar levels of overlap to a group of volunteers. In particular, patient with lesions in the frontal lobe have highly consistent activation in specific areas (Figure1b, Figure3b).Here we consider differences in activation within subgroups categorised by lesion location. However, these patient subgroups are small, limiting the significance of these observations. Future work will expand these cohorts.
The creation of probability maps in standard space relies on a number of processing steps, including image registration in the presence of abnormalities. Although this process was qualitatively evaluated to be satisfactory, the influence of these steps on the resulting maps should also be subject to systematic investigation in the future.
Conclusion
Despite the expected variation in functionality between subjects and the presence of abnormality, this work suggests that areas of consistent activation can be identified in the studied cohort of patients. This supports the feasibility and value of clinical pre-surgical language mapping, subject to validation with intra-operative findings.Acknowledgements
This work was carried out at, and supported by, the Department of Neuroradiology at King’s College Hospital NHS Foundation Trust. EDV is supported by the Wellcome EPSRC Centre for Medical Engineering (WT 203148/Z/16/Z). The views expressed are those of the authors and not necessarily those of the NHS, the NIHR or the Department of Health.References
[1] Black, D. F., Vachha, B., Mian, A., Faro, S. H., Maheshwari, M., Sair, H. I., Petrella, J. R., Pillai, J. J., & Welker, K. (2017). American society of functional neuroradiology-recommended fMRI paradigm algorithms for presurgical language assessment. American Journal of Neuroradiology, 38(10), E65–E73.
[2] Agarwal, S., Sair, H. I., Gujar, S., & Pillai, J. J. (2019). Language Mapping with fMRI: Current Standards and Reproducibility. In Topics in Magnetic Resonance Imaging (Vol. 28, Issue 4, pp. 225–233). Lippincott Williams and Wilkins.
[3] S. Dimou, S., Battisti, R. A., Hermens, D. F., & Lagopoulos, J. (2013). A systematic review of functional magnetic resonance imaging and diffusion tensor imaging modalities used in presurgical planning of brain tumour resection. Neurosurgical Review, 36(2), 205–213.
[4] Silva, M. A., See, A. P., Essayed, W. I., Golby, A. J., & Tie, Y. (2018). Challenges and techniques for presurgical brain mapping with functional MRI. NeuroImage: Clinical, 17, 794–803.
[5] Brumer, I., de Vita, E., Ashmore, J., Jarosz, J., & Borri, M. (2020). Implementation of clinically relevant and robust fMRI-based language lateralization: Choosing the laterality index calculation method. PLoS ONE, 15(3).
[6] Friston, K., Asburner, J.T., Kiebel, S.J., Nichols, T.E., Penny, W.D. (2007). Statistical Parametric Mapping: the analysis of functional brain images.
[7] Wei, X., Yoo, S. S., Dickey, C. C., Zou, K. H., Guttmann, C. R. G., & Panych, L. P. (2004). Functional MRI of auditory verbal working memory: Long-term reproducibility analysis. NeuroImage, 21(3), 1000–1008.
[8] Caviness, V. S., Meyer, J., Makris, N., & Kennedy, D. N. (1996). MRI-Based Topographic Parcellation of Human Neocortex: An Anatomically Specified Method with Estimate of Reliability. Journal of Cognitive Neuroscience, 8(6), 566–587.
[9] Jaccard, P. (1912). The Distribution of the Flora in the Alpine Zone. The New Phytologist, 11(2), 37–50.
Figures
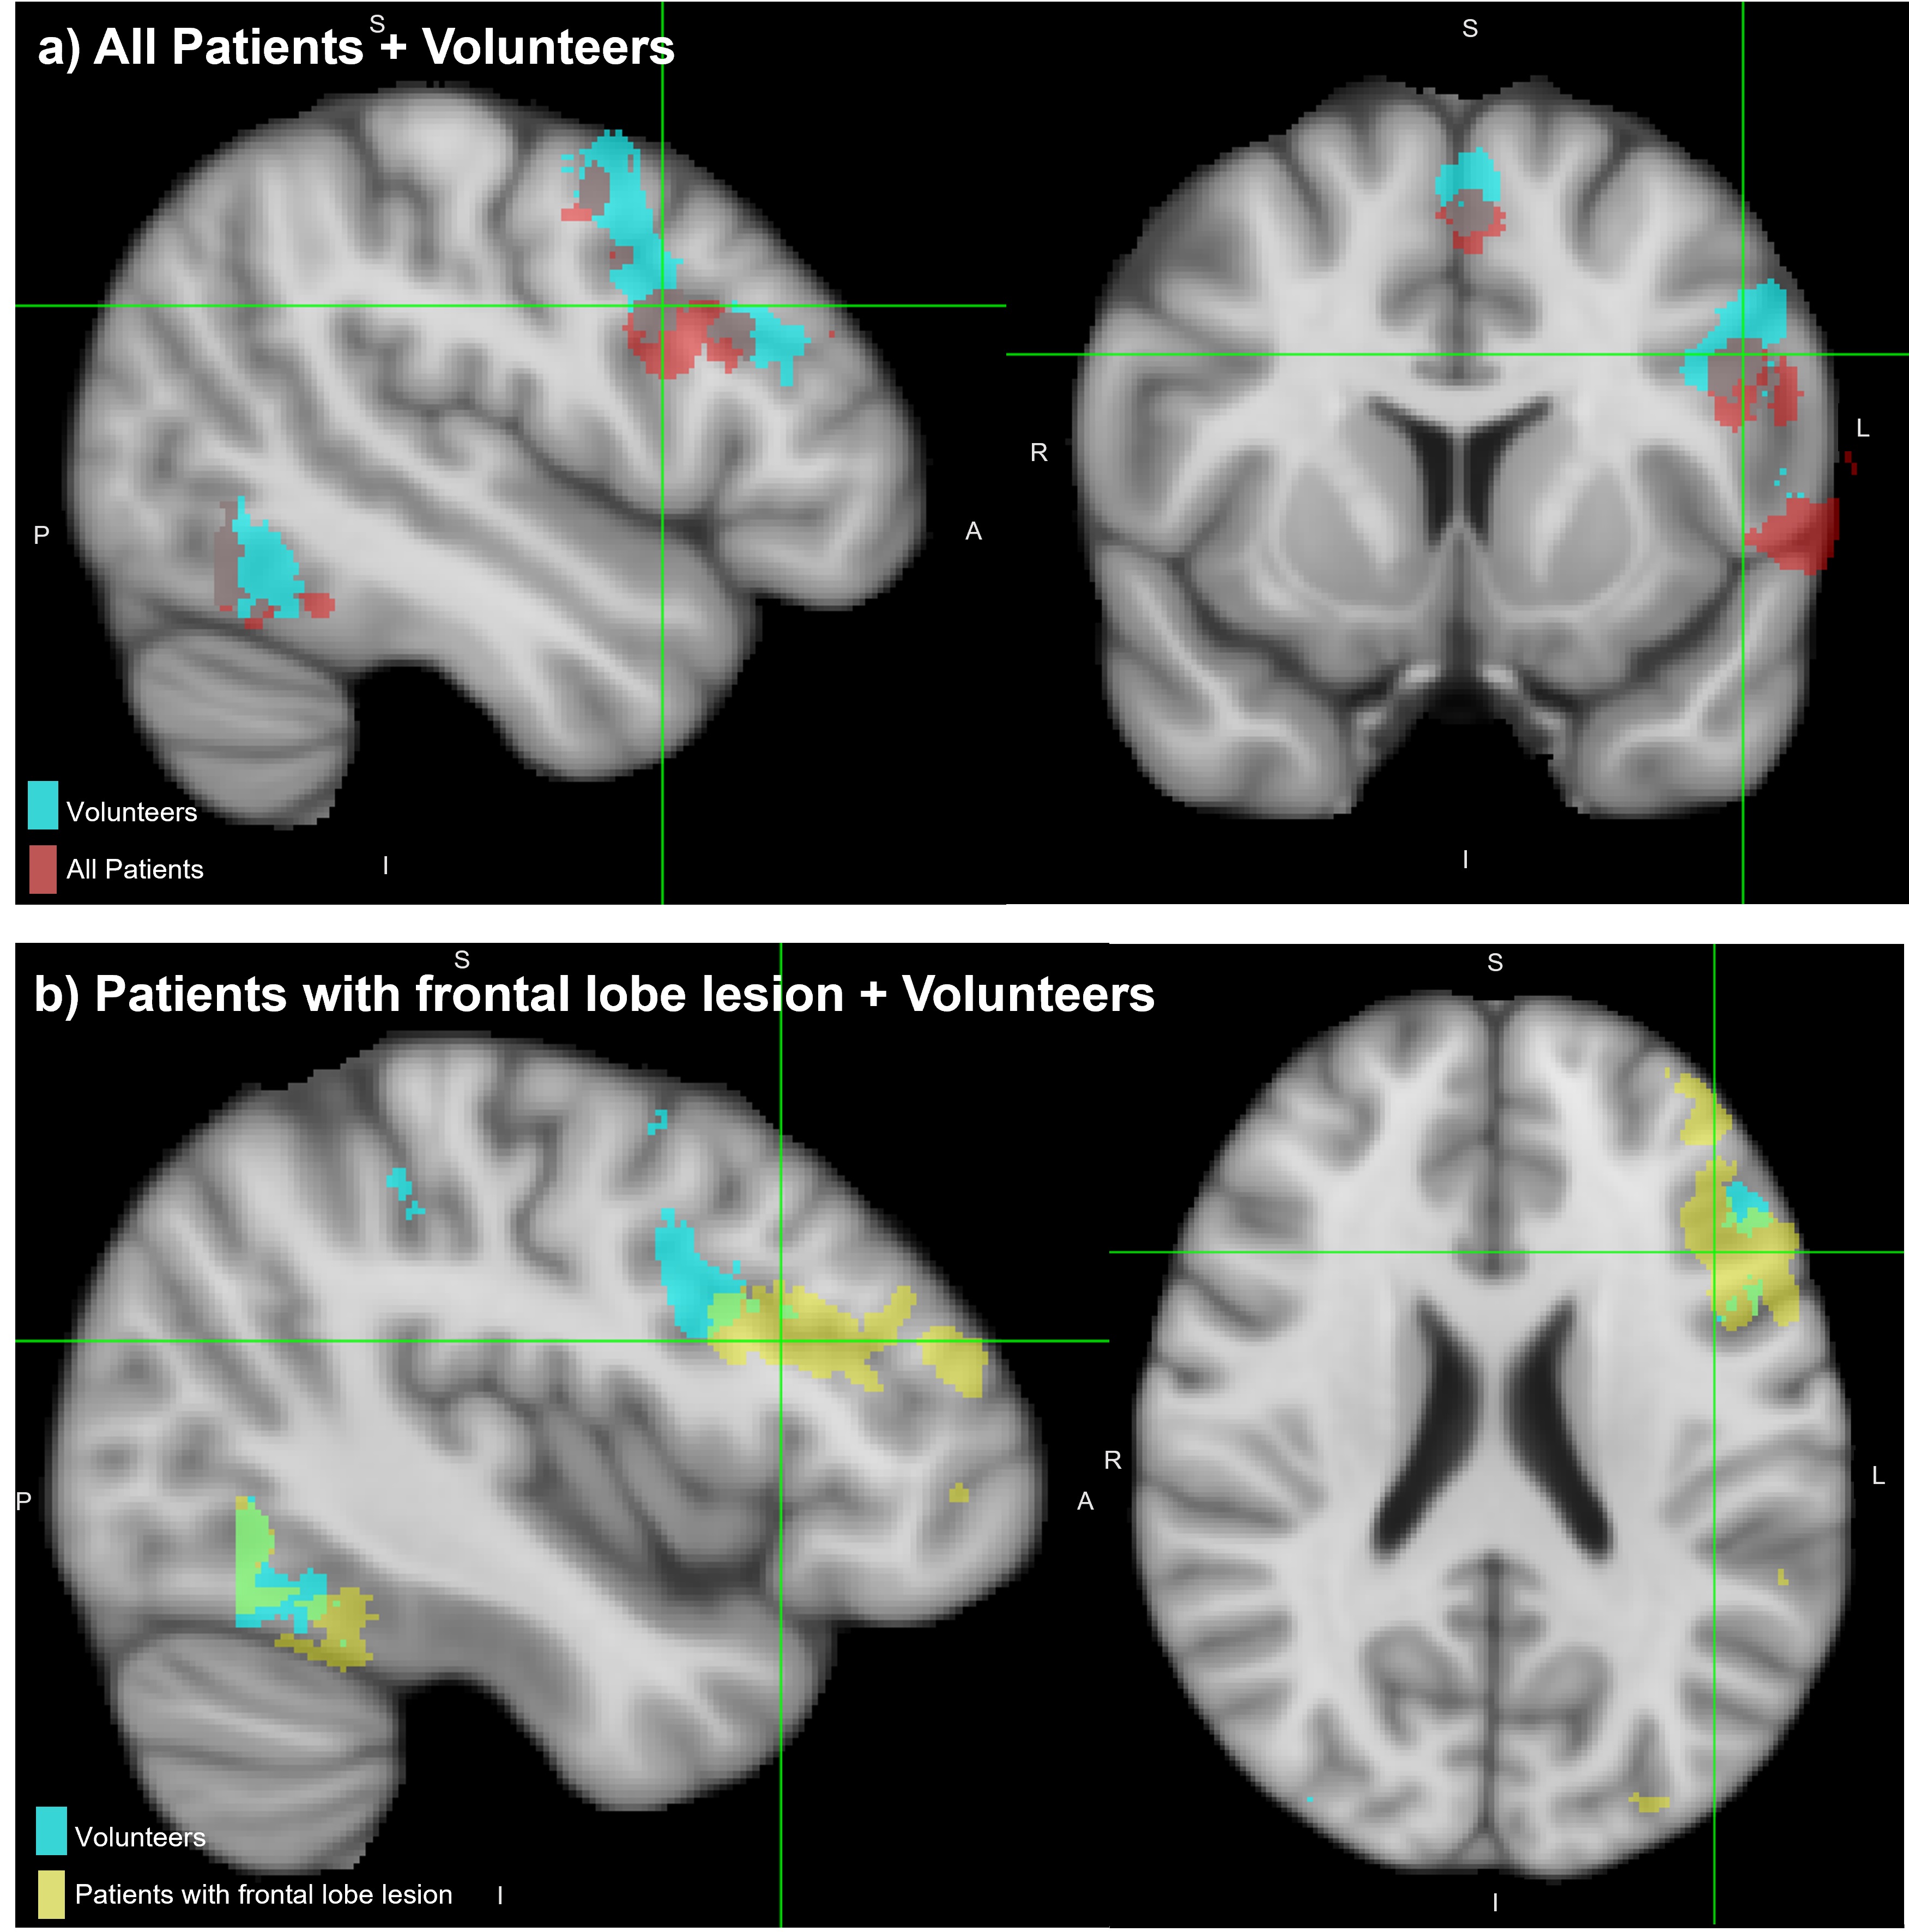
Figure 1: Spatially normalised activation probability maps, binarised to activation in >35% of the respective cohort.
a) activation in whole patient cohort (red) overlaid on volunteers (light blue)
b) activation in patients with frontal lobe lesions (yellow) overlaid on volunteers (light blue).
Views centred on patients’ activation within Broca’s area, overlaid onto T1-weighted MNI152 brain.
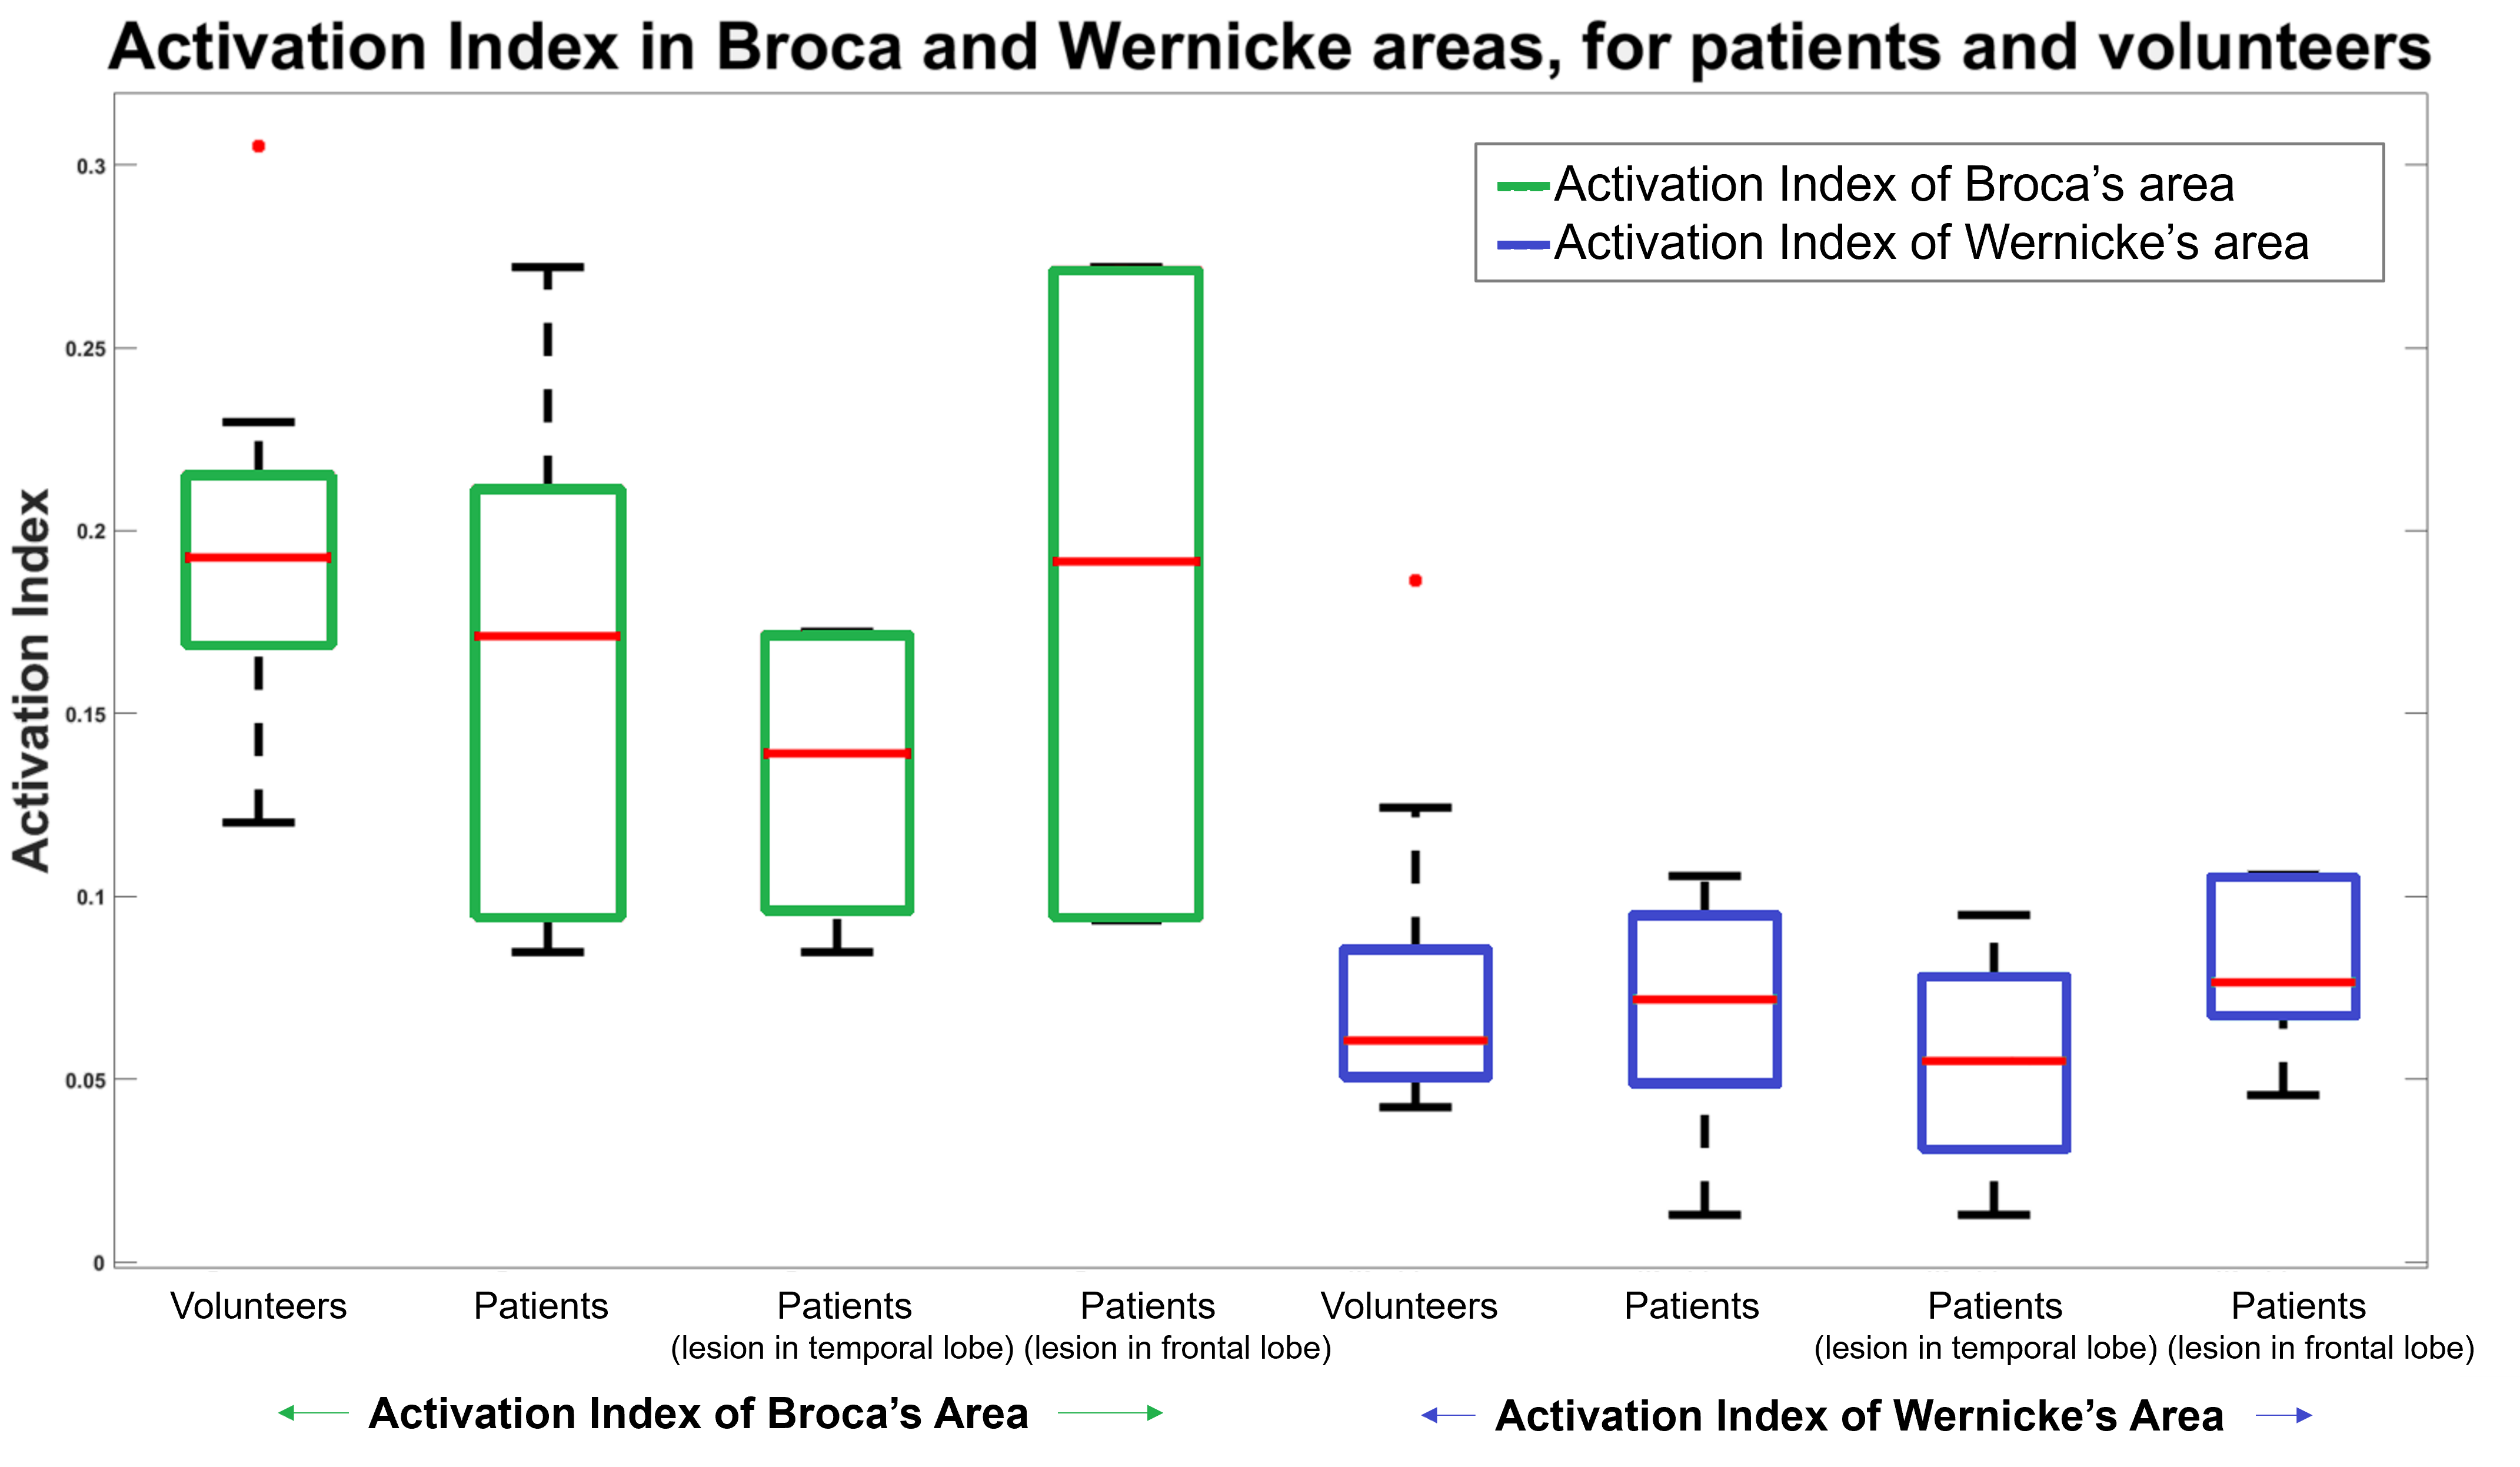
Figure 2: Boxplot of Activation Index values; median (red bar) and inter-quartile range; for groups of Volunteers, Patients, Patients with temporal lobe lesions, Patients with frontal lobe lesions.
The Activation Indices are calculated for a Broca’s area mask (left, green) and a Wernicke’s area mask (right, blue).
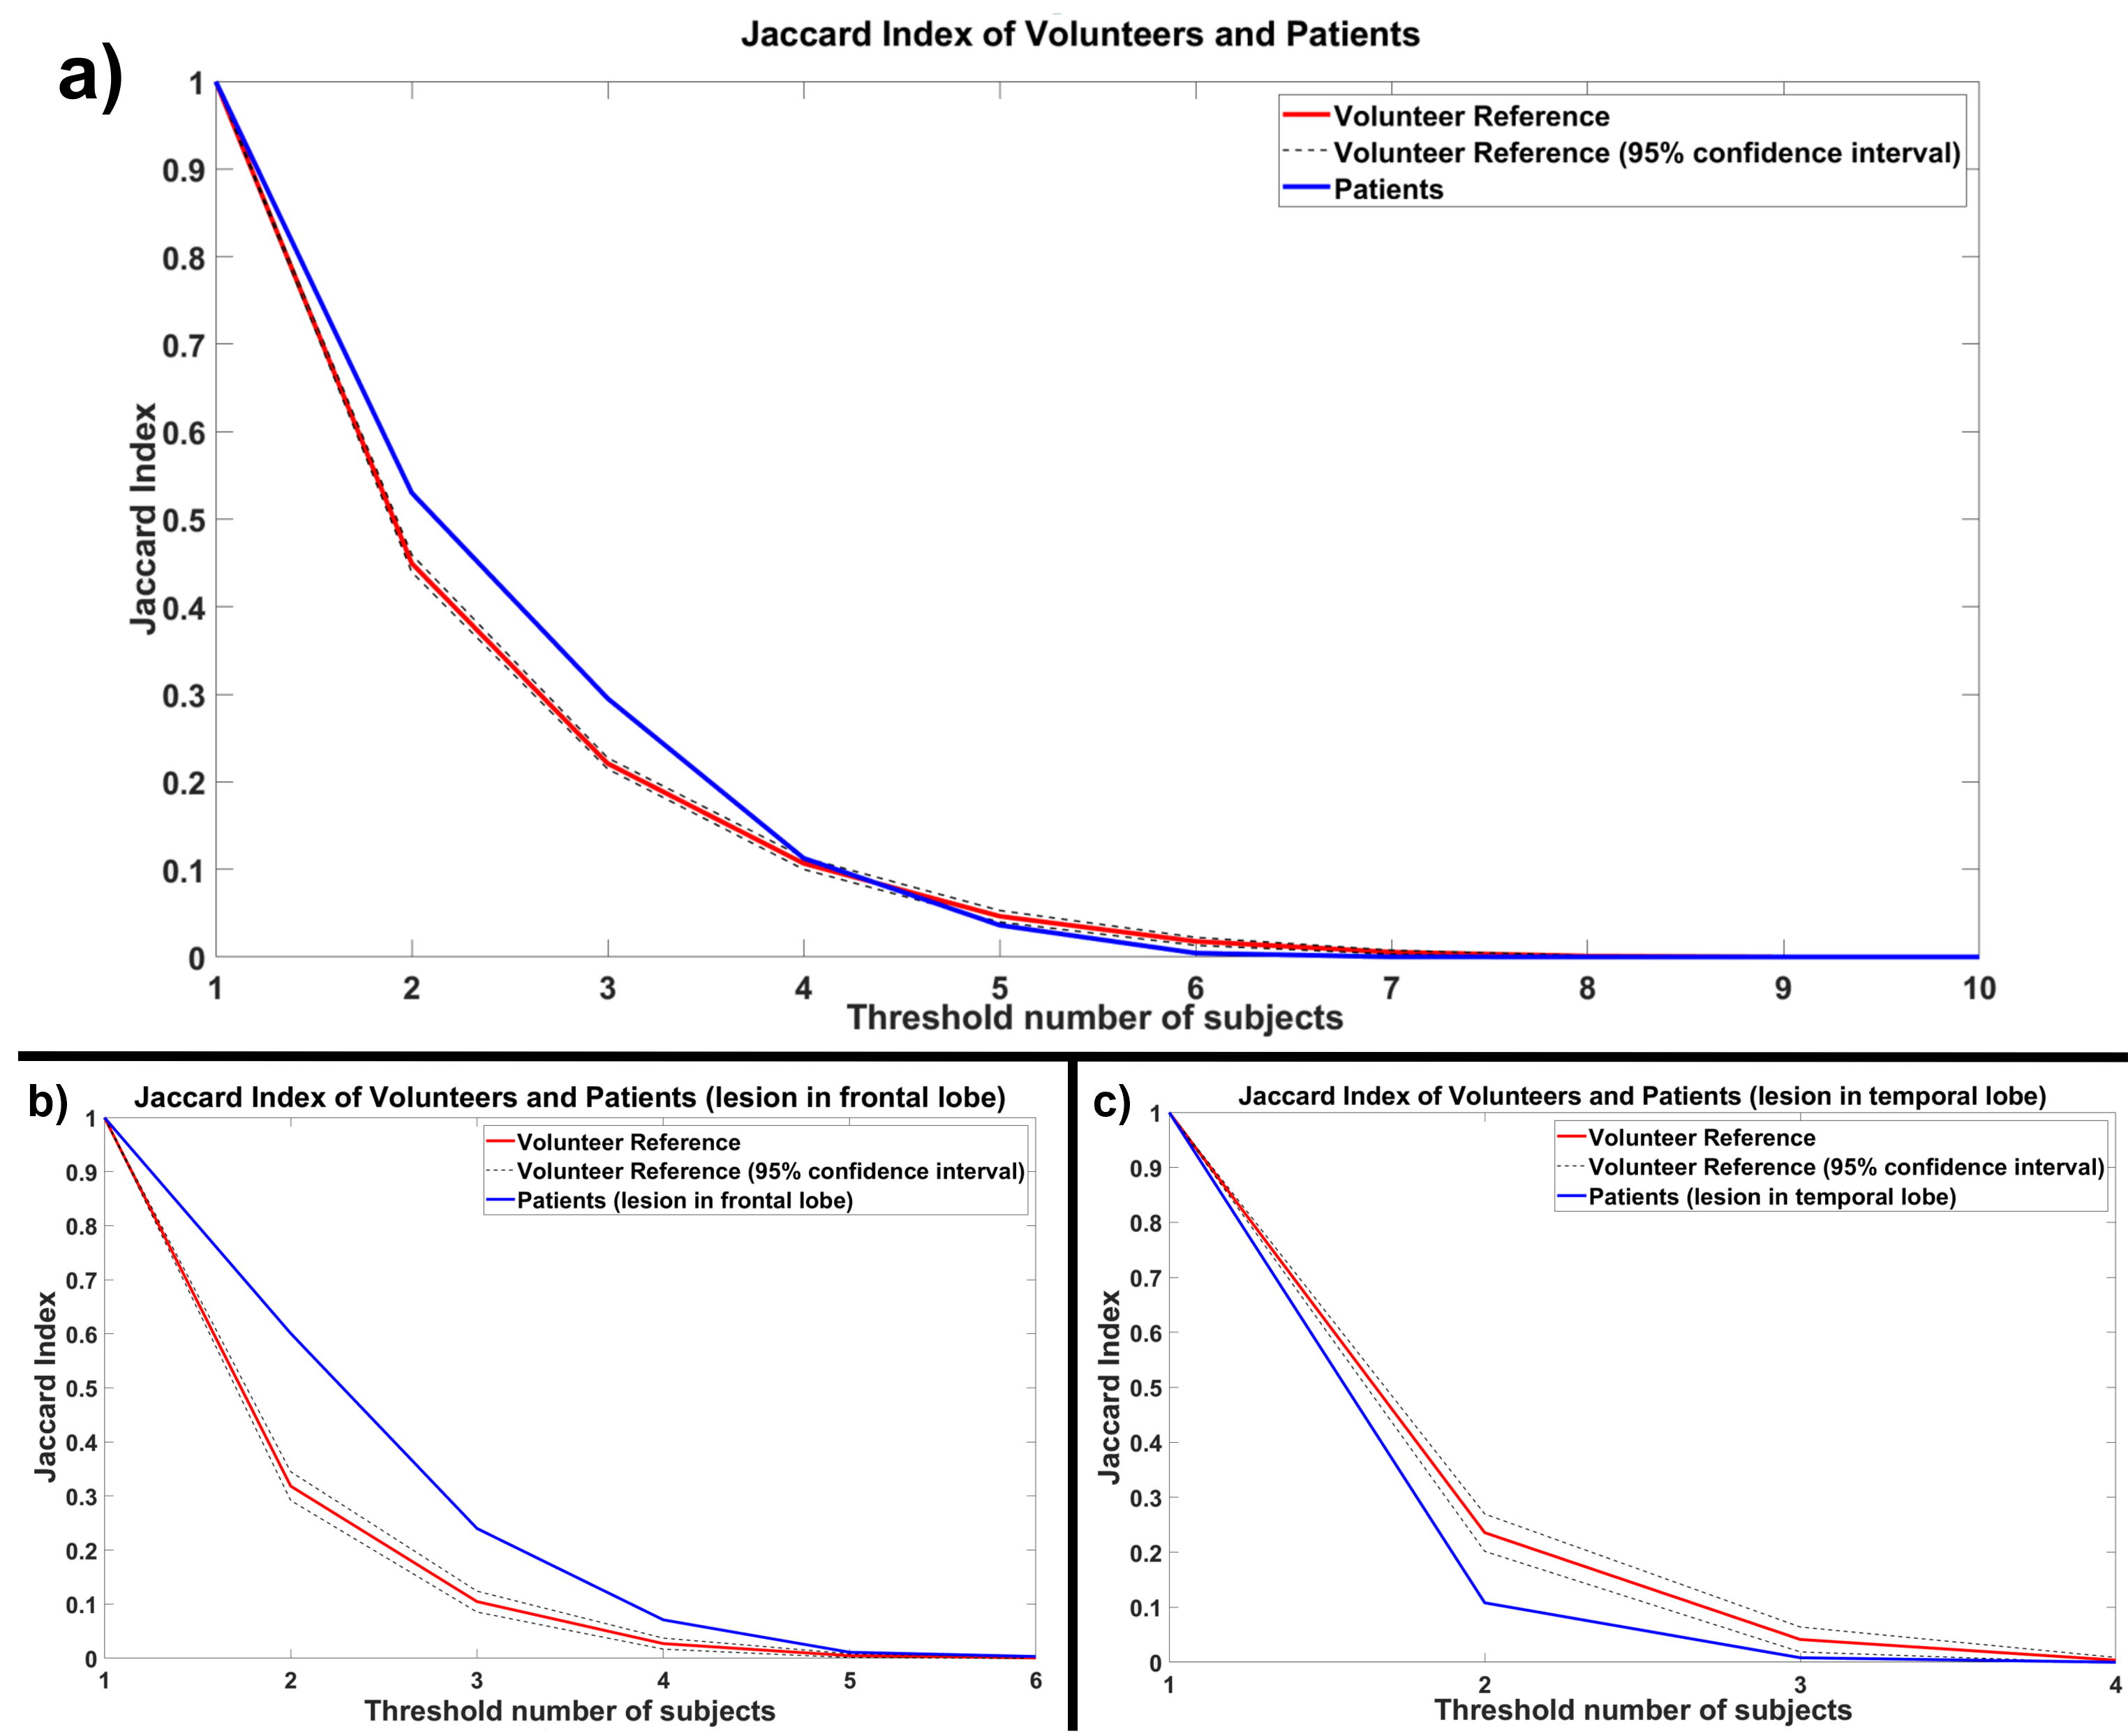
Figure 3: Jaccard Index Plot for a) Patients, b) Patients with frontal lobe lesion, c) Patients with temporal lobe lesion (blue lines) compared to volunteer reference (red line).
This reference is constructed from repeated random sampling of the volunteer cohort, with a subset size matching the number of patient subjects. This repeated sampling enabled calculation of a 95% confidence interval for this Jaccard Index of the reference volunteer group (displayed as a black dotted line). Curves are plotted as a function of the threshold number of subjects with overlapping activation.