1730
A diffusion MRI tractometry approach in cerebral small vessel disease1Radboud University, Donders Institute for Brain, Cognition, and Behavior, Nijmegen, Netherlands, 2Department of Neurology, Radboud University, Donders Institute for Brain, Cognition, and Behavior, Nijmegen, Netherlands, 3University Hospital, LMU Munich, Institute for Stroke and Dementia Research (ISD), Munich, Germany, 4VASCage, Research Centre on Vascular Ageing and Stroke, Innsbruck, Austria, 5University Medical Center Utrecht, Image Science Institute, Utrecht, Netherlands, 6School of Physics, Cardiff University Brain Research Imaging Centre, Cardiff, United Kingdom, 7Department of Biomedical Engineering, University of Basel, Medical Image Analysis Center (MIAC) and qbig, Basel, Switzerland
Synopsis
In a cohort of 54 patients with sporadic cerebral small vessel disease, associations between diffusion MRI measures and processing speed were investigated both at low and high b-values, revealing complementary microstructural information. Associations with processing speed found by skeletonization were confirmed with an independent tractometry approach, which was further utilized to identify a set of association tracts associated with cognition.
Introduction
Cerebral small vessel disease (SVD) is the most common vascular cause of cognitive impairment and dementia, often resulting in significant disability and reduced quality of life[1]. SVD is traditionally characterized by white matter hyperintensities, lacunes, and microbleeds, however, they are generally weakly associated with clinical features. Diffusion tensor imaging (DTI) measures have been shown to be sensitive to white matter damage in SVD. In this regard, the peak-width of skeletonized mean diffusivity (PSMD[2]) has been extensively used as an imaging marker for SVD. The calculation of PSMD relies on the creation of a ‘tract skeleton’ using the tract-based spatial statistics (TBSS[3]) toolbox, and on characterizing the diffusion MRI signal using DTI. However, methodological considerations related to TBSS may impact the characterization of microstructural changes[4]. For example, the results can be confounded by misregistration, diffusion measures from nearby voxels can be misassigned, and the effect of interest may be missed if it leads to a locally low fractional anisotropy (FA). Tractometry is an alternative approach, which aims to address some of these confounds while providing anatomical-tract specificity, and maps measures along the course of pathways reconstructed by tractography[5]. Furthermore, changes in DTI measures may be associated with changes in multiple compartments, such as intra-, extra-axonal or free water. This work compares the association of diffusion measures with processing speed deficits (i.e., the main cognitive deficit in SVD) in different scenarios: 1) skeletonization vs tractometry, and 2) DTI-derived MD vs model-free signal representations related to the intra-cellular microstructure, both for the peak-width and mean of the measures.Methods
Data acquisition:We used data from the RUN DMC – InTENse study (Radboud University Nijmegen Diffusion tensor and Magnetic resonance imaging Cohort – Investigating The origin and EvolutioN of cerebral small vessel disease[6]). 54 patients with a high likelihood of progression of SVD were invited to baseline MRI assessment and in total 9 monthly follow-up MRI scans within one year (here we focused on the first and last visit (48 patients)). In addition, one subject was excluded due to corrupted data at baseline. Diffusion MRI data were acquired on a Siemens 3T Prisma MRI scanner with 10 b0 images, 30 directions at b = 1000 s/mm2 and 60 directions at b = 3000 s/mm2 and 1.7×1.7×1.7mm3 voxels (TE/TR: 74/3200 ms). In terms of cognitive assessment, we analyzed a compound processing speed score assessed by the time to complete Trail Making Test matrix A and B. Scores were age- and education corrected (speed-z) based on healthy subjects from the literature[7].
Data processing:
Each dataset was corrected for noise, Gibbs ringing, motion and distortion (as in [8]). Next, FA and mean diffusivity (MD) were derived for each subject (weighted least squares) using the b = 1000 s/mm2 shell and rotationally-invariant spherical harmonics features[9,10] (RISH, 0th order inhomogeneity corrected and normalized by the median CSF signal of the b0) using the b = 3000 s/mm2 shell (Fig. 1). These measures were mapped onto two manifolds: 1) a voxel-based skeleton derived from TBSS using the FA and 2) a set of tract-profiles derived from TractSeg[11]. Specifically, 50 bundles of interest were obtained using multi-shell multi-tissue constrained spherical deconvolution[12]. For each bundle, tractometry was performed to sample MD and RISH0 along 100 equidistant regions. Histogram analysis was performed over the two manifolds (skeleton: S, tract-profiles: T) to compute the mean (M) and peak-width (P) values of MD and RISH0.
Statistical analysis:
We determined the association of each metric (PSMD, PSRISH, PTMD, PTRISH, MSMD, MSRISH, MTMD, MTRISH) with processing speed using linear regression analysis. Tract-specific associations with processing speed were also investigated for the tractometry approach via Pearson’s correlation coefficient (R).
Results & Discussion
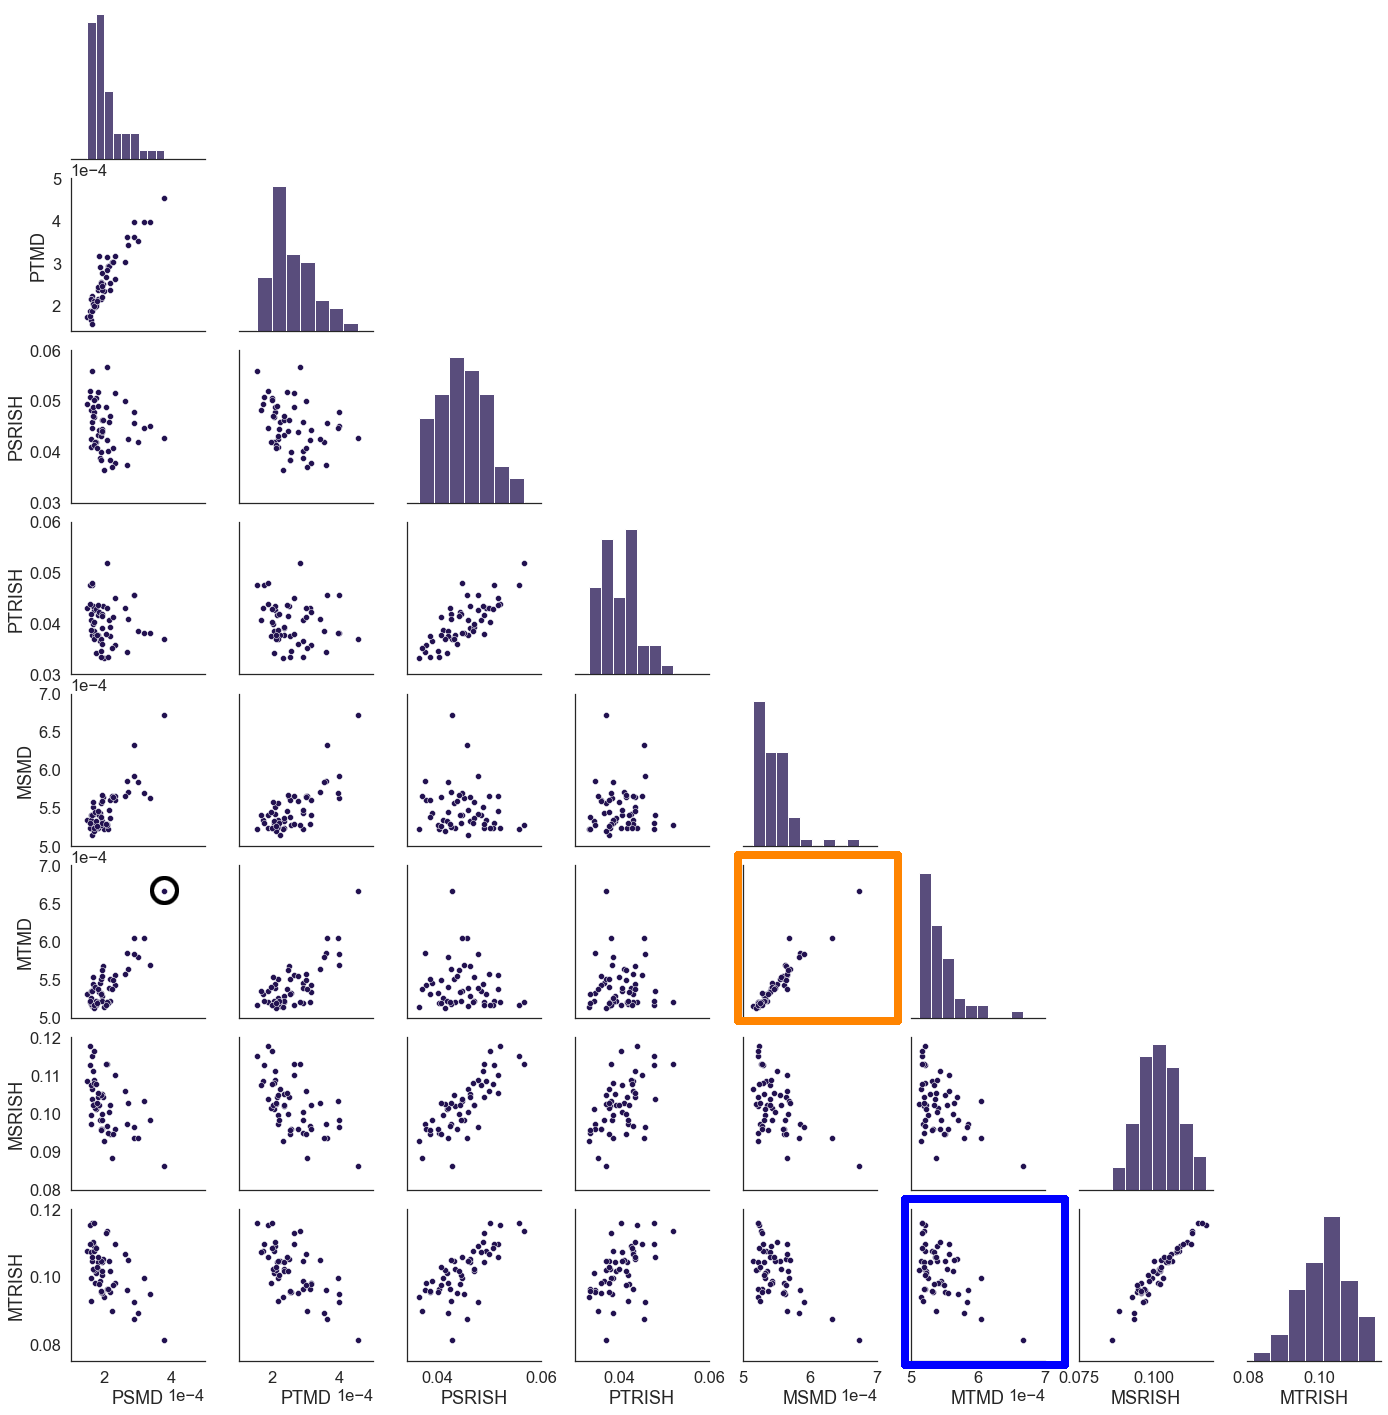
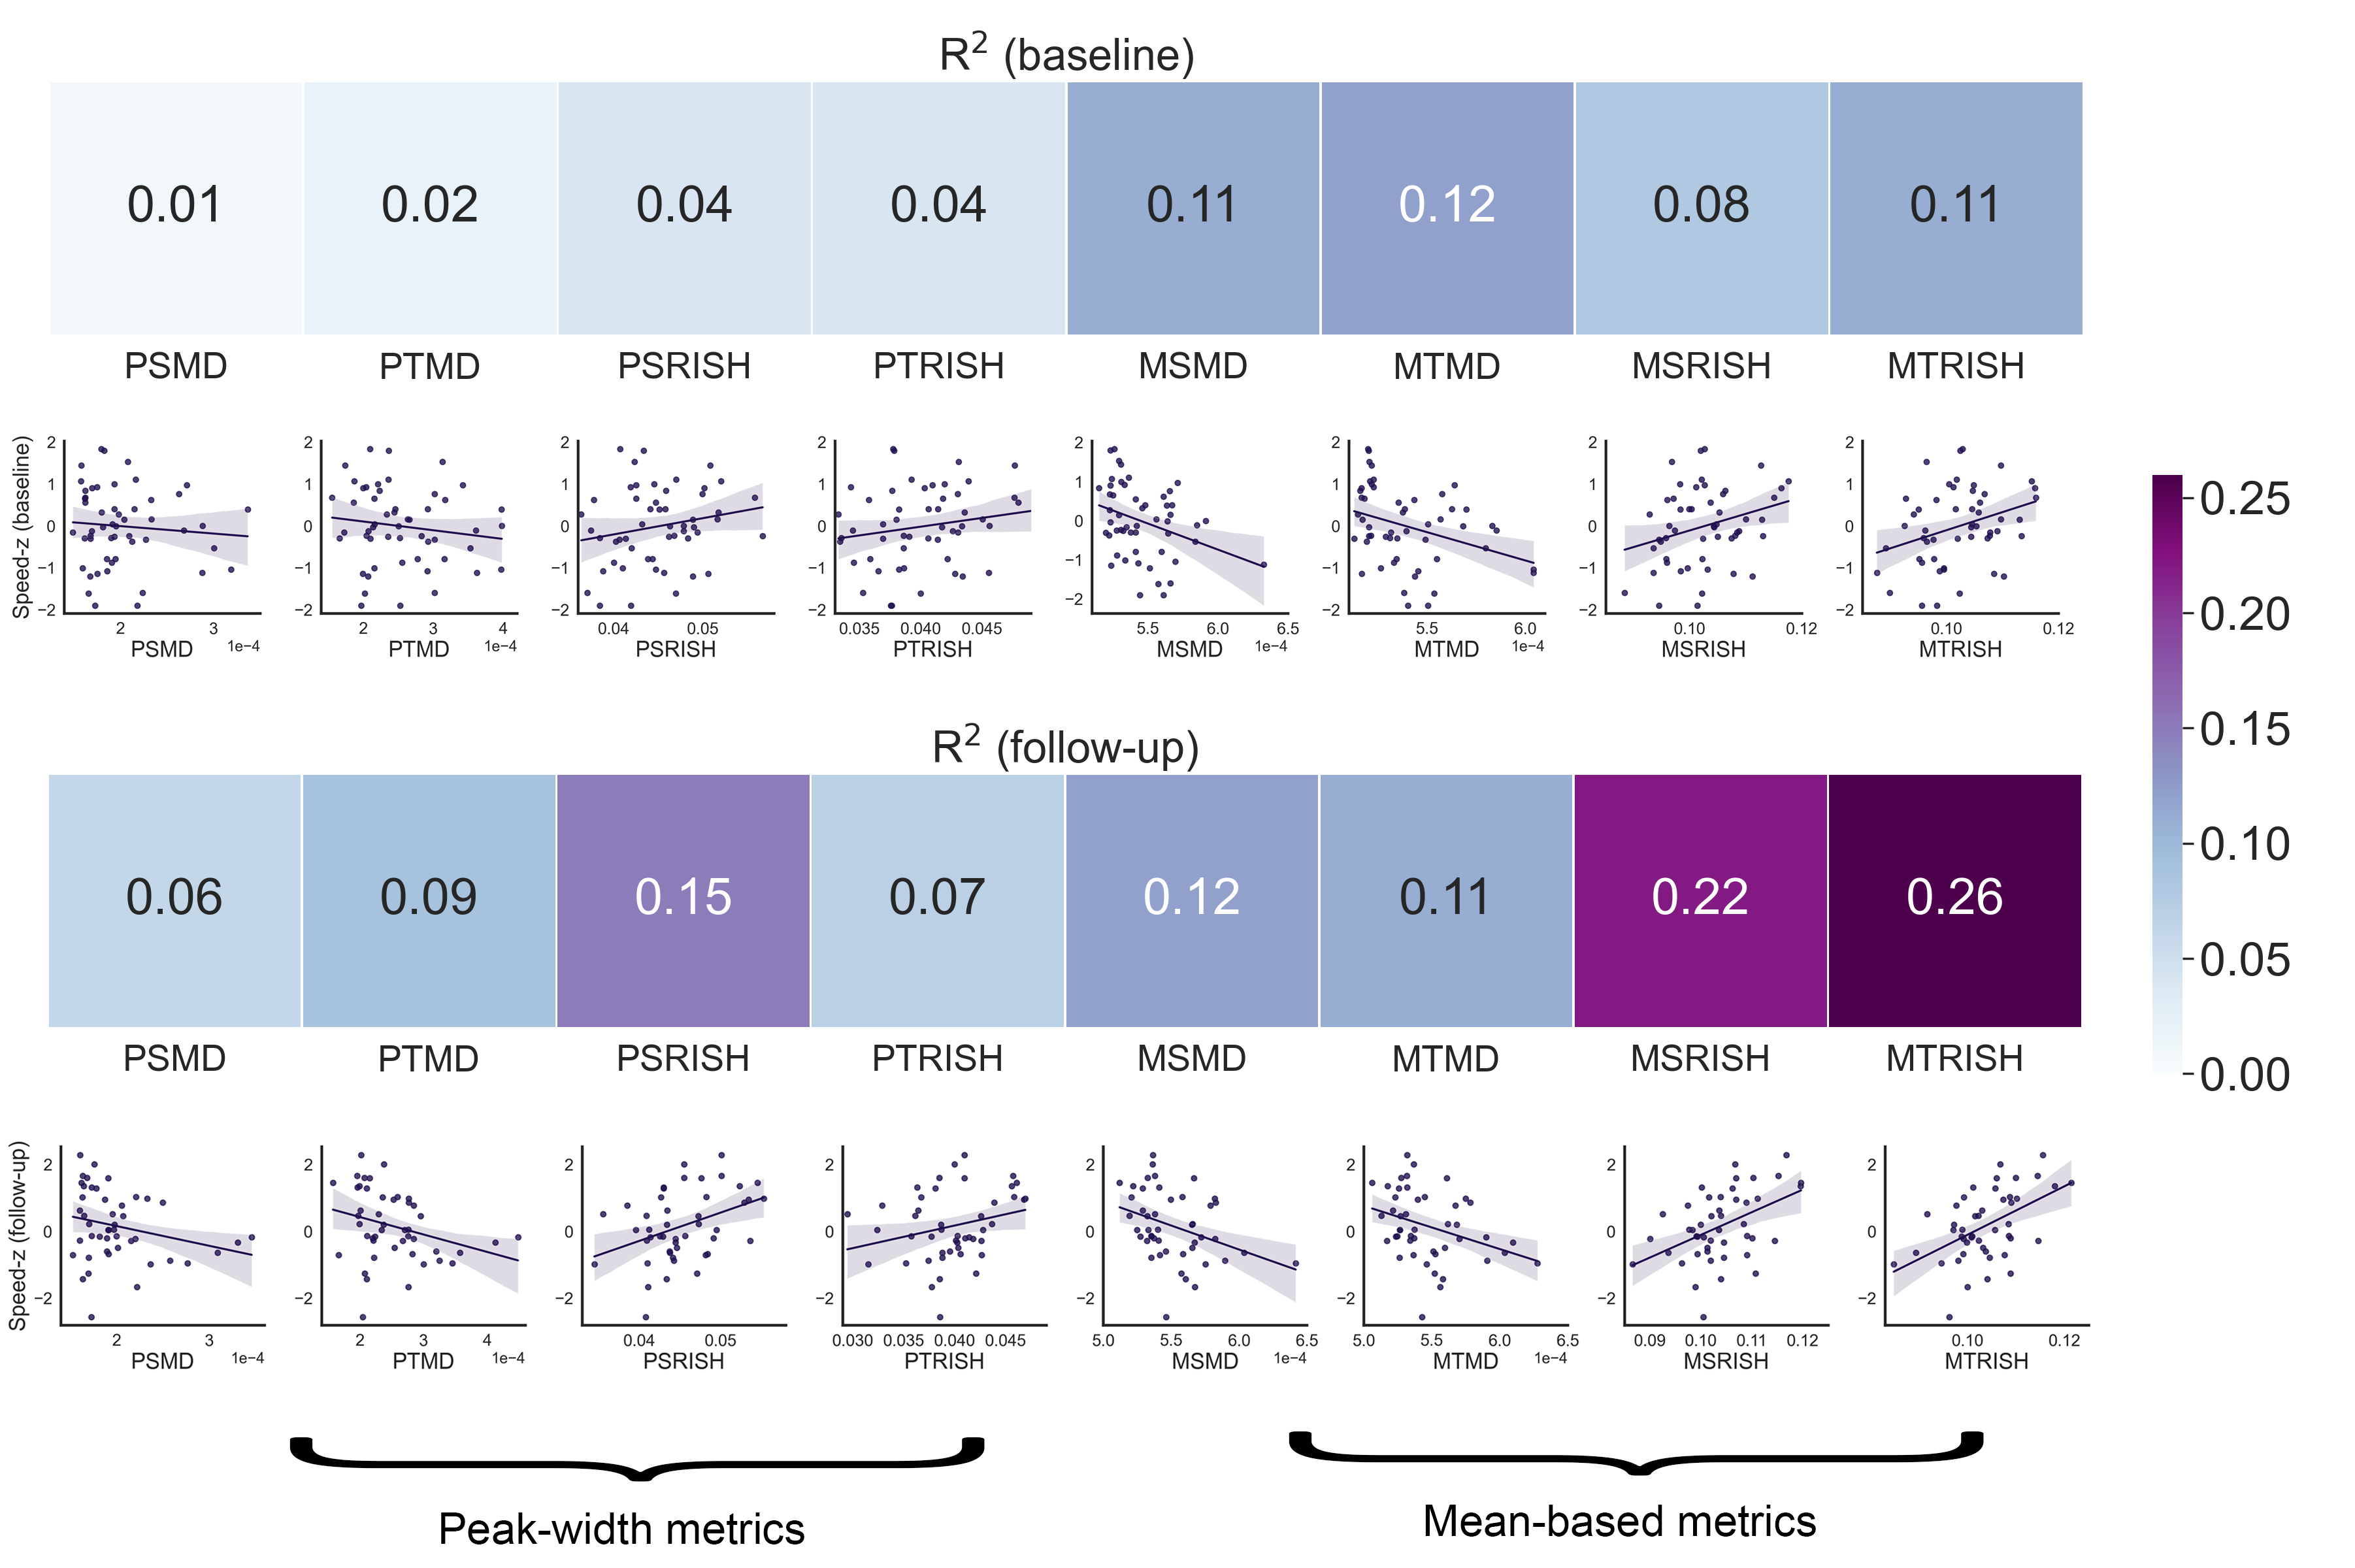
Fig. 1 highlights potential challenges of registration to the FA template necessary for the skeletonization, where tractometry analyses the results in native subject space. Fig. 2 shows the relationships between the various diffusion measures. Measures derived from high b-values only (e.g. RISH0) may reflect effects more specific to the intra-axonal space (Fig. 3). Indeed, more rich acquisitions can provide further insight into microstructural changes underlying SVD; significant associations (R2 = 18%) with mean and axial kurtosis indices have also been reported [8].In terms of association with processing speed, Fig. 4 shows that metrics based on the mean show stronger associations at baseline. At follow-up, the strength of association between peak-width methods and the task is increased, although they remain generally lower than the mean-based methods.
Both the skeletonization and tractometry strategies show associations with processing speed (Fig. 4), despite methodological considerations reported for TBSS. In terms of anatomical specificity, the tractometry approach allows the identification of bundles involved with processing speed for both RISH and MD measures mostly comprising motor and association pathways (Fig. 5).
Conclusion
Associations between diffusion MRI measures and processing speed in cerebral SVD were stronger when using the mean over the peak-width of the histograms, regardless of the chosen approach. Associations with processing speed found by skeletonization were confirmed with an independent tractometry approach, which was further utilized to identify tracts associated with cognition. Future work will investigate other RISH orders (e.g., RISH2 which relates to orientational dispersion) and their biophysical interpretation in the context of SVD.Acknowledgements
MC is supported by the Radboud University Excellence Initiative Fellowship. AMT is supported by the Dutch Heart Foundation (grant 2016 T044 to A.M Tuladhar) and the Netherlands CardioVascular Research Initiative: the Dutch Heart Foundation (CVON 2018-28 & 2012-06 Heart Brain Connection). FEdL is supported by VIDI innovational grant from The Netherlands Organization for Health Research and Development (ZonMw grant 016.126.351). CMWT was supported by a Veni grant (17331) from the Dutch Research Council (NWO) and a Sir Henry Wellcome Fellowship (215944/Z/19/Z).References
[1] Wardlaw, Joanna M., Colin Smith, and Martin Dichgans. "Small vessel disease: mechanisms and clinical implications." The Lancet Neurology 18.7 (2019): 684-696.
[2] Baykara, Ebru, et al. "A novel imaging marker for small vessel disease based on skeletonization of white matter tracts and diffusion histograms." Annals of neurology 80.4 (2016): 581-592.
[3] Smith, Stephen M., et al. "Tract-based spatial statistics: voxelwise analysis of multi-subject diffusion data." Neuroimage 31.4 (2006): 1487-1505.
[4] Bach, Michael, et al. "Methodological considerations on tract-based spatial statistics (TBSS)." Neuroimage 100 (2014): 358-369.
[5] Bells, Sonya, et al. “Tractometry–comprehensive multi-modal quantitative assessment of white matter along specific tracts.” Proc. ISMRM 2011.
[6] Ter Telgte, Annemieke, et al. "Investigating the origin and evolution of cerebral small vessel disease: The RUN DMC–InTENse study." European stroke journal 3.4 (2018): 369-378.
[7] Tombaugh, T. N. (2004). Trail Making Test A and B: normative data stratified by age and education. Archives of clinical neuropsychology, 19(2), 203-214.
[8] Konieczny, Marek J., et al. "Multi-shell diffusion MRI models for white matter characterization in cerebral small vessel disease." Neurology 96.5 (2021): e698-e708.
[9] Mirzaalian, Hengameh, et al. "Inter-site and inter-scanner diffusion MRI data harmonization." NeuroImage 135 (2016): 311-323.
[10] Novikov, Dmitry S., et al. "Rotationally-invariant mapping of scalar and orientational metrics of neuronal microstructure with diffusion MRI." NeuroImage 174 (2018): 518-538.
[11] Wasserthal, Jakob, Peter Neher, and Klaus H. Maier-Hein. "TractSeg-Fast and accurate white matter tract segmentation." NeuroImage 183 (2018): 239-253.
[12] Jeurissen, Ben, et al. "Multi-tissue constrained spherical deconvolution for improved analysis of multi-shell diffusion MRI data." NeuroImage 103 (2014): 411-426.
Figures