1729
Developing a robust quantitative diffusion MRI protocol for longitudinal assessment of neurodegenerative disorders1Henry Jackson Foundation for advancement in Military Medicine Inc, Rockville, MD, United States, 2QMI, NIBIB, National Institutes of Health, Bethesda, MD, United States, 3NNDCS, NINDS, National Institutes of Health, Bethesda, MD, United States, 4Children's National Hospital, Division of Neurology, Washington DC, DC, United States
Synopsis
In this work, we have developed a quantitative diffusion MRI (dMRI) pipeline, to include acquisition, processing, and analysis, robust enough to evaluate the evolution of a neurodegenerative disease in each individual patient.
Introduction
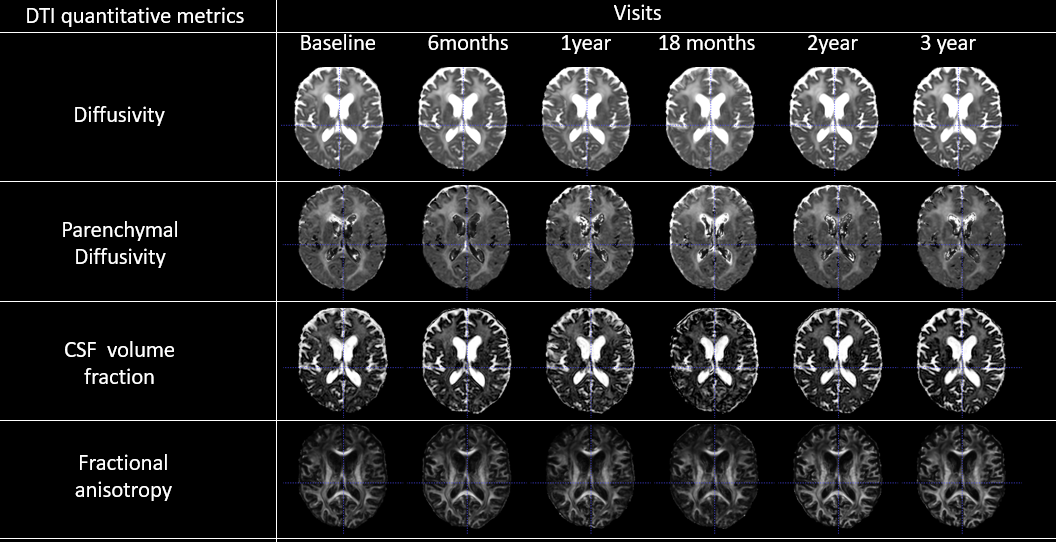
Quantitative diffusion MRI (dMRI) can provide important insights into the underlying pathophysiological state of neurodegenerative disorders, however, is rarely used clinically to evaluate the progression of such disorders and potential efficacy of therapies in individual subjects. In this work, we have developed a dMRI pipeline, to include acquisition, processing, and analysis, robust enough to evaluate the evolution of a neurodegenerative disease in each individual patient. The goal is to provide reliable, non-invasive surrogate endpoint for the evaluation of the efficacy of therapeutic interventions. This pipeline was applied to the investigation of Giant Axonal Neuropathy (GAN), an early onset relentlessly progressive neurodegenerative autosomal recessive disorder that affects both the peripheral [1,2,3] and the central nervous system[3]. The disease is named after the identification of the characteristic giant axons seen on nerve biopsy[1,4]. Our dMRI effort is part of a larger research goal aimed at characterizing the natural history of this rare disease with several genetic and imaging biomarkers, and to evaluate potential therapeutic interventions in GAN[5]. The acquisition of reliable dMRI data is not without challenges, particularly related to motion induced artifacts and EPI distortions that affects reproducibility[6]. Moreover, from pilot acquisitions it was clear that limitations in the total scan time precluded us from acquiring enough data to get reliable estimates of dMRI metrics that can be obtained only with high b-value sampling. Therefore, we designed a protocol which included the range of b-values which can be properly analyzed with diffusion tensor imaging (DTI), but we added several intermediate b-values which have allowed us to extract, in addition to the classical DTI metrics, MD and FA, the signal fraction of an isotropic CSF-like water compartment, which we refer to as "Cerebral-Spinal-Fluid signal fraction" (CSF-SF), and a Parenchymal Diffusivity metric, which is essentially an MD without the contribution of the CSF-like water compartment[7]. Since an elevation in MD is seen in GAN[8-16] (as in many other neurodegenerative diseases), we reasoned that the ability to differentiate whether the elevation was caused by water-filled lacunas or by fast exchanging water in the parenchyma can be informative to assess the disease.Materials and methods
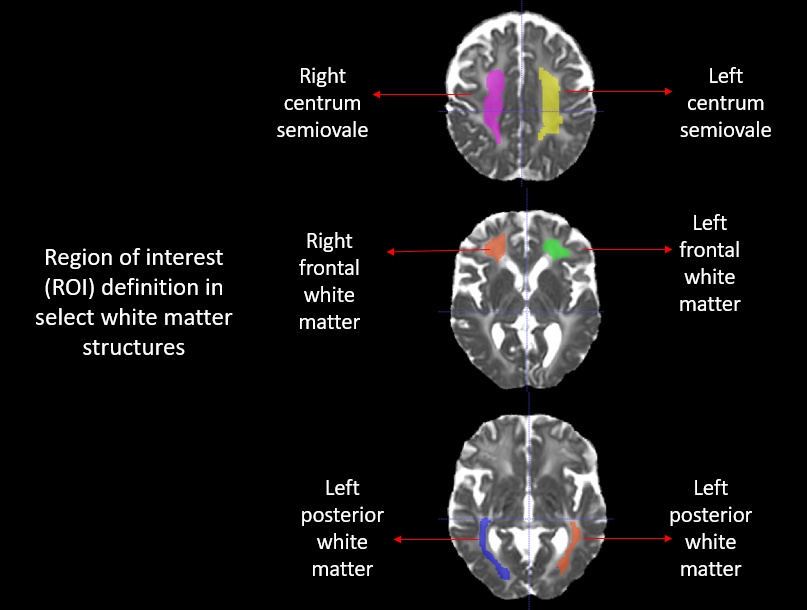
For DWI acquisition, we used a recently proposed “four way” phase encoding scheme[6] to correct susceptibility induced EPI distortions and to significantly increase the reproducibility of computed dMRI metrics without increasing scan time[6]. All images, fat suppressed T2WIs and 184 diffusion weighted image (DWI) volumes, were acquired on a 3.0 tesla Philips Achieva scanner. DWI volumes comprised of 46 volumes with intermediate b-values per phase encoding direction: [b0 (1), b50 (6), b200 (6), b400 (6), b600 (6), b1100 (21)] s/mm2, to allow the dual compartment analysis mentioned above. A longitudinal co-registration/atlas-creation strategy was adopted to create a subject specific template[17,18,19]. The creation of a subject template ensures that there is reliable voxel-wise correspondence to extract select WM ROIs[20] [fig 2] from various co-registered DTI metrics [fig 1], in individual subjects, and to chart the disease time course.Results
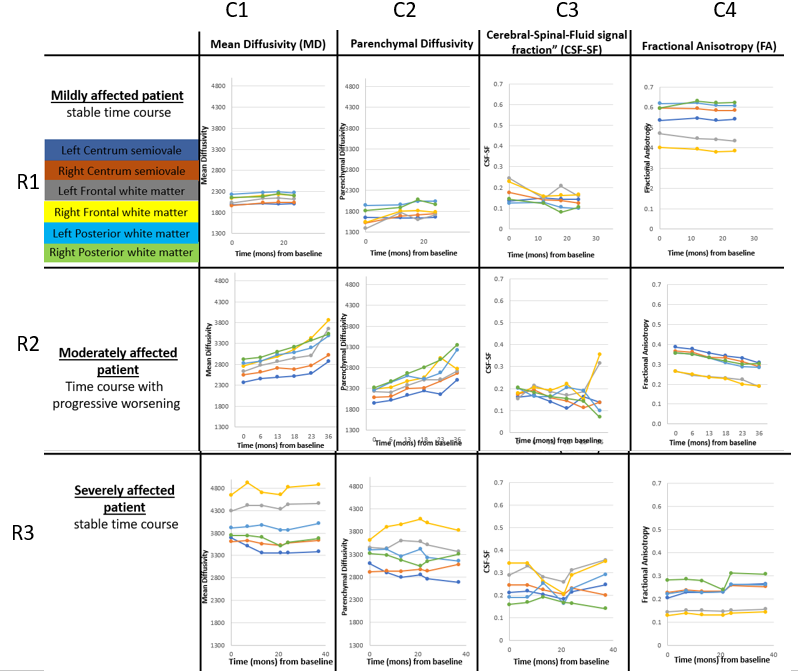
We present preliminary results from three individual patients’ representative of subjects with different level of relative disease burden at the time of first acquisition (mild, moderate, and severe), type of progression with time, and anatomical distribution of the abnormalities:1) At baseline, the still mildly affected patient had almost normal MD and FA [fig 3, R1:C1,C4], whereas the moderately and severely affected patients had elevated MD, and reduced FA [fig 3, R2:C1,C4, R3:C1,C4].
2) MD in the mildly affected patient is consistent across ROIs. However, in the moderately affected patient the MD differences between ROIs start to emerge, probably indicating there is regional heterogeneity in disease vulnerability [fig3, R2:C1].
3) The parenchymal diffusivity follows the overall trajectory of MD [fig3, C2], per subject, indicating that at least a first step of the progression of the disease is increase in interstitial water rather than creations of large degenerative lacune.
4) For the moderately affected patient, CSF-SF is higher bilaterally in the frontal white matter at the later time point [fig3, R2:C3]. This could be indicative of progression toward the formation of lacune. However, it should also be noted that there is a higher variability of the measured CSF-SF, compared to other metrics. Improving the quality of the CSF-SF maps will be an important goal in the future.
Discussion
In this paper we have presented an acquisition, processing, and analysis pipeline that can be used clinically to evaluate the progression of neurodegenerative disorders and the potential efficacy of therapies in individual subjects. The dMRI metrics obtained from our pipeline were able to characterize severity of the disease at baseline as well as pattern of evolution in GAN. Our future work will involve examination of more brain structures to add to the existing neuroimaging findings on the disease [8-16]. Assessment of the efficacy of therapy based on the tissue characterization provided by the dMRI metrics would be premature at this stage because of the small number of subjects investigated so far. However, the quality of the dMRI metrics acquired with this protocol is encouraging that our approach could be used towards this goal.Acknowledgements
No acknowledgement found.References
[1] Asbury AK, Gale MK, Cox SC, et al: Giant axonal neuropathy - A unique case with segmental neurofilamentous mass. Acta Neuropathol, Pediatrics 49:894-899, 1972
[2]. Carpenter S, Karpati G, Andermann F, et al: Giant axonal neuropathy: A clinically and morphologically distinct neurological disease. Arch Neurol 201237-247, 1972 31 :312-316, 1974
[3] Igisu H, Ohta M, Tabira T, Hosokawa S, Goto I. Giant axonal neuropathy. A clinical entity affecting the central as well as the peripheral nervous system. Neurology 1975; 25:717- 721.
[4] Duncan C, Strub R, McGarry P, Duncan D. Peripheral nerve biopsy as an aid to diagnosis in infantile neuroaxonal dystrophy. Neurology. 1970 Oct;20(10):1024-32. doi: 10.1212/wnl.20.10.1024. PMID: 5528549.
[5] https://clinicaltrials.gov/ct2/show/NCT02362438.
[6] Irfanoglu M.O., Sadeghi N., Sarlls J., Pierpaoli C. Improved reproducibility of diffusion MRI of the human brain with a four-way blip-up and down phase-encoding acquisition approach. Magn. Reson. Med. 2020;85 doi: 10.1002/mrm.28624.
[7] C. Pierpaoli, D. Jones, Removing CSF contamination in brain DT-MRIs by using a two-compartment tensor model, Proceedings of the International Society for Magnetic Resonance in Medicine. Presented at the ISMRM, ISMRM, Kyoto (2004), p. 1215.
[8] Crete R, Jorgensen SA, Towbin AJ, Towbin R. Giant axonal neuropathy. Appl Radiol. 2018;47(5):40-41.
[9] Vijaykumar K, Bindu PS, Taly AB, et al. Giant Axonal Neuropathy. Journal of Child Neurology. 2015;30(7):912-915. doi:10.1177/0883073814547721.
[10] Garg M, Kulkarni SD, Hegde AU, Desai M, Sayed RJ. Giant Axonal Neuropathy: Clinical, Radiological, and Genetic Features. Ann Indian Acad Neurol. 2018 Oct-Dec;21(4) 304-308. doi:10.4103/aian.aian_82_18. PMID: 30532362; PMCID: PMC6238561.
[11] Jain P, Sharma S, Kamate M, Hattiholi V, Patra B, Mahadevan A, Aneja S. Unusual Neuroimaging Findings in Two Families with Giant Axonal Neuropathy. Can J Neurol Sci. 2014 Nov;41(6):777-9. doi: 10.1017/cjn.2014.102. PMID: 26693541.
[12] Brockmann K, Pouwels PJ, Dechent P, et al: Cerebral proton magnetic resonance spectroscopy of a patient with giant axonal neuropathy. Brain Dev 2003; 25:45–50. 5.[13] Alkan A, Kutlu R, Sigirci A, Baysal T, Altinok T, Yakinci C. Giant axonal neuropathy: MRS findings. J Neuroimaging 2003; 13:371-5. 13
[14] BRIEF REPORT Year : 2009 | Volume : 57 | Issue : 2 | Page : 181--184 Spectrum of magnetic resonance imaging findings in a family with giant axonal neuropathy confirmed by genetic studies S Ravishankar1 , Gaurav Goel1 , Chandrajit Prasad Bernd Rautenstrauss2 , Atchayaram Nalini3 , 1 Department of Neuroimaging and Interventional Radiology, National Institute of Mental Health and Neurosciences, Bangalore, India 2 University Hospital Erlangen, Institute of Human Genetics, Erlangen, Institute of Human Genetics, Medical Genetics Center Munich, Germany 3 Department of Neurology, National Institute of Mental Health and Neurosciences, Bangalore, India.
[15] Giant axonal neuropathy: Diffusion weighted imaging features of the brain. J Child Neurol 2006; 21:912-5.
[16] Brenner C, Speck-Martins CE, Farage L, Barker PB. 3T MR with diffusion tensor imaging and single-voxel spectroscopy in giant axonal neuropathy. J Magn Reson Imaging. 2008 Jul;28(1):236-41. doi: 10.1002/jmri.21425. PMID: 18581347; PMCID: PMC2947443.
[17] Irfanoglu.,et al, TORTOISEv3: Improvements and new features of the NIH diffusion MRI processing pipeline, ISMRM 25th annual meeting, Honolulu, HI, abstract #3540
[18] Irfanoglu.,et al, DR-BUDDI (Diffeomorphic Registration for Blip-Up Blip-Down Diffusion Imaging) method for correcting echo planar imaging distortions, Neuroimage, 2015
[19] Irfanoglu MO, Nayak A, Jenkins J, Hutchinson EB, Sadeghi N, Thomas CP, Pierpaoli C, DR-TAMAS: Diffeomorphic Registration for Tensor Accurate Alignment of Anatomical Structures. Neuroimage. 2016 May 15; 132:439-454. doi: 10.1016/j.neuroimage.2016.02.066. Epub 2016 Feb 28.
[20] Paul A. Yushkevich, Joseph Piven, Heather Cody Hazlett, Rachel Gimpel Smith, Sean Ho, James C. Gee, and Guido Gerig. User-guided 3D active contour segmentation of anatomical structures: Significantly improved efficiency and reliability. Neuroimage 2006 Jul 1;31(3):1116-28.
Figures