1728
Brain Extracellular Free Water Correlates with MRSI Biomarkers of Neuro-inflammation in the Brain of HIV Clade-C Infected Individuals1Radiology, University of Miami, Miami, FL, United States, 2Post Graduate Institute of Medical Education & Research, Chandigarh, India
Synopsis
Free water (FW) imaging is a diffusion-weighted MRI technique that differentiates extracellular from intracellular water compartments. Increased FW fraction is generally associated with neuroinflammation. However, establishment of a direct link between FW and biomarkers of neuroinflammation in human studies is not feasible. In this work, we use MRSI to find correlations between FW and metabolic biomarkers of inflammation in HIV infected individuals. Our results show that FW had the most significant positive correlations with myo-inositol, a strong biomarker of gliosis and inflammation. This corroborates previous findings that elevated FW can be interpreted as a sign of inflammation in the brain.
Introduction
Free water elimination (FWE) is an emerging diffusion-weighted (DW) MRI data processing technique that differentiates “free” water contained in the extracellular space from the intracellular tissue water trapped within cells and subcellular structures.1,2 FWE is used to estimate the free water volume fraction (FW) as the proportion of extracellular water contained within a voxel. Increased brain FW has generally been associated with neuroinflammation in many neurological diseases (Parkinson’s, Alzheimer’s, and schizophrenia) as well as infectious diseases such as HIV.3 Several animal studies have also shown correlations between neuroinflammation and increase in the extracellular space.4 However, establishment of a direct link between FW and biomarkers of neuroinflammation in human studies is difficult since biopsies are not feasible. Magnetic resonance spectroscopic imaging (MRSI) is an MRI technique that can provide this association, albeit indirectly, by investigating changes in brain metabolite levels with respect to FW. In this study, we use FWE and MRSI at the whole-brain level to identify if FW correlates with metabolite markers of inflammation in the brain of HIV clade-C infected individuals.Methods
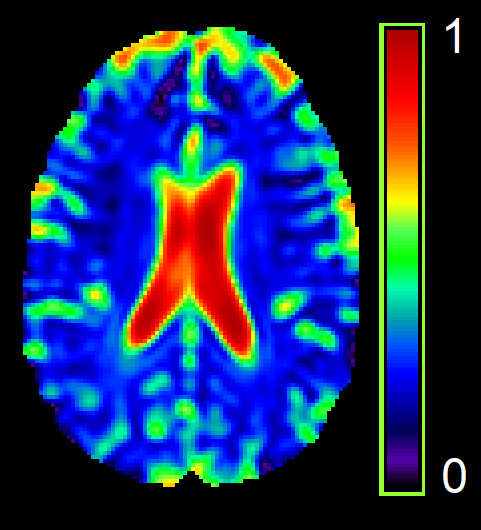
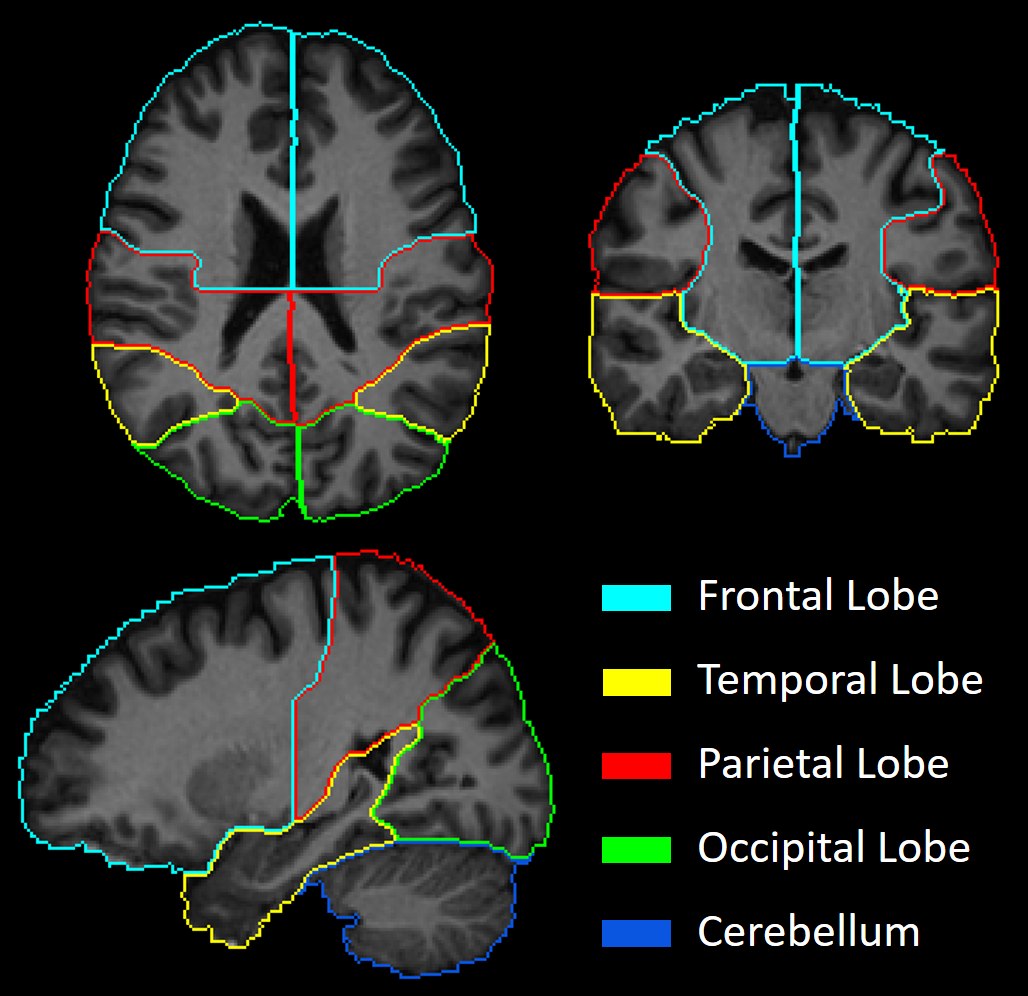
MRI Data were collected at the Post Graduate Institute of Medical Education & Research (PGIMER) in India from 213 volunteers with 107 Clade-C HIV+ subjects (77/30 male/female; age: 31.6±6.4 ), and 106 age-matched controls (70/36 male/female; age: 30.9±7 ). All HIV subject are cART-naïve, i.e., received no treatment until the scan. The protocol included: (a) T1-weighted MPRAGE images (TR/TE: 2300/2.42 ms; voxel dimension: 1.0 × 1.0 × 1.0 mm3; 160 axial slices); (b) whole-brain MRSI using a 3-dimensional EPSI spin-echo sequence with: TR = 1,551 ms, TE = 17.6 ms, TI = 198 ms, matrix size of 50X50 with 18 slices, FOV = 280 × 280 × 180 mm; (c) DW-images with dual-shell acquisition (b = 1000/2000 s/mm2) using 30 gradient directions per shell (TR/TE: 1150/98 ms; voxel dimension: 3.0 × 3.0 × 3.0 mm; 54 axial slices); (c) Two b0 sequences of 9 images each, collected in opposite phase encoding directions following the same parameters as the DW-images.DW-images were pre-processed using tools from the FMRIB software library (FSL)5 to correct for susceptibility induced distortions, eddy currents, and subject motion. FWE-DTI tensor fitting was performed using the Dipy library6 from which we obtained the FW maps (Figure 1). Whole-brain MRSI data were processed using the Metabolite Imaging and Data Analysis System (MIDAS) software7,8 to quantify the levels of Creatine (Cr), N-acetylaspartate (NAA), choline (Cho), myo-inositol (mIns), and glutamate/glutamine (Glx). Structural T1 MRIs were also processed with FSL for segmentation into grey matter (GM), white matter (WM), and CSF partial volumes. FW and metabolite measures were evaluated at the same regions of interest (ROI) using an atlas-based approach. ROIs were selected from a lobar atlas comprised of 9 regions: 4 lobes, i.e. frontal (FL), parietal (PL), temporal (TL), occipital (OL) divided between right and left hemispheres; and the cerebellum (Figure 2). At each ROI we estimated the FW index and metabolite levels for both GM and WM separately using the partial volumes obtained from T1 tissue segmentation. Data from voxels with more than 30% CSF were removed from analysis.
Statistical analysis was performed using R programming language. We performed a correlation analysis (Pearson’s r) between the FW index and metabolite measures at each ROI, separating WM from GM, with a significant correlation at p < 0.05 corrected for multiple comparisons with FDR).
Results
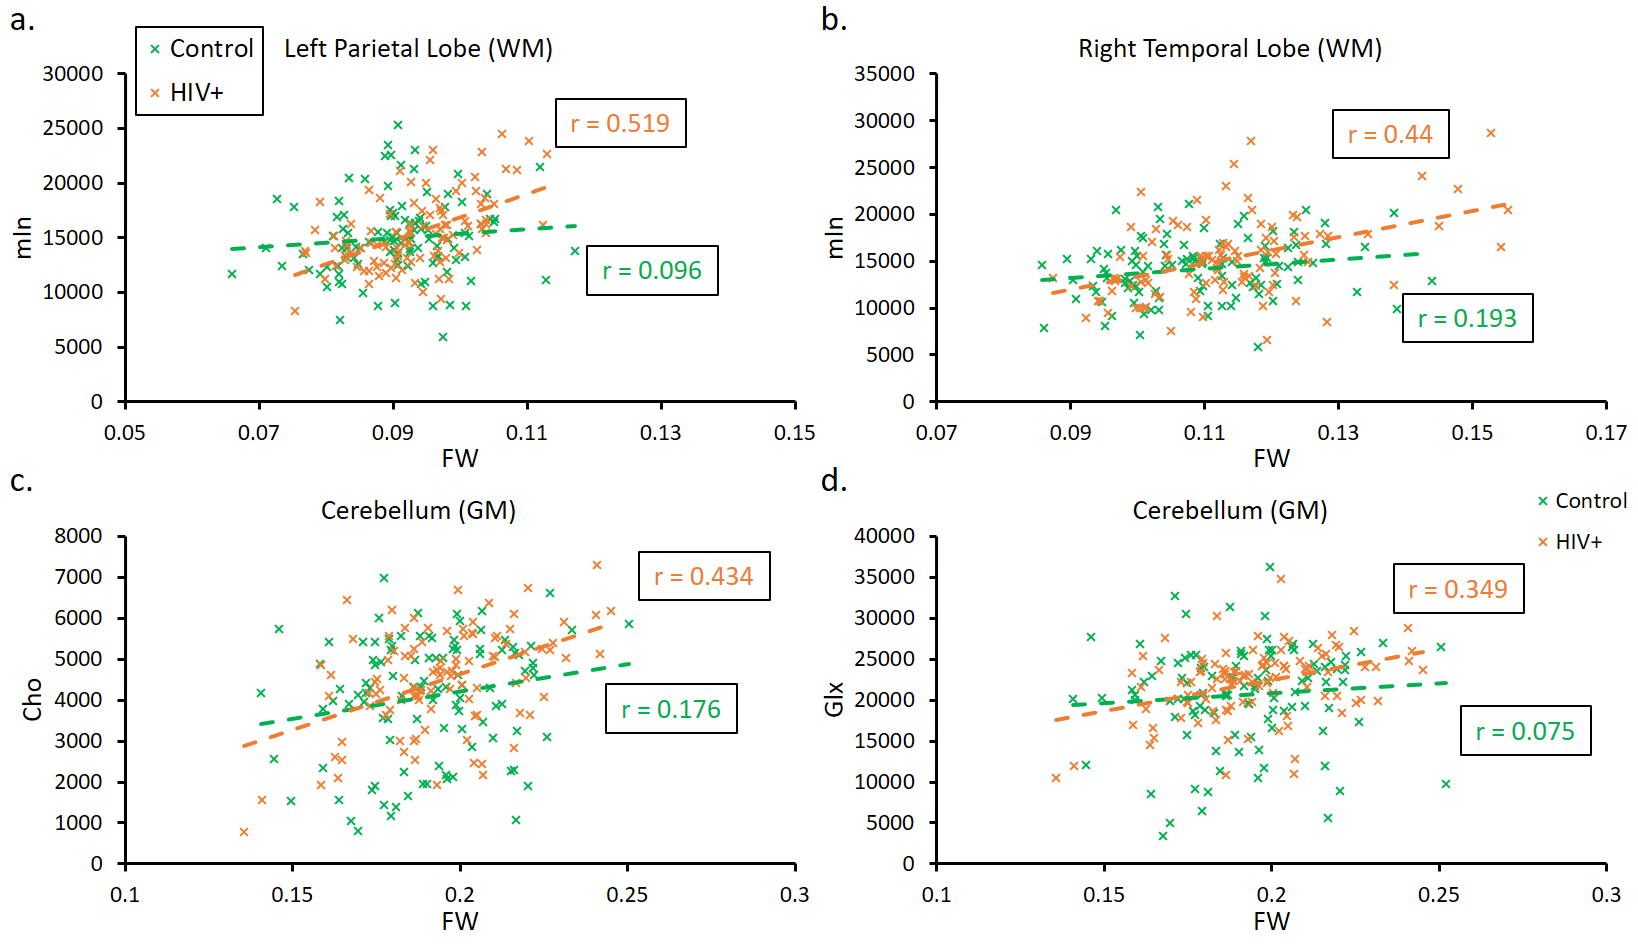
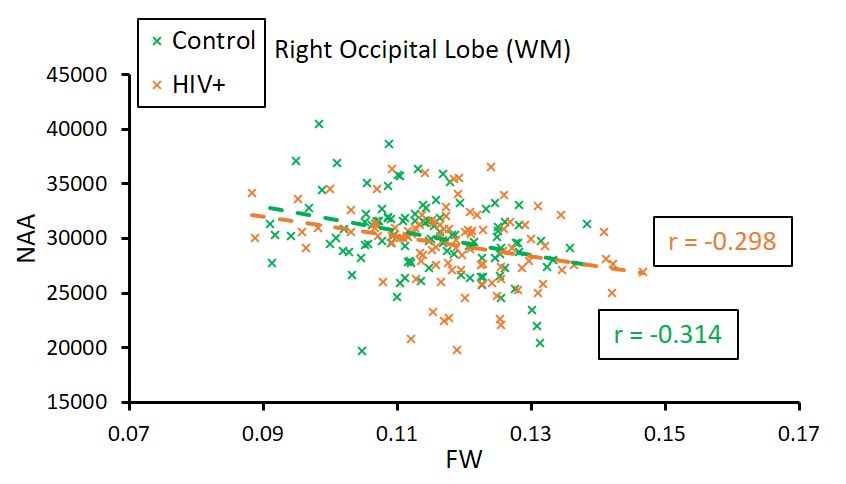
The main finding is that correlations between FW and different metabolites were much more significant in the HIV+ group than with control subjects. The most significant positive correlations were between FW and mIns found in nearly every ROI, most notably in the WM of the left PL (Control: r = 0.096, p = 0.32; HIV: r = 0.519, p = 2.13x10⁻⁸) and right TL (Control: r = 0.192, p = 0.048; HIV: r = 0.44, p = 4.10x10⁻⁶) shown in Figure 3-a and 3-b, respectively. FW also had positive but more moderate correlations with Cho, and Glx, with the highest significance found in the GM of the cerebellum (Figure 3-c and 3-d). Finally, our results show that FW is negatively correlated with NAA in some WM regions, although only a few ROIs showed significance. Unlike other metabolites, correlations with NAA were similar between the two groups as shown in the occipital lobe (Figure 4).Discussion
Our findings show that FW had the most significant positive correlations with mIns among HIV infected subjects, while this was not the case with controls. Elevated mIns is an indicator of gliosis and inflammation, which in turn causes an expansion of the extracellular space driving the observed increase in FW. Positive correlations with Cho and negative correlations with NAA also reflect cell membrane disruption, active demyelination, and loss of neuronal integrity.Conclusion
In this study, we combined FWE imaging with MRSI in the whole-brain to establish correlations between the FW index and metabolic biomarkers of inflammation among HIV clade-C infected individuals. We found FW correlations to be the most significant with mIns, an important biomarker of neuroinflammation. This corroborates previous findings in the literature that elevated FW can be interpreted as a sign of inflammation in the brain.Acknowledgements
Funding from NIH grant, R01 NS094043.References
1. Pasternak O, Sochen N, Gur Y, et al. Free water elimination and mapping from diffusion MRI. Magn Reson Med. 2009;62(3):717-30.
2. Hoy AR, Koay CG, Kecskemeti SR, et al. Optimization of a free water elimination two-compartment model for diffusion tensor imaging. Neuroimage. 2014;103:323-333.
3. Uddin MN, Faiyaz A, Wang L, et al. A longitudinal analysis of brain extracellular free water in HIV infected individuals. Sci Rep. 2021;11(1):8273.
4. Lo WD, Wolny AC, Timan C, et al. Blood-brain barrier permeability and the brain extracellular space in acute cerebral inflammation. J Neurol Sci. 1993 Sep;118(2):188-93.
5. Jenkinson M, Beckmann CF, Behrens TEJ, et al. FSL. NeuroImage; 2012;62:782-90.
6. Garyfallidis E, Brett M, Amirbekian B, et al. DIPY, a library for the analysis of diffusion MRI data. Frontiers in Neuroinformatics; 2014;8(8).
7. Maudsley AA, Darkazanli A, Alger JR, et al. Comprehensive processing, display and analysis for in vivo MR spectroscopic imaging. NMR in biomedicine. 2006;19(4):492-503.
8. Maudsley AA, Domenig C, Govind V, et al. Mapping of brain metabolite distributions by volumetric proton MR spectroscopic imaging (MRSI). Magnetic resonance in medicine: official journal of the Society of Magnetic Resonance in Medicine/Society of Magnetic Resonance in Medicine. 2009;61(3):548-559.
Figures