1723
Repeatability of Diffusion Kurtosis Tensor Parameters in Muscles of the Lower Legs1Barrow Neurological Institute, Tempe, AZ, United States, 2Arizona State University, Tempe, AZ, United States
Synopsis
This study examines the repeatability of quantitative measures obtained from the lower legs using a diffusion kurtosis tensor imaging sequence with a scan time of just 13 minutes. Test-retest data was acquired, and kurtosis parameters were calculated for both sets of data. Muscle groups were segmented, and repeatability was assessed by muscle group. In both the medial gastrocnemius and tibialis anterior, kurtosis fractional anisotropy and fractional anisotropy showed highest repeatability, as well as mean diffusivity in the medial gastrocnemius.
Introduction
In the context of patients with neurodegenerative disorders affecting muscle structure and function, non-invasive image-based biomarkers are urgently needed for robust and quantitative evaluation of myofiber health. Diffusion kurtosis imaging (DKI) enables evaluation of tissue microstructure and could serve as a valuable tool for characterizing muscle degeneration. Traditional diffusion-tensor imaging (DTI) assumes Gaussian diffusion of water molecules, but it is well known that diffusion in biological tissue is non-Gaussian due to the effects of cellular microstructure1. While diffusion at low b-values does follow a Gaussian distribution, DKI can examine non-Gaussian diffusion through the use of higher b-values, providing information regarding underlying microstructural features.Characterizing the repeatability of DKI would inform future studies aiming to use the derived parameters to serially evaluate disease progression and/or response to treatment. While studies have examined mean kurtosis (MK) in the lower legs2,3, the repeatability of full kurtosis tensor acquisition remains unexplored due to long scan times. Thus, the goal of this study is to assess the repeatability of a full kurtosis tensor acquisition with a clinically viable scan time of just 13 minutes.
Methods
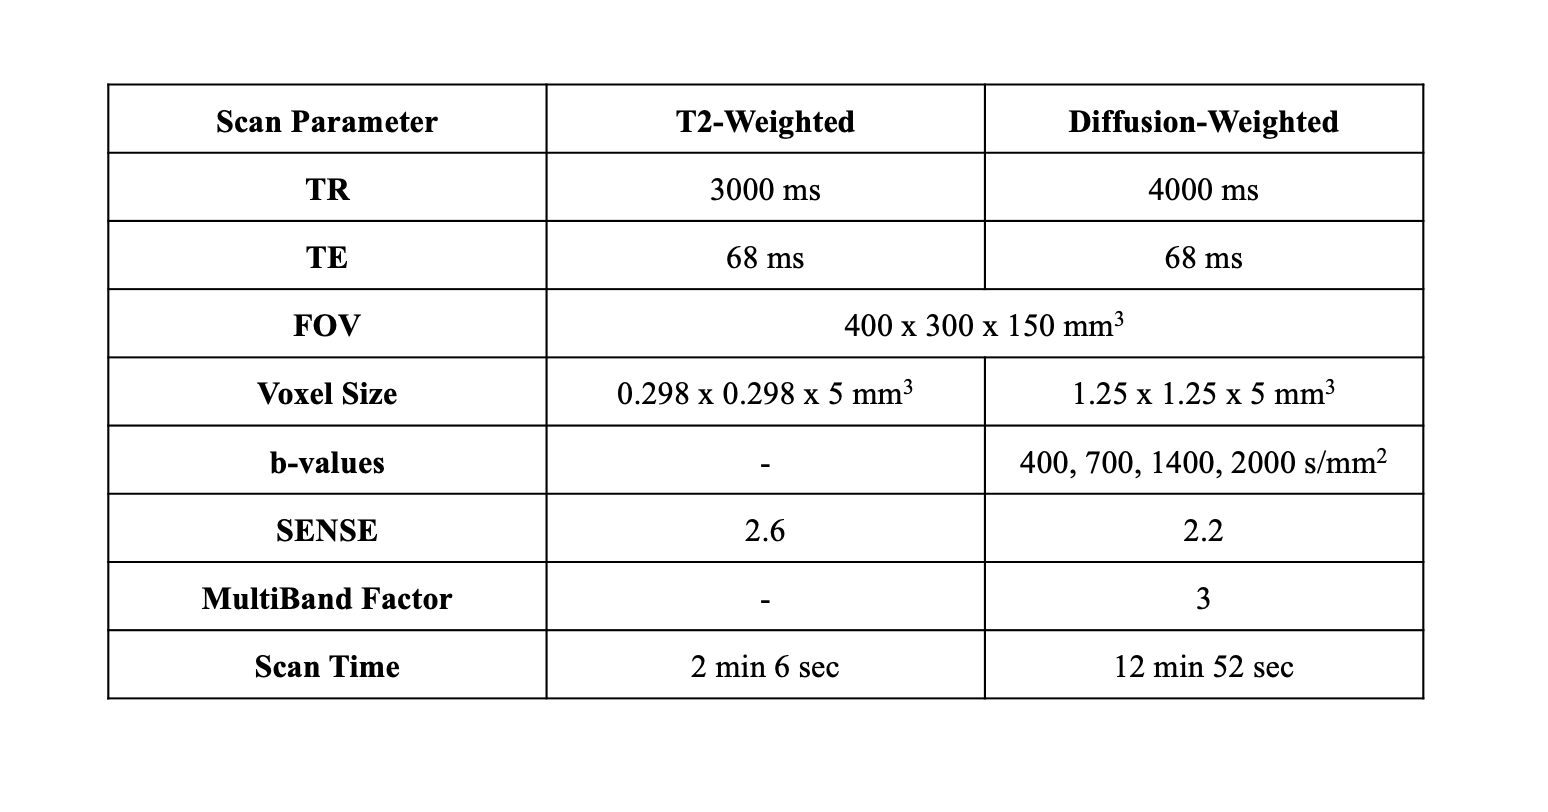
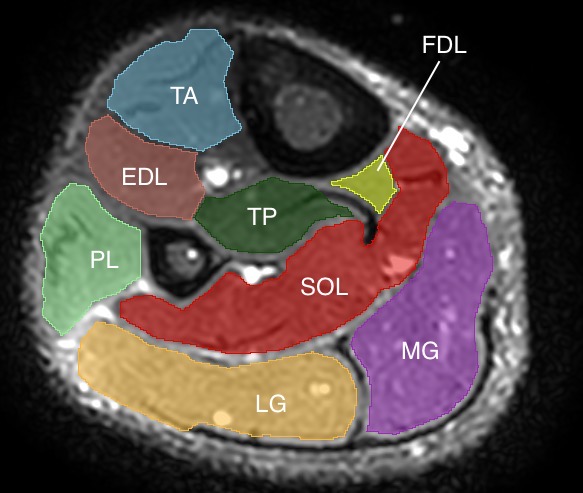
This preliminary analysis consists of 2 of a planned recruitment of 35 healthy volunteers. Test-retest data was acquired during the same visit by removing the volunteer from the scanner after the first set of data was acquired and resetting the scanner bed completely before the patient was rescanned. All scans were acquired on a Philips 3.0T Ingenia with a 16-channel dS Anterior Coil (Philips). For both test and retest acquisitions, a high resolution T2-weighted anatomical image was acquired for segmentation, followed by 2 sets of b0 images with reverse phase encoding (AP and PA) for susceptibility-induced distortion correction. The diffusion scan consisted of a 32-direction single-shot EPI multi-shell acquisition (b = 400, 700, 1400, 2000 s/mm2) with one average for the lower two b-values and two averages for the higher b-values. Full imaging parameters for both sequences are shown in Table 1. Total scan time was 17.5 minutes (35 minutes for both test and retest). Shorter acquisition time could be achieved by using only three b-values instead of four.Denoising of the data was achieved via Patch2Self4. FSL topup5 was used for correction of susceptibility artifacts, and FSL eddy6 was used for eddy current correction and movement correction. Full volume masks were acquired through 3D Slicer7, and anatomical segmentations were done in MATLAB (The Mathworks, Natick, MA, USA). For this preliminary analysis, only the medial gastrocnemius (MG) and tibialis anterior (TA) were segmented, but full segmentation of the lower leg muscles is underway. DIPY8 was used for fitting of the kurtosis tensor and calculation of associated parameters. Besides mean kurtosis, acquisition of the full tensor provides axial kurtosis (AK), radial kurtosis (RK), the mean kurtosis tensor (MKT), kurtosis fractional anisotropy (KFA), and the parameters from traditional DTI, namely mean diffusivity (MD or ADC), axial diffusivity (AD), radial diffusivity (RD), and the fractional anisotropy (FA).
All statistical analysis was conducted in MATLAB. Due to low sample size in this preliminary analysis, within-subject coefficient of variation (wsCV) was used to determine repeatability. Full analysis will instead use mean coefficient of variation, mean relative difference, and intra class correlation to quantify repeatability based on muscle group.
Results/Discussion
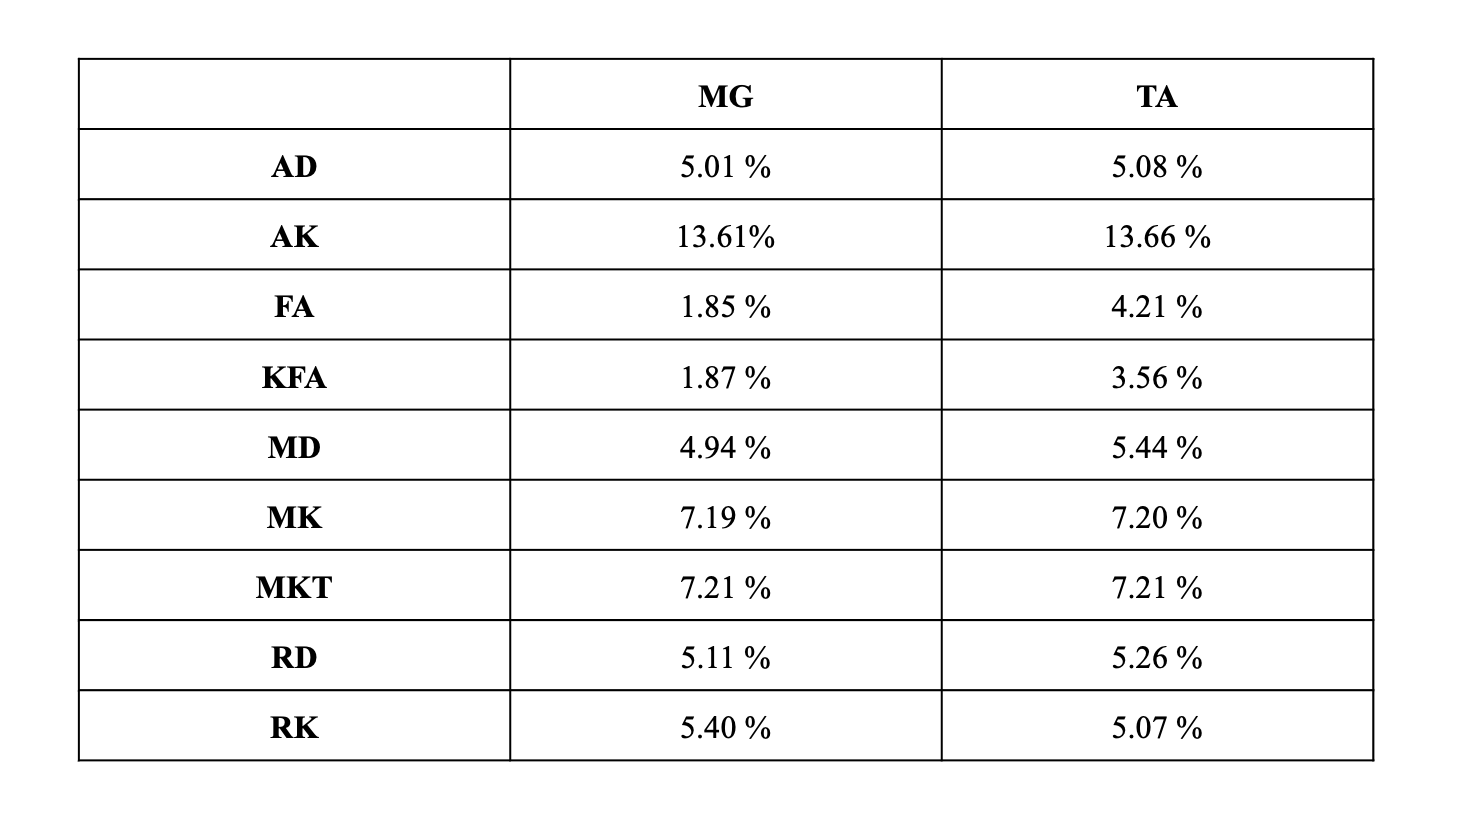
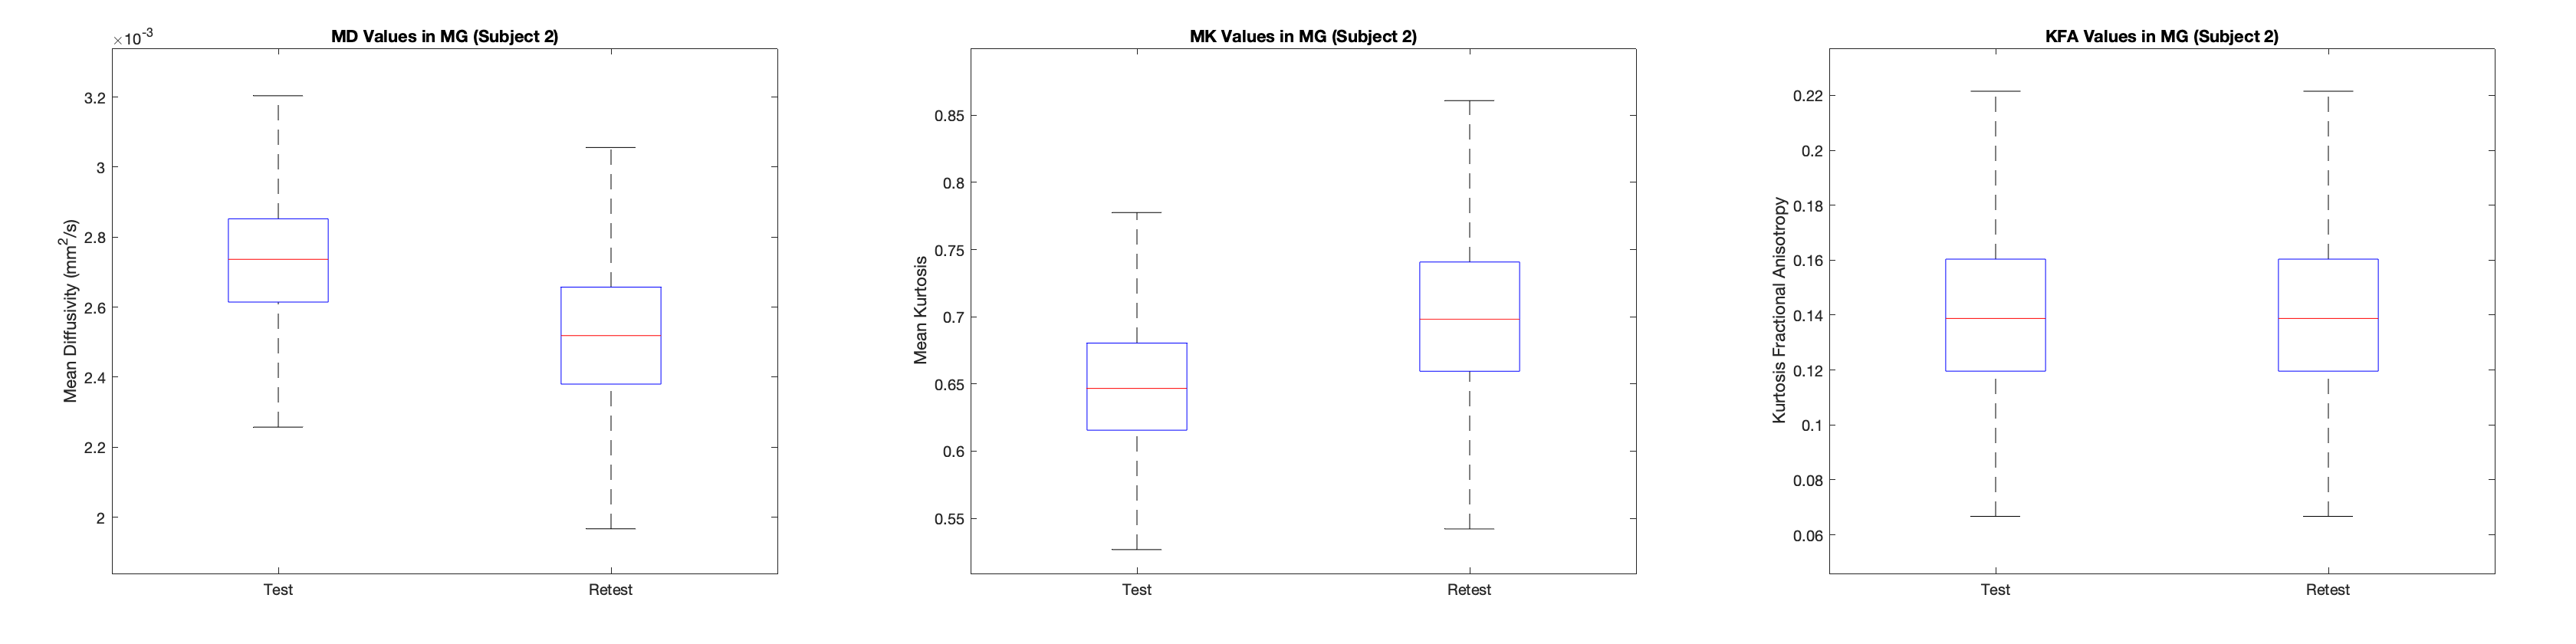
In both the MG and TA, FA and KFA showed highest repeatability with wsCV = 1.9% for both, while in MG the wsCV was 3.6% and 4.2% respectively. Table 2 displays all wsCV values for both muscle groups. Figure 2 shows boxplots of MK, MD, and KFA in the MG for patient 2.Even in this small sample size, the wsCV values were comparable (< 10% for all but AK) to prior studies evaluating repeatability of DTI in other organs9. wsCV within the MG was lower than in the TA, but this could be due to the low sample size in this preliminary analysis. It is worth noting that there was visibly observable difference in mean signal intensity in certain regions of the T2-weighted image between the test and retest scans in the left leg for the first patient, likely due to differences in the contact surface between the coil and the subject’s leg. (These regions were excluded from analysis). Additionally, slight differences in patient positioning and muscle compression could have resulted in kurtosis changes. To this end, in the remaining subjects the scan protocol will be optimized to improve consistency by standardizing the pressure exerted from the anterior coil onto the muscle. Given that only a total of 12 slices for each muscle group were included in this analysis, increased sample size and the more appropriate statistical analysis that comes with it will provide improved characterization of the repeatability. Ongoing analysis will provide insight for other muscle groups as well.
Acknowledgements
Barrow Neurological Foundation
References
1. Jensen, J.H. and Helpern, J.A. (2010), MRI quantification of non-Gaussian water diffusion by kurtosis analysis. NMR Biomed., 23: 698-710. https://doi.org/10.1002/nbm.1518.
2. Filli, L., Kenkel, D., Wurnig, M. C., and Boss, A. (2016) Diffusional kurtosis MRI of the lower leg: changes caused by passive muscle elongation and shortening. NMR Biomed., 29: 767– 775. doi: 10.1002/nbm.3529.
3. Marschar, A.M., Kuder, T.A., Stieltjes, B., Nagel, A.M., Bachert, P. and Laun, F.B. (2015), In vivo imaging of the time-dependent apparent diffusional kurtosis in the human calf muscle. J. Magn. Reson. Imaging, 41: 1581-1590. https://doi.org/10.1002/jmri.24743.
4. Fadnavis, J. Batson, E. Garyfallidis, Patch2Self: Denoising Diffusion MRI with Self-supervised Learning, Advances in Neural Information Processing Systems 33 (2020).
5. J.L.R. Andersson, S. Skare, J. Ashburner. How to correct susceptibility distortions in spin-echo echo-planar images: application to diffusion tensor imaging. NeuroImage, 20(2):870-888, 2003.
6. Jesper L. R. Andersson and Stamatios N. Sotiropoulos. An integrated approach to correction for off-resonance effects and subject movement in diffusion MR imaging. NeuroImage, 125:1063-1078, 2016.
7. Kikinis R, Pieper SD, Vosburgh K (2014) 3D Slicer: a platform for subject-specific image analysis, visualization, and clinical support. Intraoperative Imaging Image-Guided Therapy, Ferenc A. Jolesz, Editor 3(19):277–289 ISBN: 978-1-4614-7656-6. www.slicer.org.
8. Garyfallidis E, Brett M, Amirbekian B, Rokem A, van der Walt S, Descoteaux M, Nimmo-Smith I and Dipy Contributors (2014). DIPY, a library for the analysis of diffusion MRI data. Frontiers in Neuroinformatics, vol.8, no.8.
9. Marica Cutajar, Jonathan D. Clayden, Christopher A. Clark, Isky Gordon.Test–retest reliability and repeatability of renal diffusion tensor MRI in healthy subjects, European Journal of Radiology, Volume 80, Issue 3, 2011, Pages e263-e268, ISSN 0720-048X, https://doi.org/10.1016/j.ejrad.2010.12.018.
Figures