1722
Inter-scanner reproducibility and variability assessment of advanced liver diffusion MRI metrics1Radiomics Group, Vall d'Hebron Institute of Oncology, Vall d'Hebron Barcelona Hospital Campus, Barcelona, Spain, 2NMR Lab, Vall d'Hebron Institute of Oncology, Vall d'Hebron Barcelona Hospital Campus, Barcelona, Spain, 3Cardiff University Brain Research Imaging Centre, Cardiff University, Cardiff, United Kingdom, 4Institut de Diagnòstic per la Imatge (IDI), Catalonia, Spain, 5Department of Radiology, Hospital Universitari Vall d'Hebron, Barcelona, Spain, 6Siemens Healthineers, Madrid, Spain, 7Hospital Universitari de Bellvitge, L'Hospitalet de Llobregat, Spain
Synopsis
Innovative liver Diffusion-Weighted (DW) MRI aims to increase sensitivity and biological specificity of routine DW imaging, but may feature lower reproducibility due to longer scan times and acquisition of highly DW images. We assess inter-scanner reproducibility and variability of metrics from two novel approaches, T2-Intra-Voxel Incoherent Motion-Kurtosis (T2-IVIM-Kurtosis) and Diffusion-Relaxation Hepatic Imaging via Generalised Assessment of DiffusiOn Simulations (DR-HIGADOS), in two 1.5T scanners (Siemens Avanto; Philips Ingenia). Both methods are reproducible across scanners. Cellularity, intra-cellular diffusivity and vascular fraction show the highest measurement variability, implying that larger cohorts may be required in studies that focus on these indices.
Introduction
Diffusion-weighted (DW) MRI provides indices of tissue microstructure that are promising biomarkers in several liver conditions1–3. Recently, innovative acquisition and analysis techniques have been proposed4–6 to increase sensitivity and biological specificity of routine DW imaging. However, such novel methods require longer scan times and rely on the acquisition of highly DW measurements, typically noisier, impacting on repeatability and overall image quality7,8. In this study we quantify inter-scanner reproducibility and total variability of metrics from two such approaches, the T2-Intra-Voxel Incoherent Motion-Kurtosis (T2-IVIM-Kurtosis)4,9 and Diffusion-Relaxation Hepatic Imaging via Generalised Assessment of DiffusiOn Simulations (DR-HIGADOS)6 models, as obtained from clinical 1.5T scanners. Our results inform the design of clinical studies that rely on these novel imaging techniques.Methods
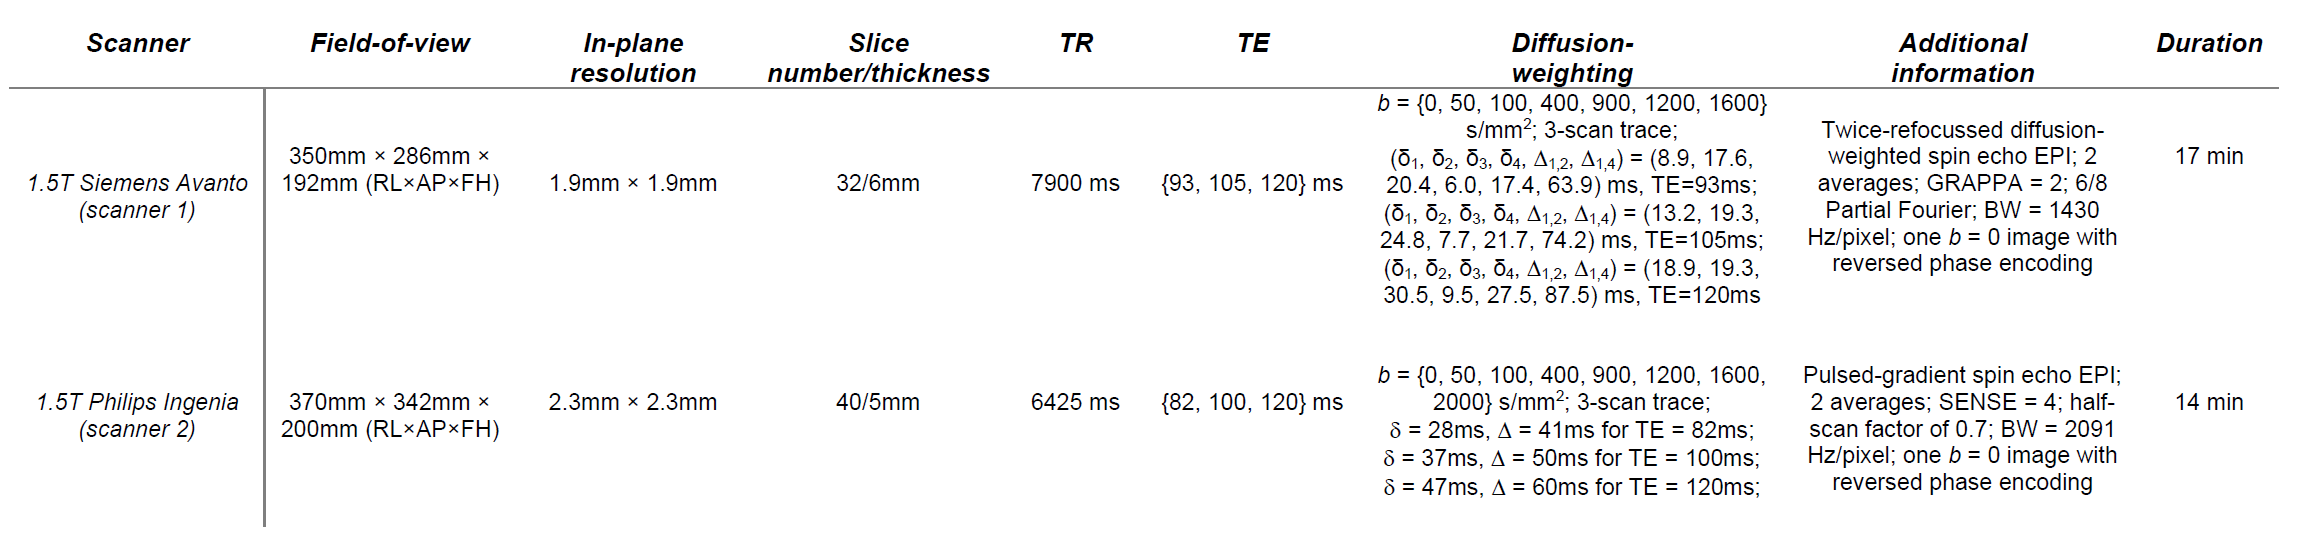
MRI acquisitionA 34 healthy male was scanned three times on each of a 1.5T Siemens Avanto (scanner 1) and 1.5T Philips Ingenia (scanner 2) systems, following informed written consent. DW scans featuring acquisition of multiple b-values, echo times and diffusion times were acquired (Table 1).
Post-processing
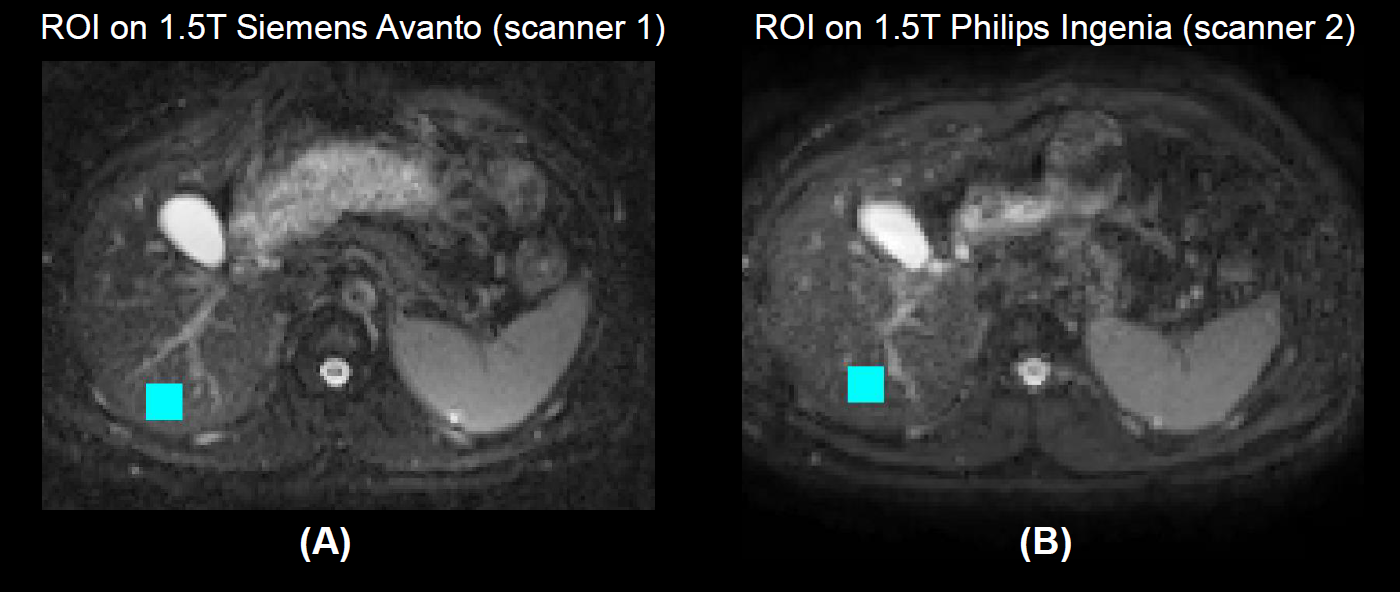
Scans were denoised10 and corrected for Gibbs ringing11, motion and distortions12. A 360 mm2-square region-of-interest (ROI) was drawn manually in all scans at a corresponding location in the right lobe (Figure 1).
Diffusion analysis
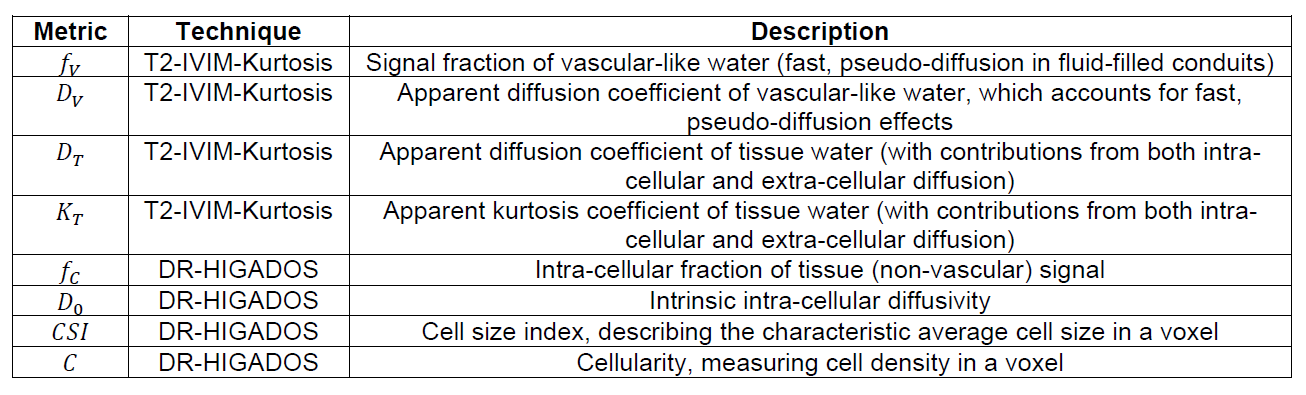
T2-IVIM-Kurtosis and DR-HIGADOS metrics were computed. Table 2 reports a description of all metrics.
T2-IVIM-Kurtosis The two-pool T2-IVIM-Kurtosis model
$$ s(b,TE) \,\,=\,\, s_0\,\left(f_V e^{-bD_V \,-\,\frac{TE}{T_{2V}} } \,\,+\,\, (1-f_V ) e^{-bD_T \,+\,\frac{1}{6}(bD_T)^2K_T \,-\,\frac{TE}{T_{2T}} }\right)\,\,[Eq.1]$$
unifying the T2-IVIM9 and IVIM-Kurtosis4 extensions of intra-voxel incoherent motion (IVIM) imaging13, was fitted with qMRI-Net14. This provided estimates of $$$f_V$$$ (vascular signal fraction); $$$T_{2V}$$$/$$$T_{2T}$$$ (vascular/tissue T2); $$$D_{V}$$$/$$$D_{T}$$$ (vascular/tissue apparent diffusion coefficients (ADC)); $$$K_{T}$$$ (tissue apparent kurtosis). Diffusion properties $$$f_V$$$, $$$D_V$$$, $$$D_T$$$, $$$K_T$$$ were considered in downstream analyses.
DR-HIGADOS High b-value measurements ($$$b\,\,\geq$$$ 1200 s/mm2) were analysed under the hypothesis that these are dominated by the intra-cellular signal15,16. This assumption is justified by the fact that liver extra-cellular diffusivities of 2.6-2.8 μm2/ms have been reported5, implying that less than 5% of the extra-cellular signal survives 1200 s/mm2 ($$$e^{-1.2 \,\,\cdot\,\, 2.6}$$$~ 0.044). Briefly:
Step A) High b-value DW measurements were normalised to remove dependence on the vascular signal fraction $$$f_V$$$ and intra-cellular relaxation time $$$T_{2C}$$$, approximating $$$T_{2C} \,\,\approx\,\, T_{2T}$$$ and using $$$f_V$$$ and $$$T_{2T}$$$ from T2-IVIM-Kurtosis fitting;
Step B) Normalised DW measurements from Step A were compared to a dictionary of synthetic intra-cellular signals17,18, enabling estimation of intra-cellular signal fraction $$$f_C$$$ and diffusivity $$$D_0$$$, cell size index $$$CSI$$$ and cellularity19 $$$C$$$, defined as $$$C = \frac{\,(1 - f_V)\,f_C\,}{CSI^3}$$$.
Inter-scanner difference and variability assessment
A linear regression model
$$m \,\,=\,\, \alpha \,+\, \beta\,\,(n-1)\,\,[Eq.2]$$
was fitted for all MRI metrics. Above, $$$m$$$ indicates the ROI median of a metric; $$$n$$$ is the scanner index ($$$n$$$= {1,2} for scanner {1,2}); $$$\alpha$$$ is the metric value in scanner 1; $$$\alpha + \beta$$$ is the metric value in scanner 2; $$$\beta$$$ is the inter-scanner difference. Additionally, a Coefficient of Variation (CoV)
$$CoV \,\,=\,\ 100 \,\, \frac{IQR}{ \frac{\alpha}{2} \,+\,\frac{\,\,\alpha + \beta}{2}\,\,},\,[Eq.3]\,\,$$
estimating a metric total variability, was computed. In Eq. 3, IQR indicates the interquartile range of a metric across scanners and sessions.
Results and discussion
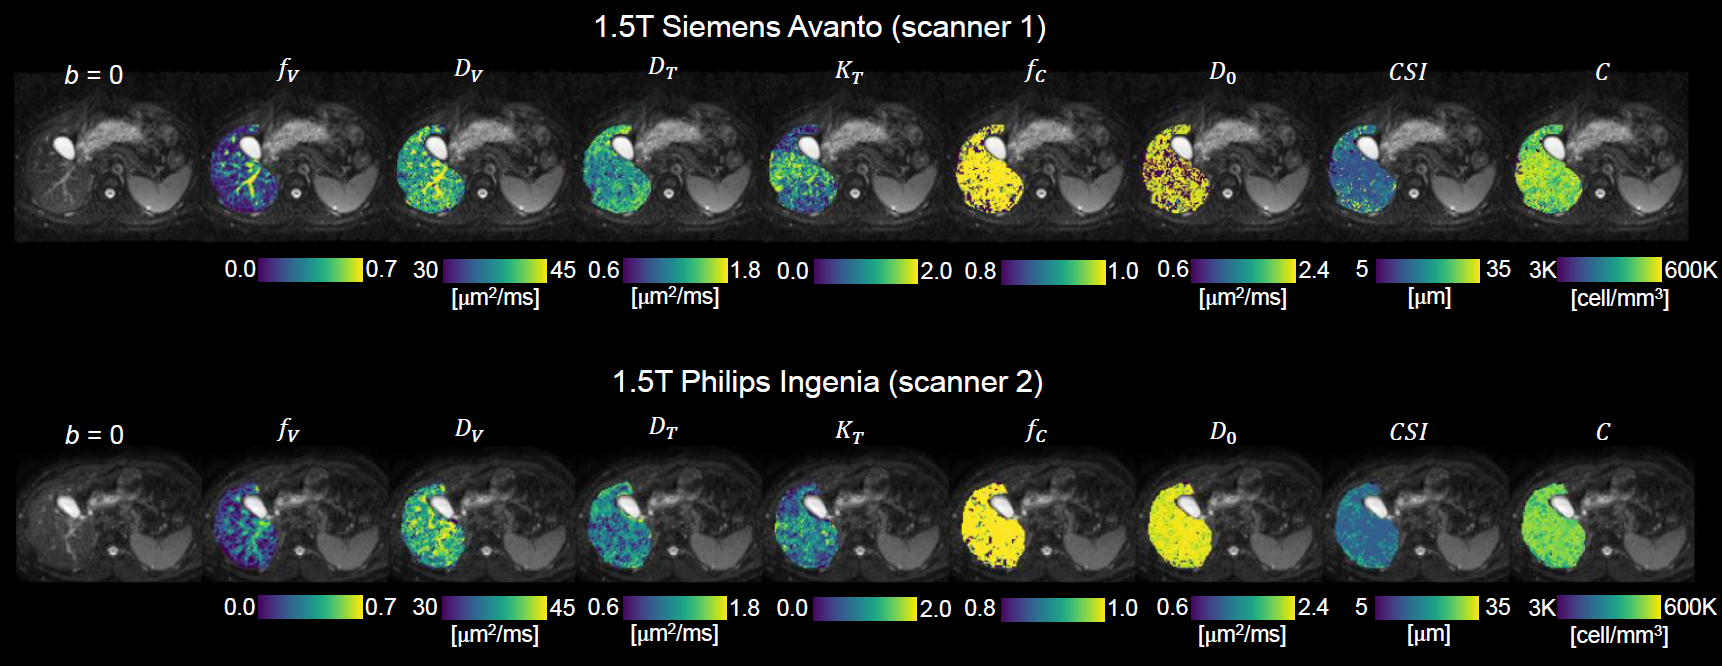
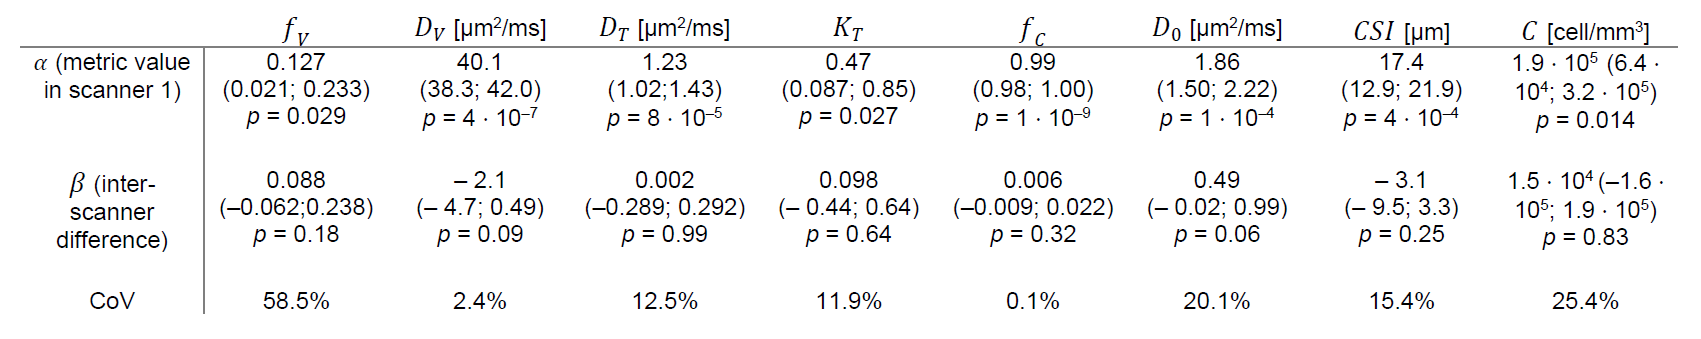
Figure 2 shows T2-IVIM-Kurtosis and DR-HIGADOS maps obtained in both scanners. The maps demonstrate known features of liver anatomy, i.e., high vascular fraction $$$f_V$$$ in correspondence of large vessels. Other trends are also seen consistently in the two systems, i.e., $$$D_T$$$ lower in the right than in the left lobe, in line with known regional ADC variations7. The same inter-tissue contrast is replicated in $$$CSI$$$, and mirrored in $$$K_T$$$ and $$$C$$$. The intra-cellular fraction $$$f_C$$$ is high and uniform across the whole organ, a finding plausible in the healthy liver where hepatocytes can account for up to 85% of the liver mass20. The intrinsic intra-cellular diffusivity $$$D_0$$$, notoriously difficult to estimate21, shows patchy variations in scanner 1, especially in the right lobe. Conversely, the same map is smoother in scanner 2.Table 3 reports figures of inter-scanner differences and total variability (CoV) for all metrics. No statistically significant inter-scanner differences are seen (no p-values smaller than 0.05 are obtained for $$$\beta$$$). In future, we plan to recruit additional volunteers to increase the statistical power of our inter-scanner regression analysis.
Regarding CoV, all metrics apart from vascular fraction $$$f_V$$$, intra-cellular diffusivity $$$D_0$$$ and cellularity $$$C$$$ exhibit CoV smaller than 15% (58.5% for $$$f_V$$$, 20.1% for $$$D_0$$$, 25.4% for $$$C$$$). The high CoV for $$$f_V$$$ may result from the limited number of perfusion-sensitive (b < 100 s/mm2) measurements. $$$CSI$$$ shows slightly higher CoV than diffusion parameter from T2-IVIM-Kurtosis (CoV of 15.4% for $$$CSI$$$ against 12.5% for $$$D_T$$$ and 11.9% for $$$K_T$$$). Finally, $$$f_C$$$ shows very low variability (CoV < 1%), being consistently close to 1 in the whole organ.
Conclusions
Advanced T2-IVIM-Kurtosis and DR-HIGADOS provide reproducible metrics across two 1.5T clinical MRI systems from two major manufacturers. Cellular properties (cellularity and intra-cellular diffusivity) and vascular fraction show the highest levels of variability. This implies that larger cohorts may be required in group studies to detect differences in these three metrics, as compared to other indices object of this investigation.Acknowledgements
This project has received support from ”la Caixa” Foundation (RTI2018-095209-B-C21), Spanish Ministry of Science and Innovation (FIS-G64384969), and from the investigator-initiated PREdICT study at the Vall d'Hebron Institute of Oncology (Barcelona), funded by AstraZeneca. KB is funded by a Beatriu de Pinós post-doctoral grant (2019BP/00182). RPL is supported by a CRIS Foundation Talent Award (TALENT19-05), the Instituto de Salud Carlos III-Investigación en Salud (PI18/01395) and the Prostate Cancer Foundation Young Investigator Award. MP is supported by UKRI Future Leaders Fellowship (MR/T020296/1). AstraZeneca, Siemens and Philips did not influence data acquisition and analysis, result interpretation and the decision to submit this work in its present form.References
1. Faria SC, Ganesan K, Mwangi I, et al. MR Imaging of Liver Fibrosis: Current State of the Art. RadioGraphics 2009;29:1615–1635, doi: 10.1148/rg.296095512.
2. Forner A, Reig M, Bruix J. Hepatocellular carcinoma. Lancet 2018;391:1301–1314, doi: 10.1016/S0140-6736(18)30010-2.
3. Lincke T, Zech CJ. Liver metastases: Detection and staging. Eur. J. Radiol. 2017;97, doi: 10.1016/j.ejrad.2017.10.016.
4. Liu Y, Wang X, Cui Y, et al. Comparative Study of Monoexponential, Intravoxel Incoherent Motion, Kurtosis, and IVIM-Kurtosis Models for the Diagnosis and Aggressiveness Assessment of Prostate Cancer. Front. Oncol. 2020;10, doi: 10.3389/fonc.2020.01763.
5. Jiang X, Xu J, Gore JC. Mapping hepatocyte size in vivo using temporal diffusion spectroscopy MRI. Magn. Reson. Med. 2020;84:2671–2683, doi: 10.1002/mrm.28299.
6. Grussu F, Barba I, Bernatowicz K, et al. DR-HIGADOS: a new diffusion-relaxation framework for clinically feasible microstructural imaging of the liver. Proceedings of ISMRM 2021, p. 0699.
7. Chen X, Qin L, Pan D, et al. Liver Diffusion-weighted MR Imaging: Reproducibility Comparison of ADC Measurements Obtained with Multiple Breath-hold, Free-breathing, Respiratory-triggered, and Navigator-triggered Techniques. Radiology 2014;271:113–125, doi: 10.1148/radiol.13131572.
8. Boss A, Barth B, Filli L, et al. Simultaneous multi-slice echo planar diffusion weighted imaging of the liver and the pancreas: Optimization of signal-to-noise ratio and acquisition time and application to intravoxel incoherent motion analysis. Eur. J. Radiol. 2016;85:1948–1955, doi: 10.1016/j.ejrad.2016.09.002.
9. Jerome NP, D’Arcy JA, Feiweier T, et al. Extended T2-IVIM model for correction of TE dependence of pseudo-diffusion volume fraction in clinical diffusion-weighted magnetic resonance imaging. Phys. Med. Biol. 2016;61:N667–N680, doi: 10.1088/1361-6560/61/24/N667.
10. Veraart J, Novikov DS, Christiaens D, Ades-aron B, Sijbers J, Fieremans E. Denoising of diffusion MRI using random matrix theory. Neuroimage 2016;142:394–406, doi: 10.1016/j.neuroimage.2016.08.016.
11. Kellner E, Dhital B, Kiselev VG, Reisert M. Gibbs-ringing artifact removal based on local subvoxel-shifts. Magn. Reson. Med. 2016;76:1574–1581, doi: 10.1002/mrm.26054.
12. Andersson JLR, Skare S, Ashburner J. How to correct susceptibility distortions in spin-echo echo-planar images: application to diffusion tensor imaging. Neuroimage 2003;20:870–888, doi: 10.1016/S1053-8119(03)00336-7.
13. Le Bihan D, Breton E, Lallemand D, Grenier P, Cabanis E, Laval-Jeantet M. MR imaging of intravoxel incoherent motions: application to diffusion and perfusion in neurologic disorders. Radiology 1986;161:401–407, doi: 10.1148/radiology.161.2.3763909.
14. Grussu F, Battiston M, Palombo M, Schneider T, Wheeler-Kingshott CAMG, Alexander DC. Deep learning model fitting for diffusion-relaxometry: a comparative study. Proceedings of 2020 MICCAI workshop on Computational Diffusion MRI; 2021, pp. 159–172, doi: 10.1007/978-3-030-73018-5_13.
15. McKinnon ET, Helpern JA, Jensen JH. Modeling white matter microstructure with fiber ball imaging. Neuroimage 2018;176:11–21, doi: 10.1016/j.neuroimage.2018.04.025.
16. Veraart J, Nunes D, Rudrapatna U, et al. Noninvasive quantification of axon radii using diffusion MRI. Elife 2020;9, doi: 10.7554/eLife.49855.
17. Palombo M, Ianus A, Guerreri M, et al. SANDI: A compartment-based model for non-invasive apparent soma and neurite imaging by diffusion MRI. Neuroimage 2020; 215:116835, doi: 10.1016/j.neuroimage.2020.116835.
18. Buizza G, Paganelli C, Ballati F, et al. Improving the characterization of meningioma microstructure in proton therapy from conventional apparent diffusion coefficient measurements using Monte Carlo simulations of diffusion MRI. Med. Phys. 2021;48:1250–1261, doi: 10.1002/mp.14689.
19. Panagiotaki E, Chan RW, Dikaios N, et al. Microstructural Characterization of Normal and Malignant Human Prostate Tissue With Vascular, Extracellular, and Restricted Diffusion for Cytometry in Tumours Magnetic Resonance Imaging. Invest. Radiol. 2015;50:218–227, doi: 10.1097/RLI.0000000000000115.
20. Zhou Z, Xu M-J, Gao B. Hepatocytes: a key cell type for innate immunity. Cell. Mol. Immunol. 2016;13:301–315, doi: 10.1038/cmi.2015.97.
21. Jelescu IO, Veraart J, Fieremans E, Novikov DS. Degeneracy in model parameter estimation for multi-compartmental diffusion in neuronal tissue. NMR Biomed. 2016;29:33–47, doi: 10.1002/nbm.3450.
Figures