1721
Value of integrated 18F-FDG PET with fractional order calculus model-based MRI and DKI to evaluate the proliferation of lung squamous cell carcinoma1Department of Radiology, Henan University People’s Hospital & Henan Provincial People’s Hospital, School of Basic Medicine, Zhengzhou, China, 2Department of Radiology, Zhengzhou University People’s Hospital & Henan Provincial People’s Hospital, Academy of Medical Sciences, Zhengzhou, China, 3Henan Provincial People’s Hospital, Zhengzhou, China, 4Department of Radiology, Zhengzhou University People’s Hospital & Henan Provincial People’s Hospital, Zhengzhou, China, 5Department of Radiology, Henan University People’s Hospital & Henan Provincial People’s Hospital, Zhengzhou, China, 6XinxiangMedical University & Henan Provincial People’s Hospital, Xinxiang&Zhengzhou, Zhengzhou, China, 7Central Research Institute, UIH Group, Shanghai, China., Shang Hai, China, 8Beijing United Imaging Research Institute of Intelligent Imaging, Bei Jing, China, 9Henan Provincial People's Hospital, Zhengzhou, China
Synopsis
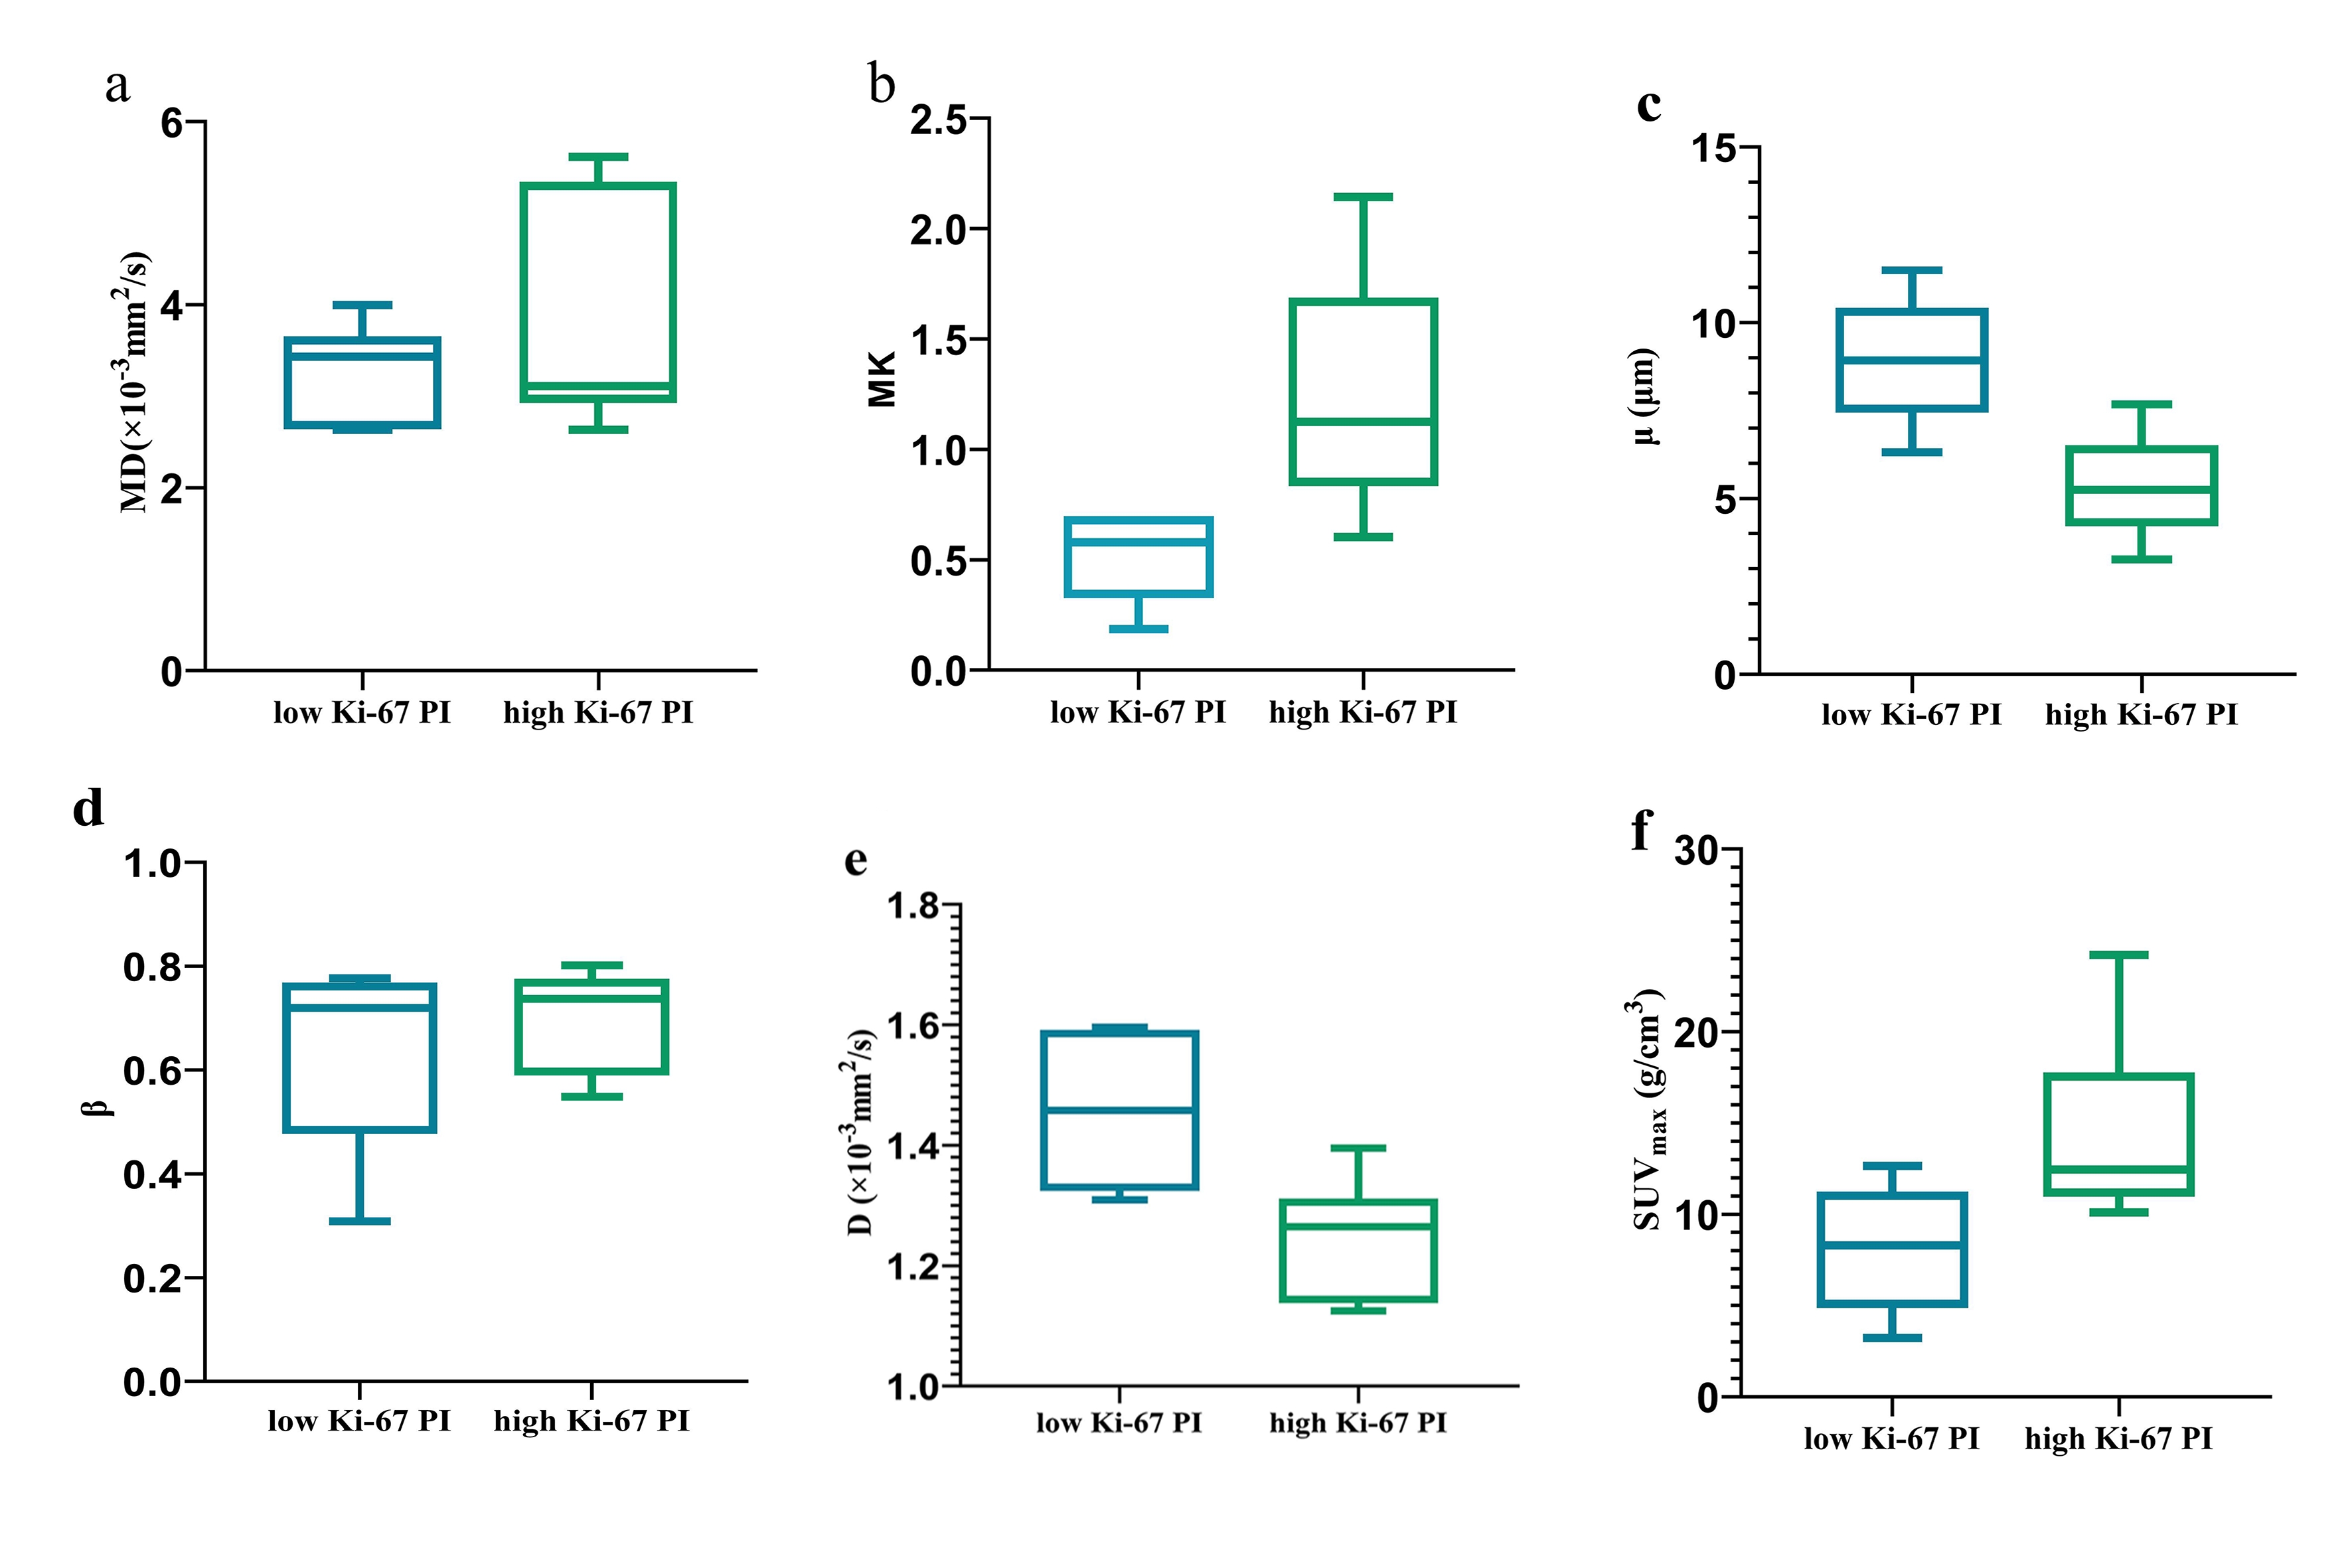
18F-FDG-PET/MRI combines the functional and metabolic characteristics of PET with the good soft-tissue contrast of MRI. The results showed that high Ki-67-expressing tumors showed lower D and μ values and higher MK and SUVmax values. In addition, the diagnostic efficacy of all parameters is similar.
Introduction
Lung cancer is one of the most common malignancies worldwide and lung squamous cell carcinoma (LUSC), a subtype of lung cancer, has a specific pathological type and its specific therapeutic approach1. Ki-67 proliferation index (PI) plays an important role in providing information on tumor behavior, treatment response, and prognosis. 18F-FDG PET/MRI combines the functional and metabolic characteristics of PET with the good soft-tissue contrast of MRI, which can provide more accurate diagnostic results for lung cancer. Due to the complex structure of human tissues, single-exponential models cannot provide information that responds to changes in tissue structure and composition. Several models such as diffusion kurtosis imaging (DKI) and fractional order calculus models (FROC)2 have been proposed in recent years. Some new parameters could be obtained: Diffusion coefficient (D), fractional order derivative in space (β), a spatial parameter (μ), mean diffusion kurtosis (MK) and mean diffusion coefficient (MD). Currently, the value of PET/MRI in LUSC proliferation is unknown, therefore, this study aimed to combine PET with FROC model and MR imaging with DKI for the assessment of LUSC proliferation.Materials and Methods
The study protocol was reviewed and approved by the local ethics committee and written informed consent was obtained. In this study, a total of twelve cases of LUSC, six cases of low Ki-67 PI, and six of high Ki-67 PI were selected to be pathologically diagnosed. We divided the Ki-67 proliferation index into a high proliferation state (Ki-67 PI > 50%) and a low value-added state (Ki-67 PI ≤ 50%)3. MRI was performed on a hybrid 3.0T PET/MR scanner (uPMR790, UIH, Shanghai, China) with a 12 channels phased-array body coil. The PET tracer is 18F‑FDG. The patient was fasting blood glucose less than 8.0 mmol/L and then was intravenous injected according to the standard dose of 4.07MBq/kg. The FROC model-based MR imaging sequence was set with the following parameters: TR= 1620 ms, TE= 69.6 ms; b-values = 0, 25, 50, 100, 150, 200, 400, 600, 800, and 1000 s/mm2, number of averages =1, 1, 2, 2, 4, 4, 6, 6, 8, 10. The DKI sequence was set with the following parameters: TR= 1210 ms, TE= 86.0 ms; b-values = 0, 500, 1000, and 2000 s/mm2, number of averages =1, 4, 8, 8. Two radiologists were asked to draw the volumes of interest (VOIs) along the tumor border with the help of ITK-SNAP 3.5 software. The definitions of each VOI were based on the consensus of the abovementioned two radiologists. Before drawing VOIs, radiologists were blinded to the results of histopathological examination. On the United Imaging PET/MRI workstation, SUVmax is measured by the VOIs of the PET image. SPSS 25.0 was used for statistical analysis, Medclc 15.2.2 software was used for drawing, U test was used for analysis inter-groups, the diagnostic efficacy of each parameter was evaluated by ROC curve, and the AUCs of different parameters were compared by Delong test. p<0.05 was considered statistically significant.Results
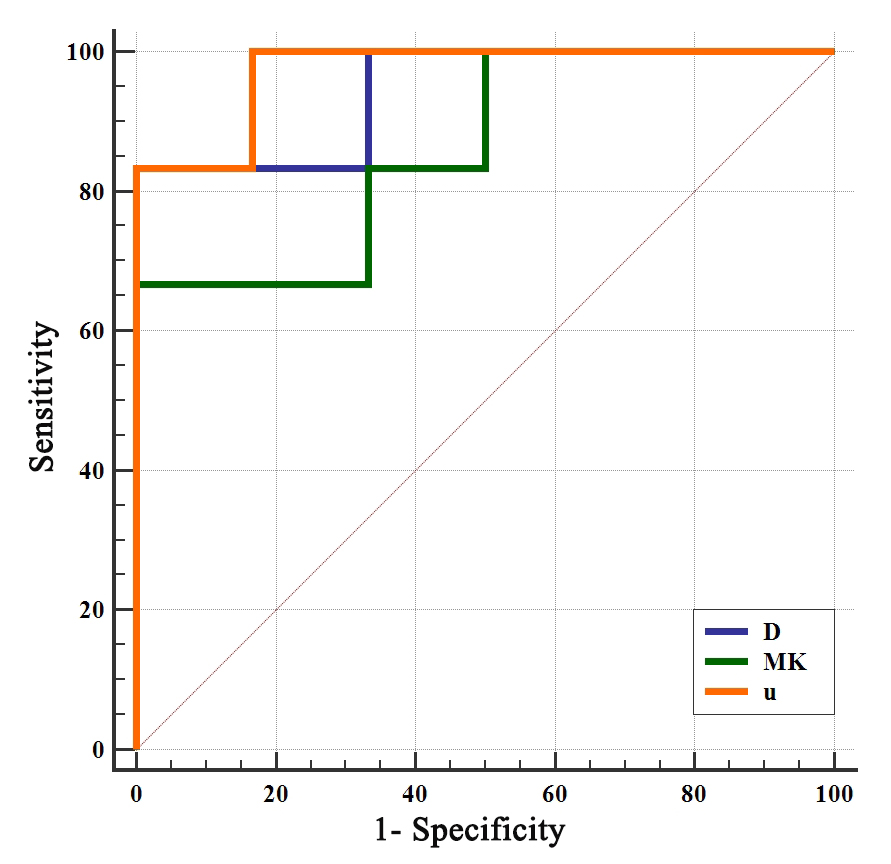
D, μ, MK and SUVmax were significantly different between the high Ki-67 PI group and low Ki-67 PI group. The D and μ values of the high Ki-67 PI group were significantly lower than those of the low Ki-67 PI group (Z = -2.722,, p = 0.009; Z = -2.562, p = 0.004, respectively) and the MK and SUVmax values of the high Ki-67 PI group were significantly lower than those of the low Ki-67 PI group (Z = -2.082, p = 0.041; Z = -2.242, p = 0.026, respectively). (Figure 1). The AUC values of the MK, D, μ and, SUVmax were 0.861 (95% CI, 0.547 - 0.987), 0.944 (95% CI, 0.652 - 1.000), and 0.972 (95% CI, 0.692 - 1.000), respectively, but there was no statistically significant difference between them. (Figure 2).Discussion
The D value is similar to the conventional ADC value. Diffusion coefficient usually correlated inversely with the tumor cell density4. The μ value has been suggested as a measure of diffusion mean free length, Previous studies found that μ was inversely related to the mean free length of diffusing molecules. In general, tumors with high Ki-67 expression are more aggressive and have rapid cell proliferation rapidly, resulting in higher cell density, increased cell volume, and reduced extracellular space5. Therefore, in LUSC with high Ki-67 expression, the diffusion distance and the degree of freedom of the diffusion of water molecules are reduced. The β-value and MK both have a negative correlation with heterogeneity and complexity of tumor microstructure4. However, the MK value in this study is meaningful and the β value is meaningless, which may be due to the small number of included cases, which needs to be investigated using more cases .Conclusion
Integrated 18F FDG/PET and non-Gaussian FROC model-based imaging, DKI can serve as a non-invasive and quantitative imaging technique for differentiating the proliferation of LUSCAcknowledgements
This work was supported by the Zhengzhou Collaborative Innovation Major Project (20XTZX05015); and the Henan provincial science and technology research projects (212102310689).References
1. Bray F, Ferlay J, Soerjomataram I, Siegel RL, Torre LA, Jemal A. Global cancer statistics 2018: GLOBOCAN estimates of incidence and mortality worldwide for 36 cancers in 185 countries. CA Cancer J Clin. 2018;68(6):394-424.
2. Sui Y, Wang H, Liu G, et al. Differentiation of Low- and High-Grade Pediatric Brain Tumors with High b-Value Diffusion-weighted MR Imaging and a Fractional Order Calculus Model. Radiology. 2015;277(2):489-496.
3. Warth A, Cortis J, Soltermann A, et al. Tumour cell proliferation (Ki-67) in non-small cell lung cancer: a critical reappraisal of its prognostic role. Br J Cancer. 2014;111:1222-1229.
4. Chen W, Zhu LN, Dai YM, et al. Differentiation of salivary gland tumor using diffusion-weighted imaging with a fractional order calculus model. Br J Radiol. 2020;93(1113):20200052.
5. Yuan M, Zhang YD, Zhu C, et al. Comparison of intravoxel incoherent motion diffusion-weighted MR imaging with dynamic contrast-enhanced MRI for differentiating lung cancer from benign solitary pulmonary lesions. J Magn Reson Imaging. 2016;43:669-679.
Figures