1719
Comparison between IVIM-DKI, MRE and DCE-Tofts quantitative techniques at 3.0 T multiparametric prostate protocol1MRI department, Fundación Escuela de Medicina Nuclear, Mendoza, Argentina, 2MRI department, Fundación Argentina para el Desarrollo en Salud, Mendoza, Argentina, 3GQNYCS, Comisión Nacional de Energía Atómica, Buenos Aires, Argentina, 4Instituto Balseiro, Universidad Nacional de Cuyo, San Carlos de Bariloche, Argentina, 5FCEN, Universidad Nacional De Cuyo, Mendoza, Argentina, 6General Electric- Healthcare, Sao Paulo-SP, Brazil, Brazil
Synopsis
Since there is no clear relationship between the coefficients of the DWI biexponential model and permeability and pharmacokinetics, we aim to correlate the coefficients associated to the IVIM-DKI model, MRE, and quantitative and semiquantitative maps of the multiparametric prostate protocol. Through a Python algorithm, the DWI data acquisition was fitted to an IVIM-DKI function after a semi-automatic segmentation. Then, PR, PCa and healthy tissue were evaluated, and the IVIM-DKI parametric maps were contrasted with the DCE and MRE through a Pearson’s correlation test. Empirical relationships were established between the pseudo-perfusion models, semiquantitative maps and the variables of the compartmental models.
INTRODUCTION
The intravoxel incoherent motion (IVIM) and diffusion kurtosis (DKI) models involve the analysis of diffusion-weighted images (DWI) to evaluate all types of water incoherent motion allowing to characterize different prostate pathologies. Two behaviours can be observed; IVIM models the blood microcirculation (random walk) in the randomly distributed micro-capillary network (pseudo-diffusion), and DKI analyzes the non-Gaussian movement of water protons in the intra- and extra- cellular space. Through bipolar gradients the speed of protons is codified in the tissue environment; low $$$b$$$-values are used to study microvasculature behaviour and high $$$b$$$-values analyze the signal attenuation due to DKI effects.Magnetic resonance elastography (MRE) quantifies the shear modulus (µ) from the displacement tensor, which is obtained with a sequence that uses a motion-encoding gradient. MRE characterizes the movement, therefore providing information of tissue stiffness. Finally, dynamic contrast-enhancement (DCE) MRI provides semi-quantitative information (CER: maximum enhancement ratio, BAT: bolus arrival time, IAUC: initial area under the time-to–signal intensity and MS: wash-in) about the T1 perfusion process. The Tofts compartment model measures the trace concentration of the contrast agent through the tissue and relates it with the pharmacokinetic parameters like $$$K^{\text{trans}},k_{\text{ep}}$$$ and $$$v_{\text{e}}$$$1.
The aim of this study is to relate the coefficients of the IVIM-DKI model, MRE stiffness information and quantitative and semi-quantitative maps in the multiparametric prostate protocol (mpMR).
MATERIALS AND METHODS
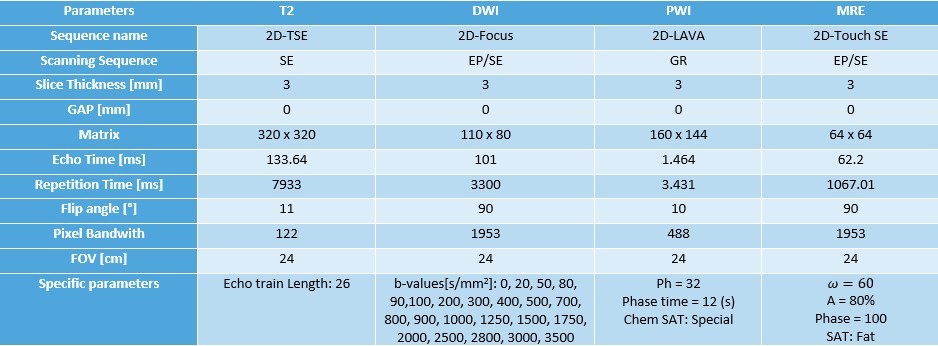
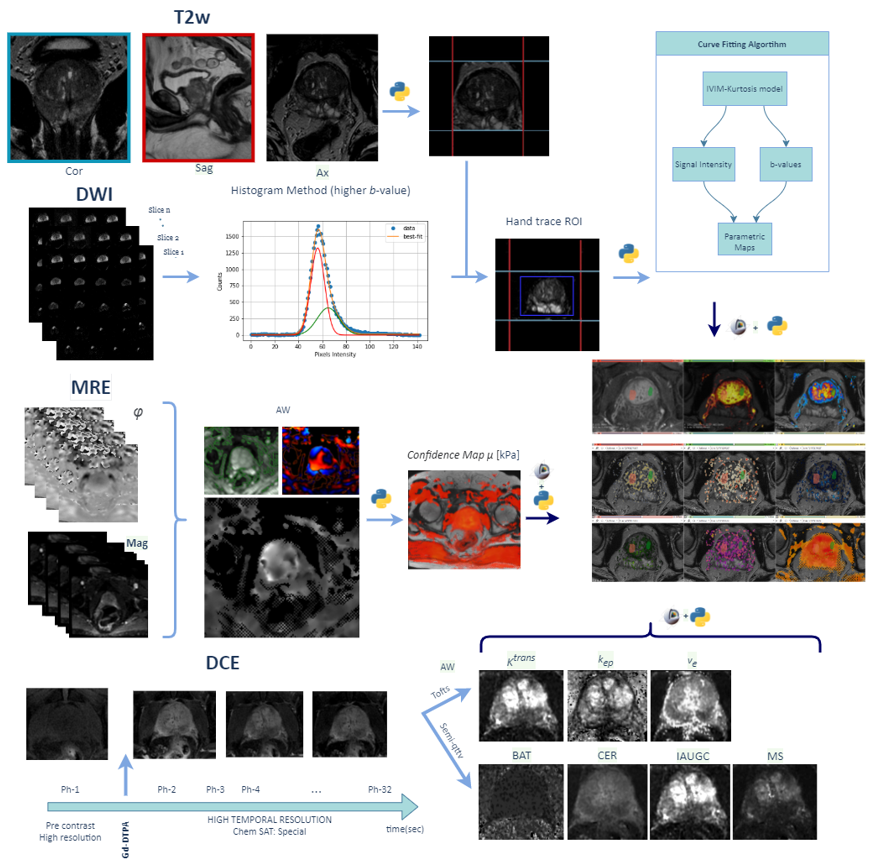
This prospective study was approved by the Institutional Review Board. The evaluation included 30 male patients (mean age: 62±8 ys, range: 38 ± 84 ys) with a clinical suspicion of prostate pathology: 12 prostate cancer (PCa) and 9 prostatitis (PR). The images were acquired at a 3.0T PET-MR General Electric (GE) scanner. A mpMR was performed including the following protocol: wT2 (three anatomic planes), DWI with 23 $$$b$$$-values, DCE (Gd-DTPA) and MR Elastography (Table 1). A semi-automatic segmentation was performed using: a) sagittal and coronal wT2 projections over the axial plane, b) histogram thresholding from an intensities Gaussian fitting, c) manual ROI traced on b0 DWI images. Using a Python algorithm (LMFIT, SimpleITK), DWI data acquisition was fitted (Levenberg-Marquardt method) to this IVIM-DKI function:$$M(b)=\left[S(b)^2+\text{NCF}\right]^{\frac{1}{2}},\text{where } S(b)=S(b_0)f \text{e}^{-bD^*}+S(b_0)\left(1-f\right) \text{e}^{-bD+b^2D^2{\frac{K}{6}}},$$
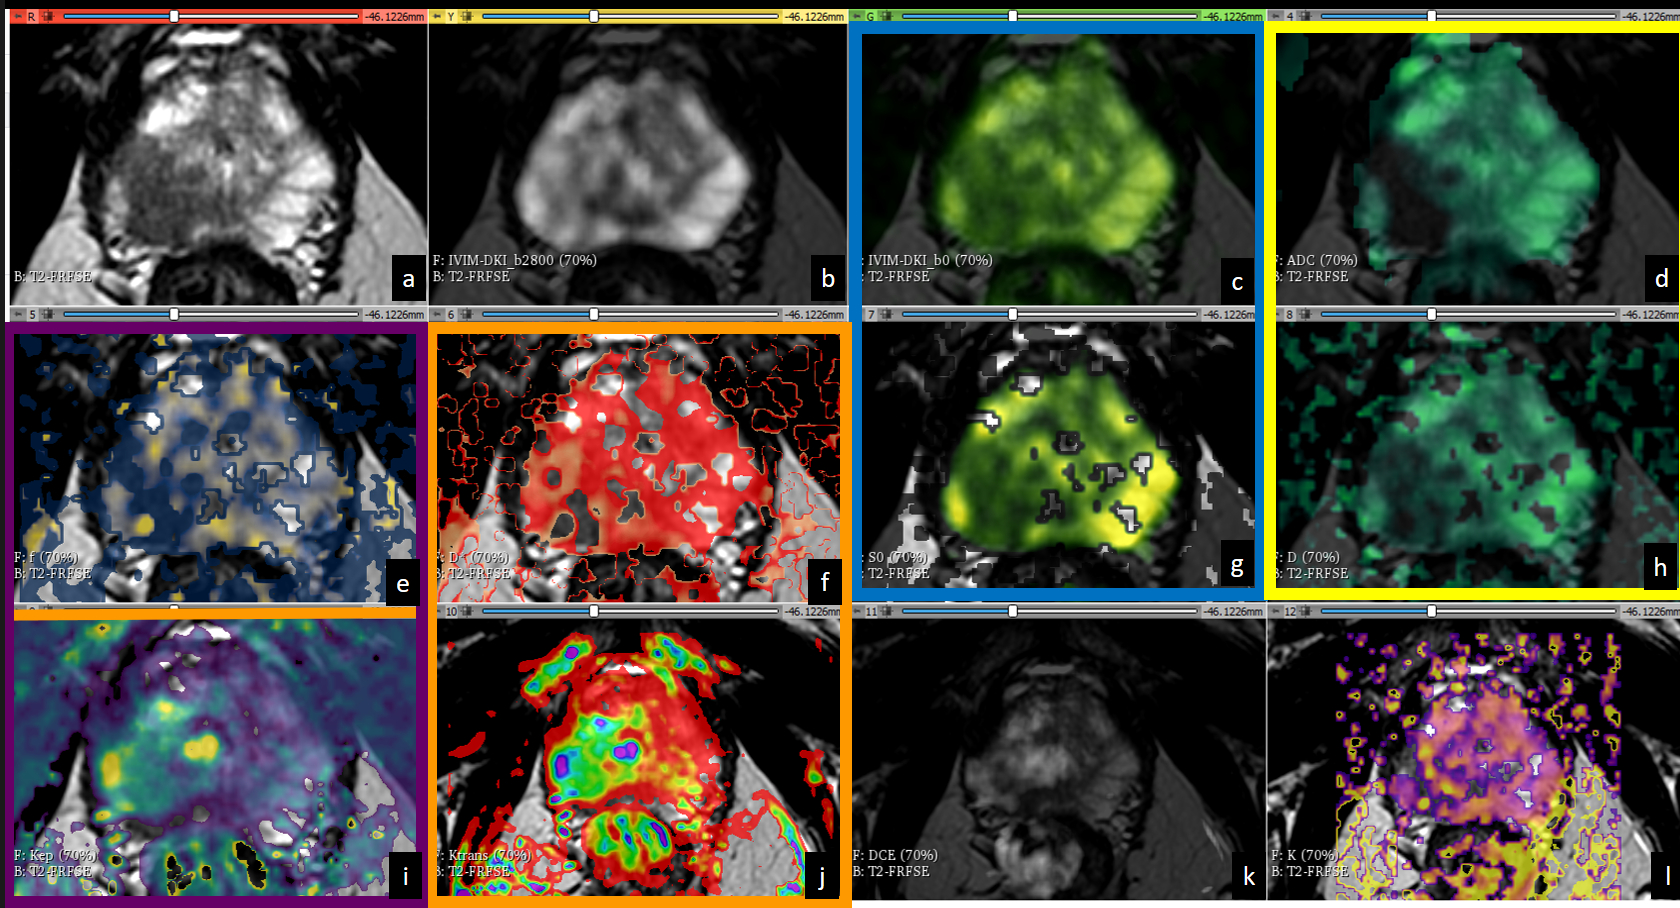
$$$f$$$ is the fraction of perfusion related to microcirculation and $$$D^*$$$, $$$D$$$ and $$$K$$$ are pseudo-diffusion, diffusion and kurtosis coefficients respectively. An independent noise correction factor (NCF) term was added, due to the rise of the noise influence with increasing $$$b$$$-value [b], calculated from a phantom acquisition.
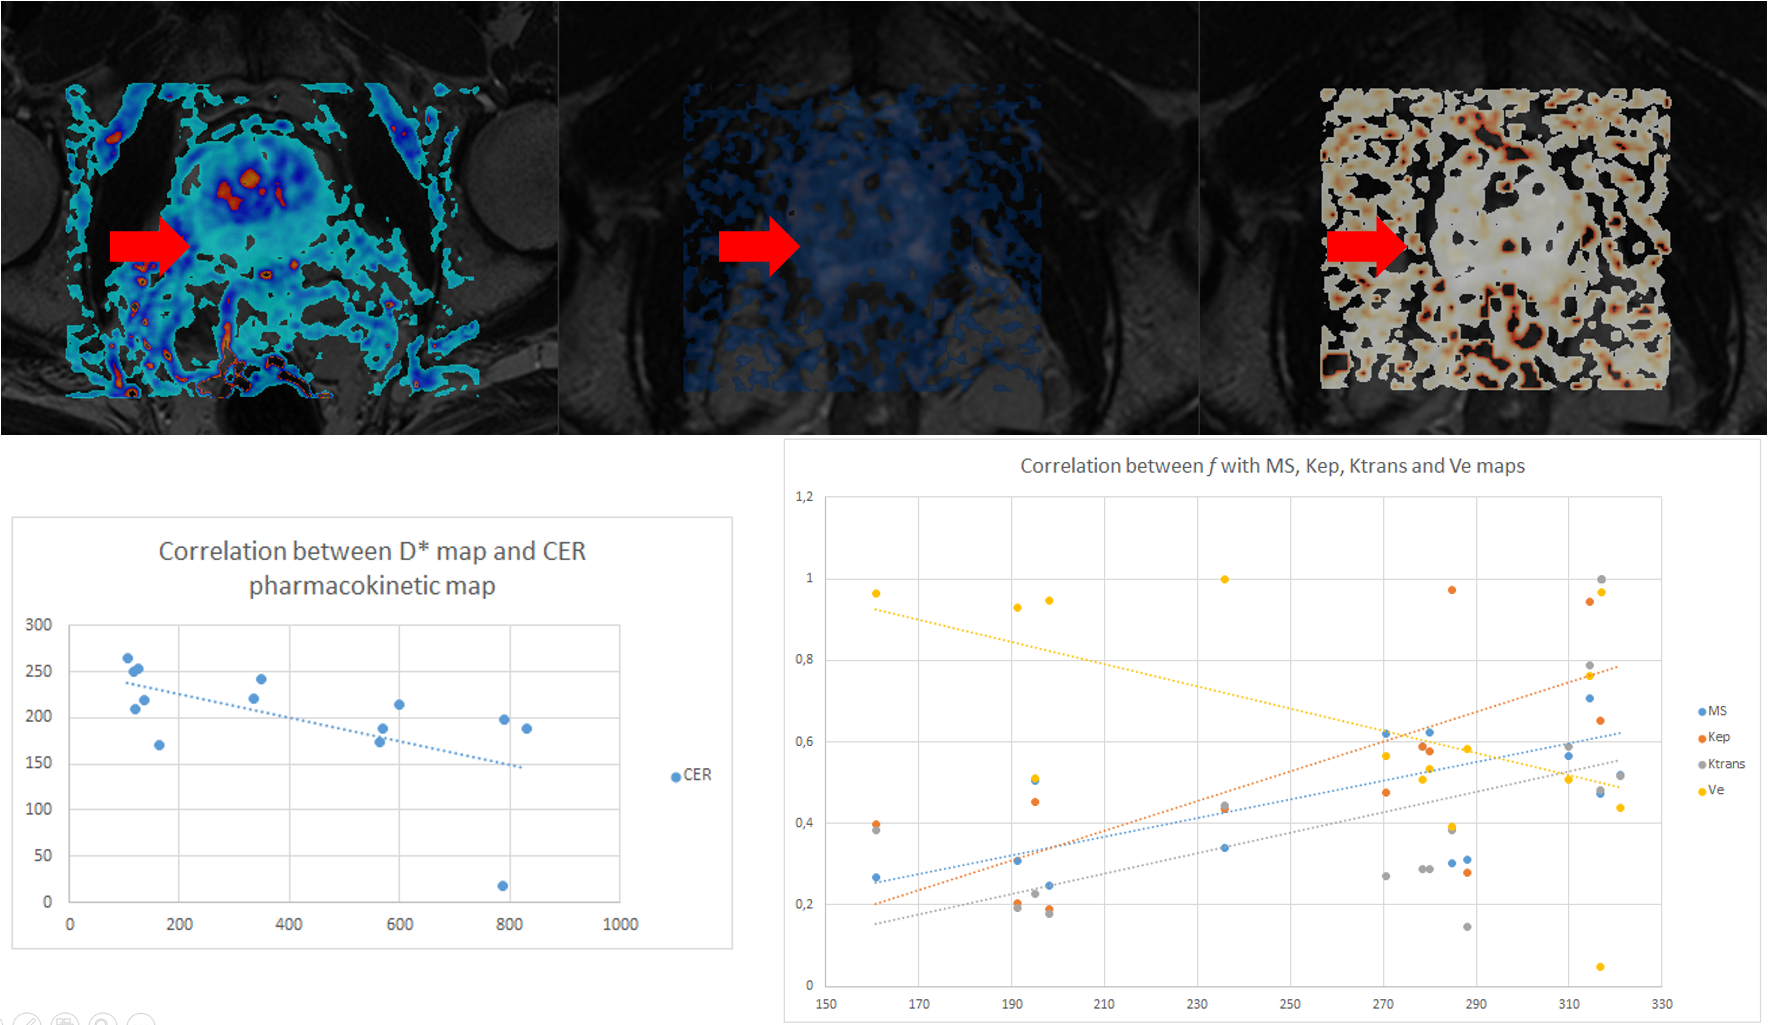
Both DCE and MRE maps were generated at the VolumeShare 5 workstation (GE) and a Python algorithm was implemented to calculate the confidence maps and add some DICOM features to improve visualization (Fig. 1). In order to solve the Tofts model, the arterial input function was defined with a semiautomatic vessel detection based on the inferior vesical artery signal. Two expert abdominal radiologists evaluated the studies, and the lesions were characterized following the PI-RADS v2 guidelines. An open-source software (3D-Slicer V4.11) was used to: a) implement landmark registration using wT2 as a fixed volume, b) trace manual ROIs (considering a 95% confidence level) to evaluate PR, PCa and healthy tissue (HT) and c) compare the IVIM-DKI parametric maps with the DCE and MRE. This evaluation was performed through Pearson's correlation coefficients (accepting $$$|r|>0.5$$$ as a good correlation) using IBM-SPSS v25. Visual analysis of the comparison between the $$$S(b_0)$$$ fit and $$$b_0$$$-value image intensities was implemented as a quality control. An ANOVA test was applied considering a $$$p<0.05$$$ as significantly different.
RESULTS
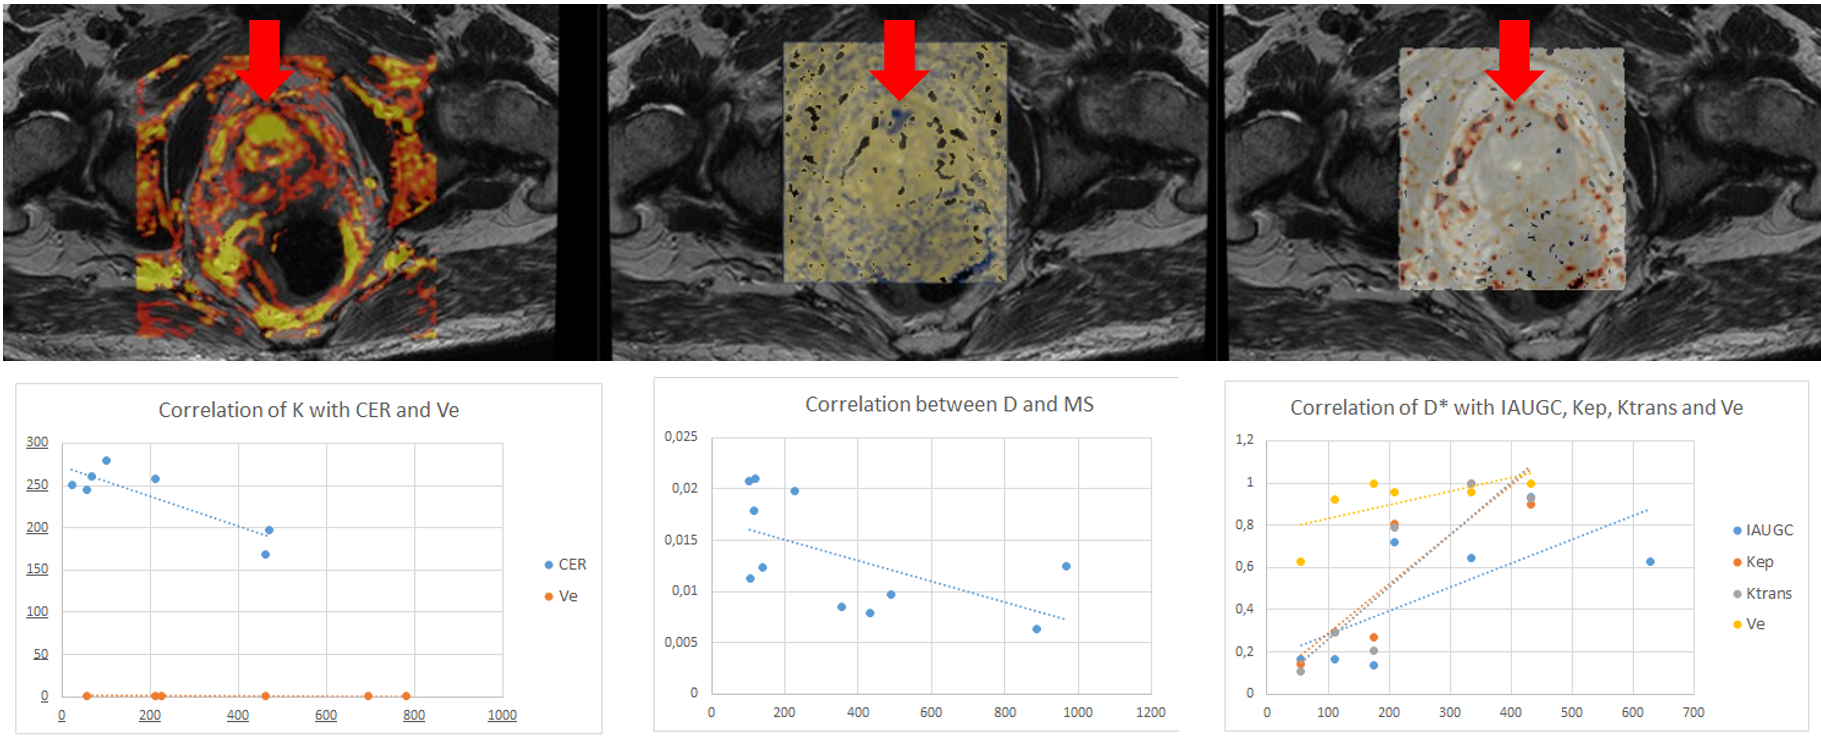
Both the diffusion coefficients ($$$D$$$ and ADC) and the quality control $$$S(b_0)$$$ showed a visual correlation. Regarding DWI acquisition, in 87% of patients it was determined by the histogram method that at b values above 2800, the signal obtained corresponded only to Gaussian noise, even considering the NCF coefficient which was determined to be 5.6(0.8). When studying the three populations, the D* and K coefficients did not reject the null hypothesis while for D and f p=0.15 and p=0.48 were obtained respectively. The three populations are statistically different in the D coefficient, while for f, patients with PT and CA are not differentiable.Analyzing the correlation of maps, in subjects with PCa, there was a correlation between $$$f$$$ with IAUGC, $$$k_{\text{ep}}$$$ and MS, between $$$D^*$$$ with IAUGC, $$$k_{\text{ep}}$$$, $$$K^{\text{trans}}$$$ and $$$v_{\text{e}}$$$, between $$$D$$$ with MS, $$$k_{\text{ep}}$$$ and $$$v_{\text{e}}$$$. In patients with PR there was a correlation of $$$D^*$$$ with CER and of $$$f$$$ with MS, $$$k_{\text{ep}}$$$, $$$K^{\text{trans}}$$$ and $$$v_{\text{e}}$$$.
CONCLUSIONS AND DISCUSSION
Based on the values of the coefficients and the fitting of $$$S(b_0)$$$, the good performance of the fitting algorithm designed in Python was verified. Specific correlations were defined between the coefficients derived from DWI and those from DCE. The relationships proposed by Le Bihan et al 2, who proposed a direct relationship between f and CBF (analogous to IAUGC), were corroborated.Acknowledgements
This project is part of a research agreement with General Electric Healthcare (GE). We wish to extend our special thanks to Thomas Doring and Cristian Allard from the GE Research Team.References
1. Tofts, P. S., Brix, G., Buckley, D. L., Evelhoch, J. L., Henderson, E., Knopp, M. V., ... & Weisskoff, R. M. (1999). Estimating kinetic parameters from dynamic contrast‐enhanced T1‐weighted MRI of a diffusable tracer: standardized quantities and symbols. Journal of Magnetic Resonance Imaging: An Official Journal of the International Society for Magnetic Resonance in Medicine, 10(3), 223-232.
2. D. L. Bihan y R. Turner, «The capillary network: a link between ivim and classical perfusion», Magn. Reson. Med., vol. 27, n.o 1, pp. 171-178, sep. 1992.
3. Le Bihan, D. (2019). What can we see with IVIM MRI?. Neuroimage, 187, 56-67.
4. Le Bihan, D., Ichikawa, S., & Motosugi, U. (2017). Diffusion and intravoxel incoherent motion MR imaging–based virtual elastography: a hypothesis-generating study in the liver. Radiology, 285(2), 609-619
Figures