1718
2D (b-M1) Data Sampling and Blood Velocity Standard Deviation Distribution Fitting for Repeatable Tri-exponential IVIM Quantification1Radiology, University of Wisconsin-Madison, Madison, WI, United States, 2Medical Physics, University of Wisconsin-Madison, Madison, WI, United States
Synopsis
There is growing evidence of tri-exponential IVIM-DWI signal behavior in the liver. However, tri-exponential estimates often suffer from the instability associated with separating three decaying signal components sampled along a single dimension (i.e., b-value). In this work, standard monopolar and noise-optimized 2D (b-M1) data sampling schemes were acquired. From each acquisition, tri-exponential ROI-based fitting and a blood velocity standard deviation distribution (BVD) fitting method were performed. The estimated tri-exponential parameters were compared across acquisitions and fitting methods. Repeatable tri-exponential IVIM estimates were obtained using the 2D data sampling combined with BVD fitting. A new, physical tri-exponential model is also proposed.
Introduction
Traditionally, the intravoxel incoherent motion (IVIM) DWI signal has been modeled as a bi-exponential decay containing one diffusion and one perfusion component.1 However, there is growing evidence of tri-exponential IVIM-DWI signal behavior (one diffusion component and two perfusion components) in the liver.2-6 Despite this evidence, tri-exponential estimates suffer from instability associated with separating three decaying signal components sampled along a single dimension (i.e., b-value). Recently, a method for stable bi-exponential IVIM parameter mapping using 2D (b-M1) noise-optimized IVIM-DWI data samplings was proposed.7 Therefore, the purpose of this work was to evaluate the feasibility of using 2D IVIM-DWI sampling to obtain repeatable tri-exponential IVIM estimates.Methods
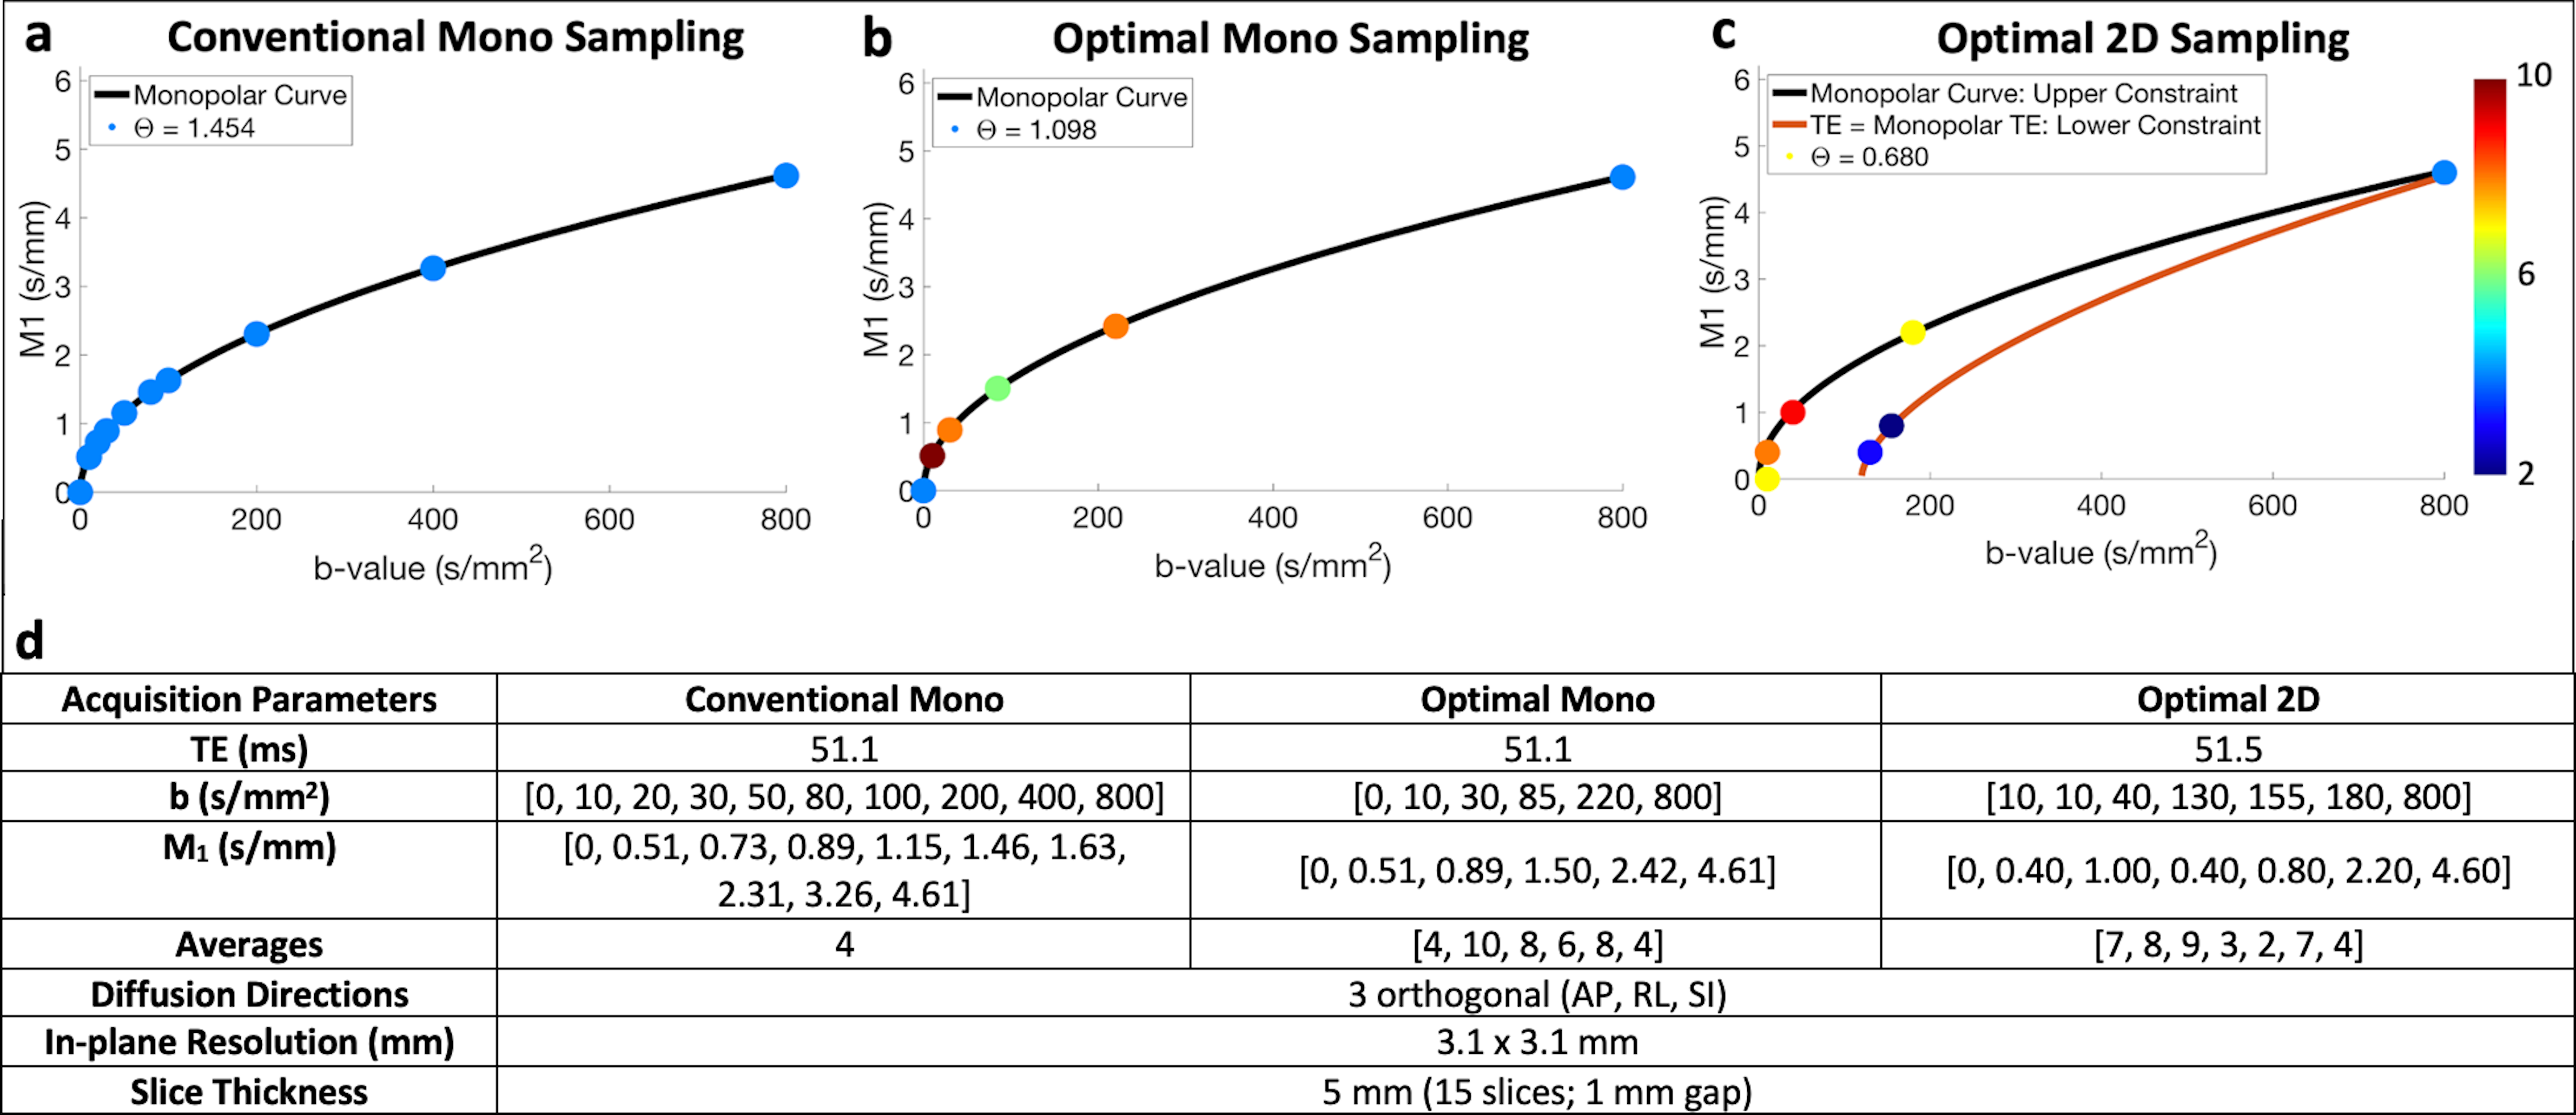
CRLB Optimization: Similar to a previously published procedure,7 Cramer-Rao lower bound (CRLB) optimization was performed to determine optimal monopolar and optimal 2D IVIM-DWI data samplings based on the generalized physical bi-exponential signal model proposed by Ahlgren et al.8$$S(b,M_1)=S_0[(1-F)e^{-bD}+Fe^{-bD_b}e^{-M_1^2V_b^2/2}]\qquad Eq. (1)$$
where D is diffusion coefficient, F is perfusion fraction, Vb is blood velocity standard deviation, and Db is the diffusivity of blood (1.75x10⁻³ mm2/s). The optimal samplings were determined for 40 total sampled data points and an SNR of 10.
MR acquisition: With IRB approval and informed consent, ten (n=10) volunteers underwent two MR exams using a test-retest approach (3T Signa Premier, GE Healthcare). Conventional monopolar, optimal monopolar, and optimal 2D IVIM samplings (Figure 1a-c) were acquired in the liver during each exam using respiratory triggering (detailed parameters in Figure 1d).
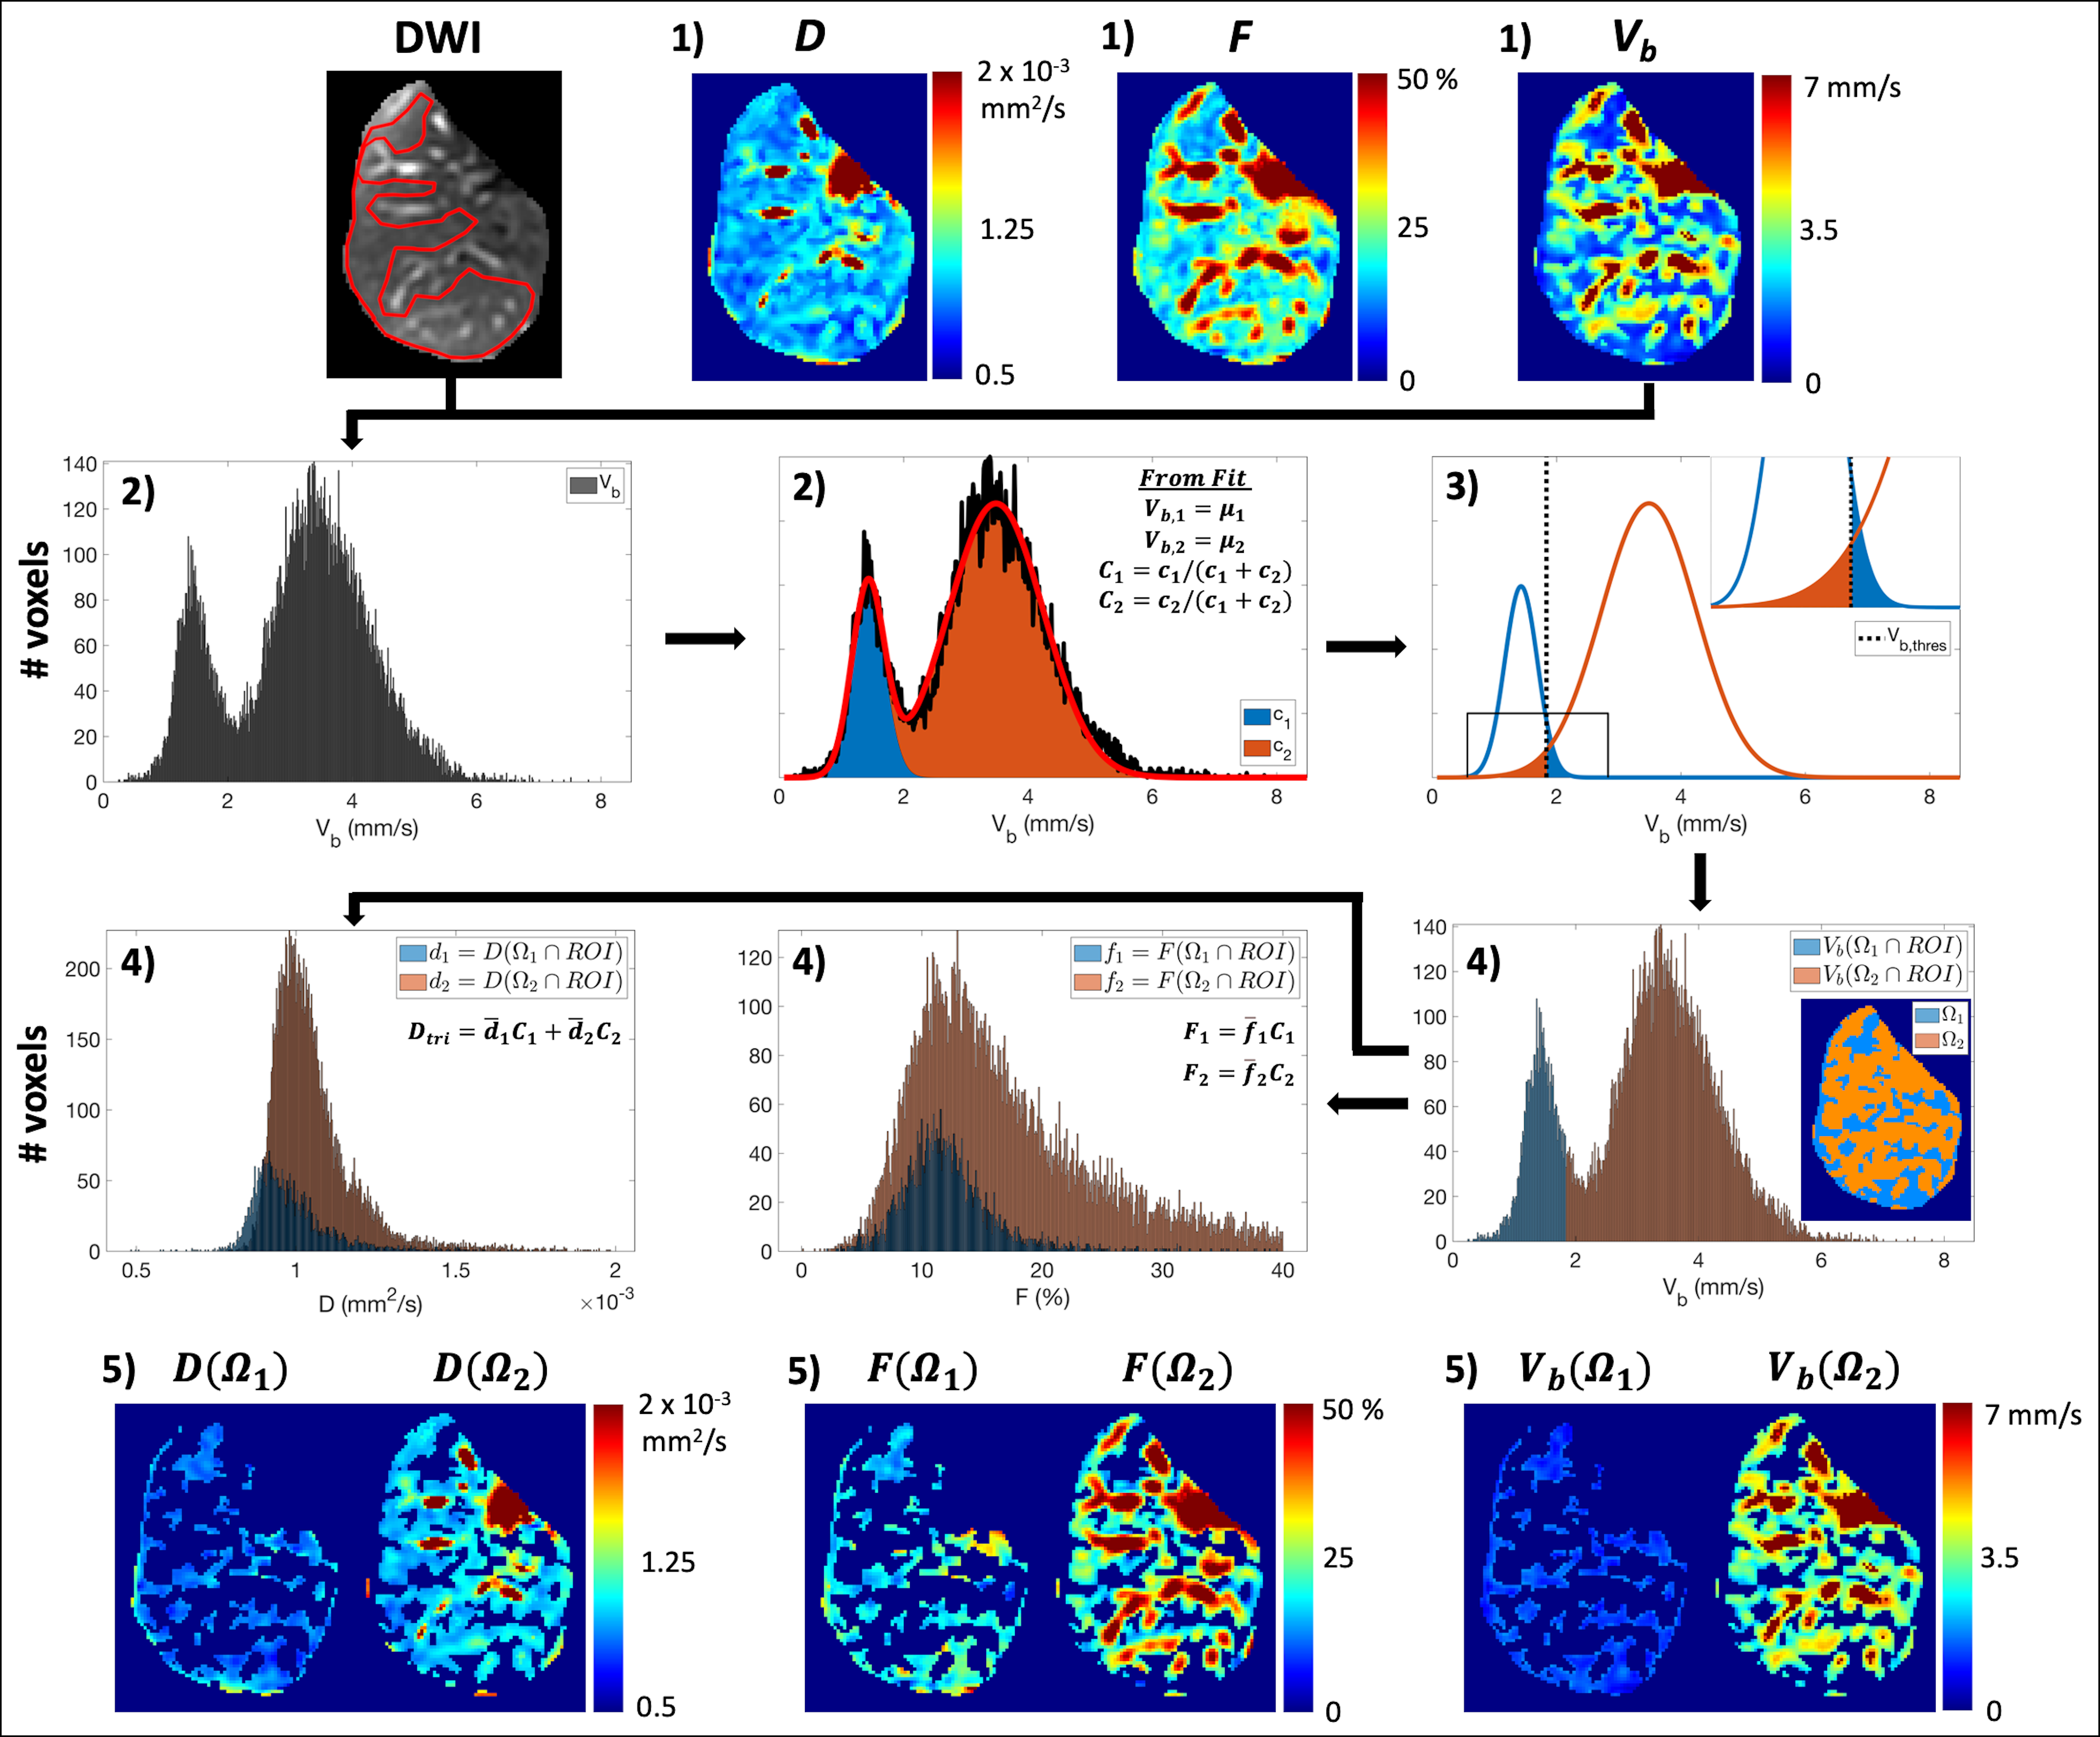
Data analysis: Tri-exponential IVIM estimates were obtained using ROI-based fitting and blood velocity standard deviation distribution fitting (BVD), as described next.
ROI-based fitting: The right liver lobe was manually segmented slice-by-slice, while avoiding major vessels, using b=0 images to obtain a 3D ROI. The signals from the voxels within this ROI were then averaged and fit to a newly proposed, physical tri-exponential model
$$S(b,M_1)=S_0[(1-F_1-F_2)e^{-bD_{tri}}+e^{-bD_b}(F_1e^{-M_1^2V_{b,1}^2/2}+F_2e^{-M_1^2V_{b,2}^2/2})]\qquad Eq. (2)$$
to obtain estimates of S0, Dtri, F1, F2, Vb,1, and Vb,2. Non-linear least squares fitting (Matlab, MathWorks) was used for all fits described in this work.
BVD fitting: The proposed BVD method is based on generalized bi-exponential mapping, followed by fitting of the Vb distribution measured within an ROI (modeled as a mixture of two Gaussians). This method is based on the observation that the Vb distribution appears bimodal in the liver, even in ROIs that avoid major blood vessels. First, voxelwise bi-exponential fitting of Eq. (1) was performed to obtain maps of S0, D, F, and Vb. Then the distribution of Vb values measured within the 3D ROI was fit to a double Gaussian to obtain estimates of the amplitudes, means (µ1 and µ2), and standard deviations of the two components, which can be used to determine the spatial concentration of each component (C1 and C2). Lastly, estimates of Dtri, F1, and F2 were calculated based on the spatial locations of each component. See Figure 2 for more details.
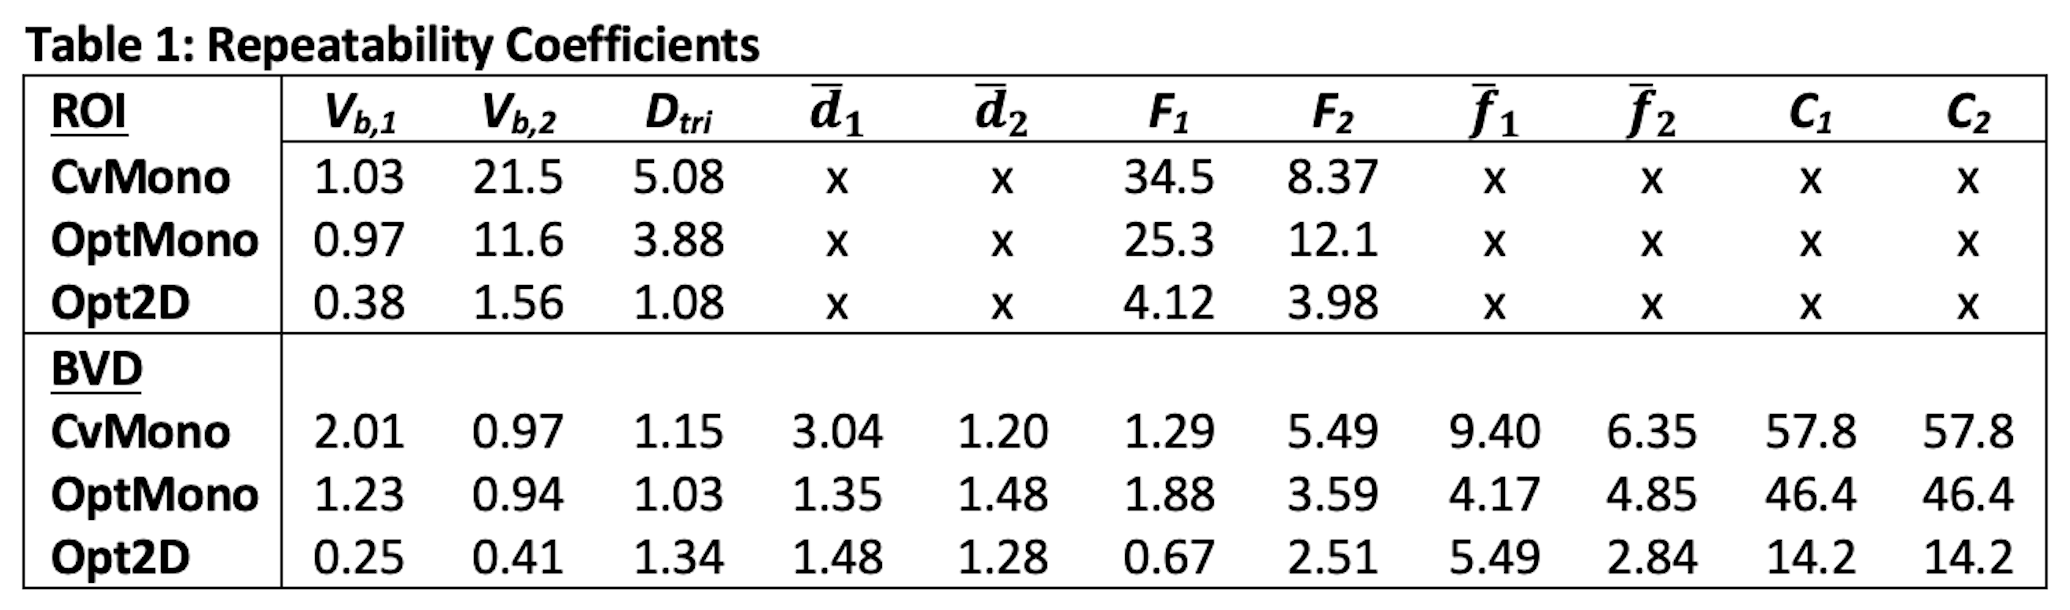
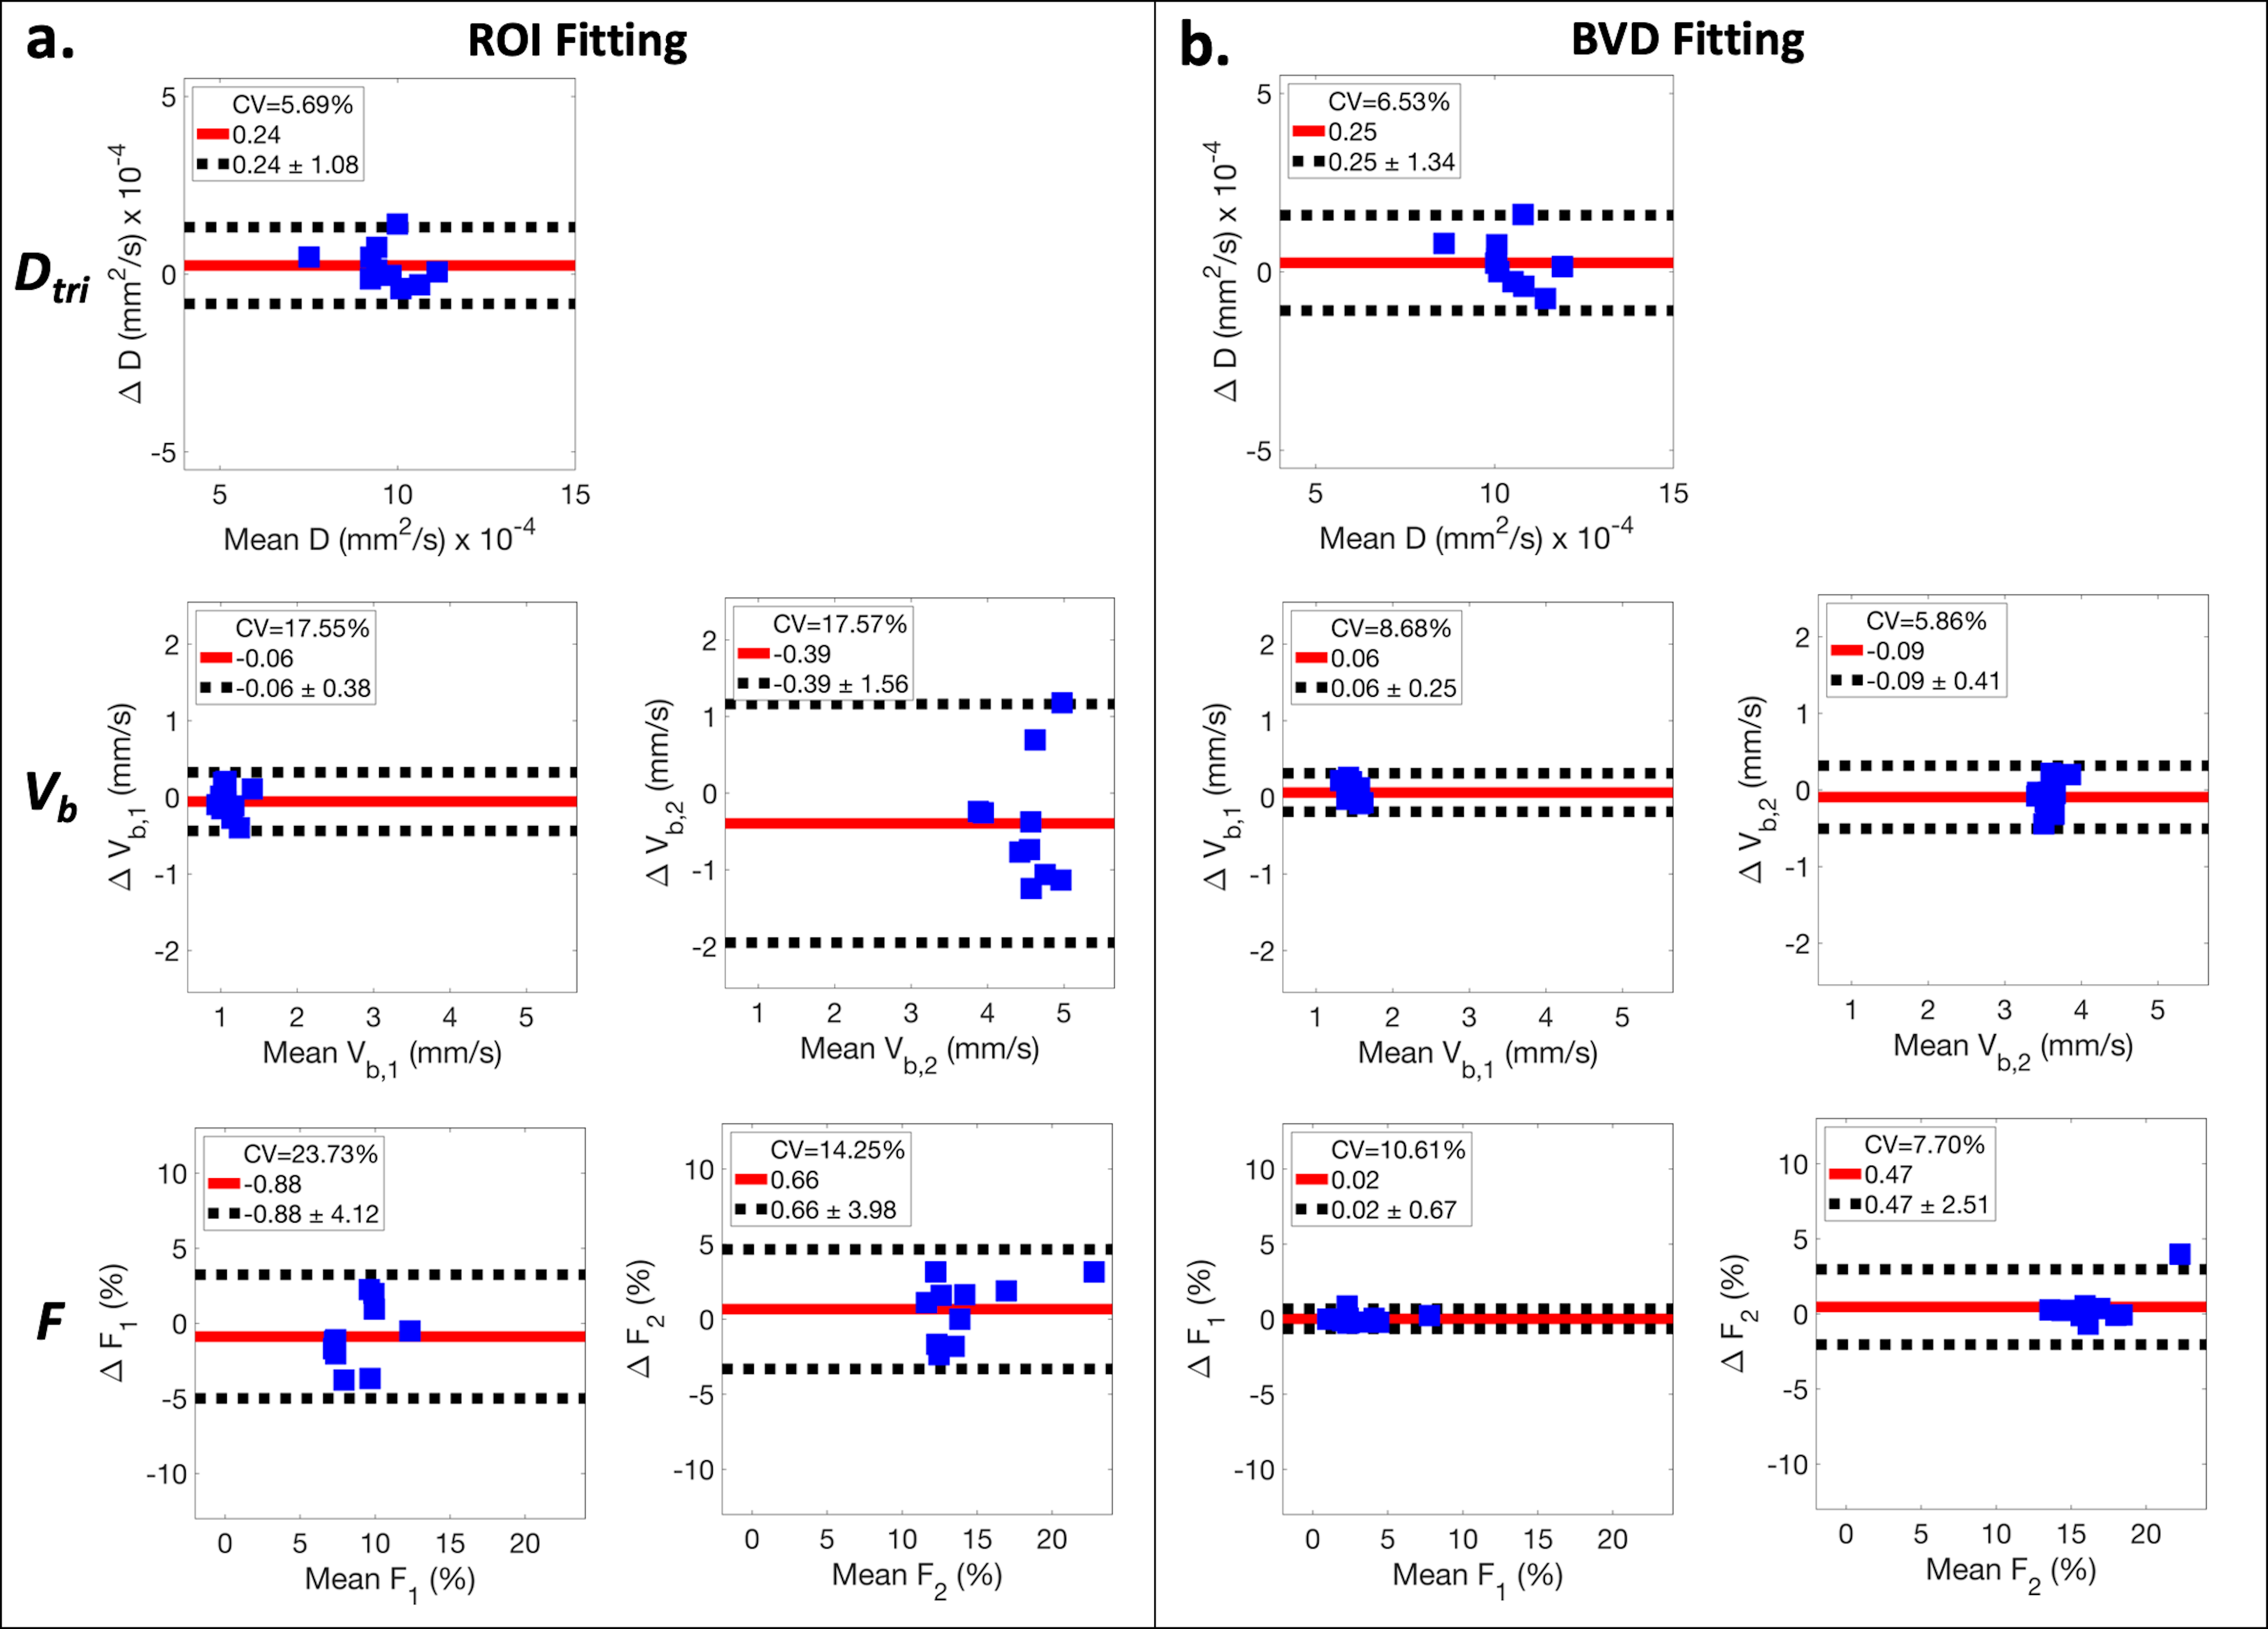
Evaluation of precision: The test-retest repeatability of each fitting method in conjunction with each acquired IVIM sampling was evaluated using Bland-Altman analysis to determine repeatability coefficients (RPCs). Paired sample t-tests were performed (significance level ⍺=0.05) to compare measurements from each method using 2D sampling.
Results
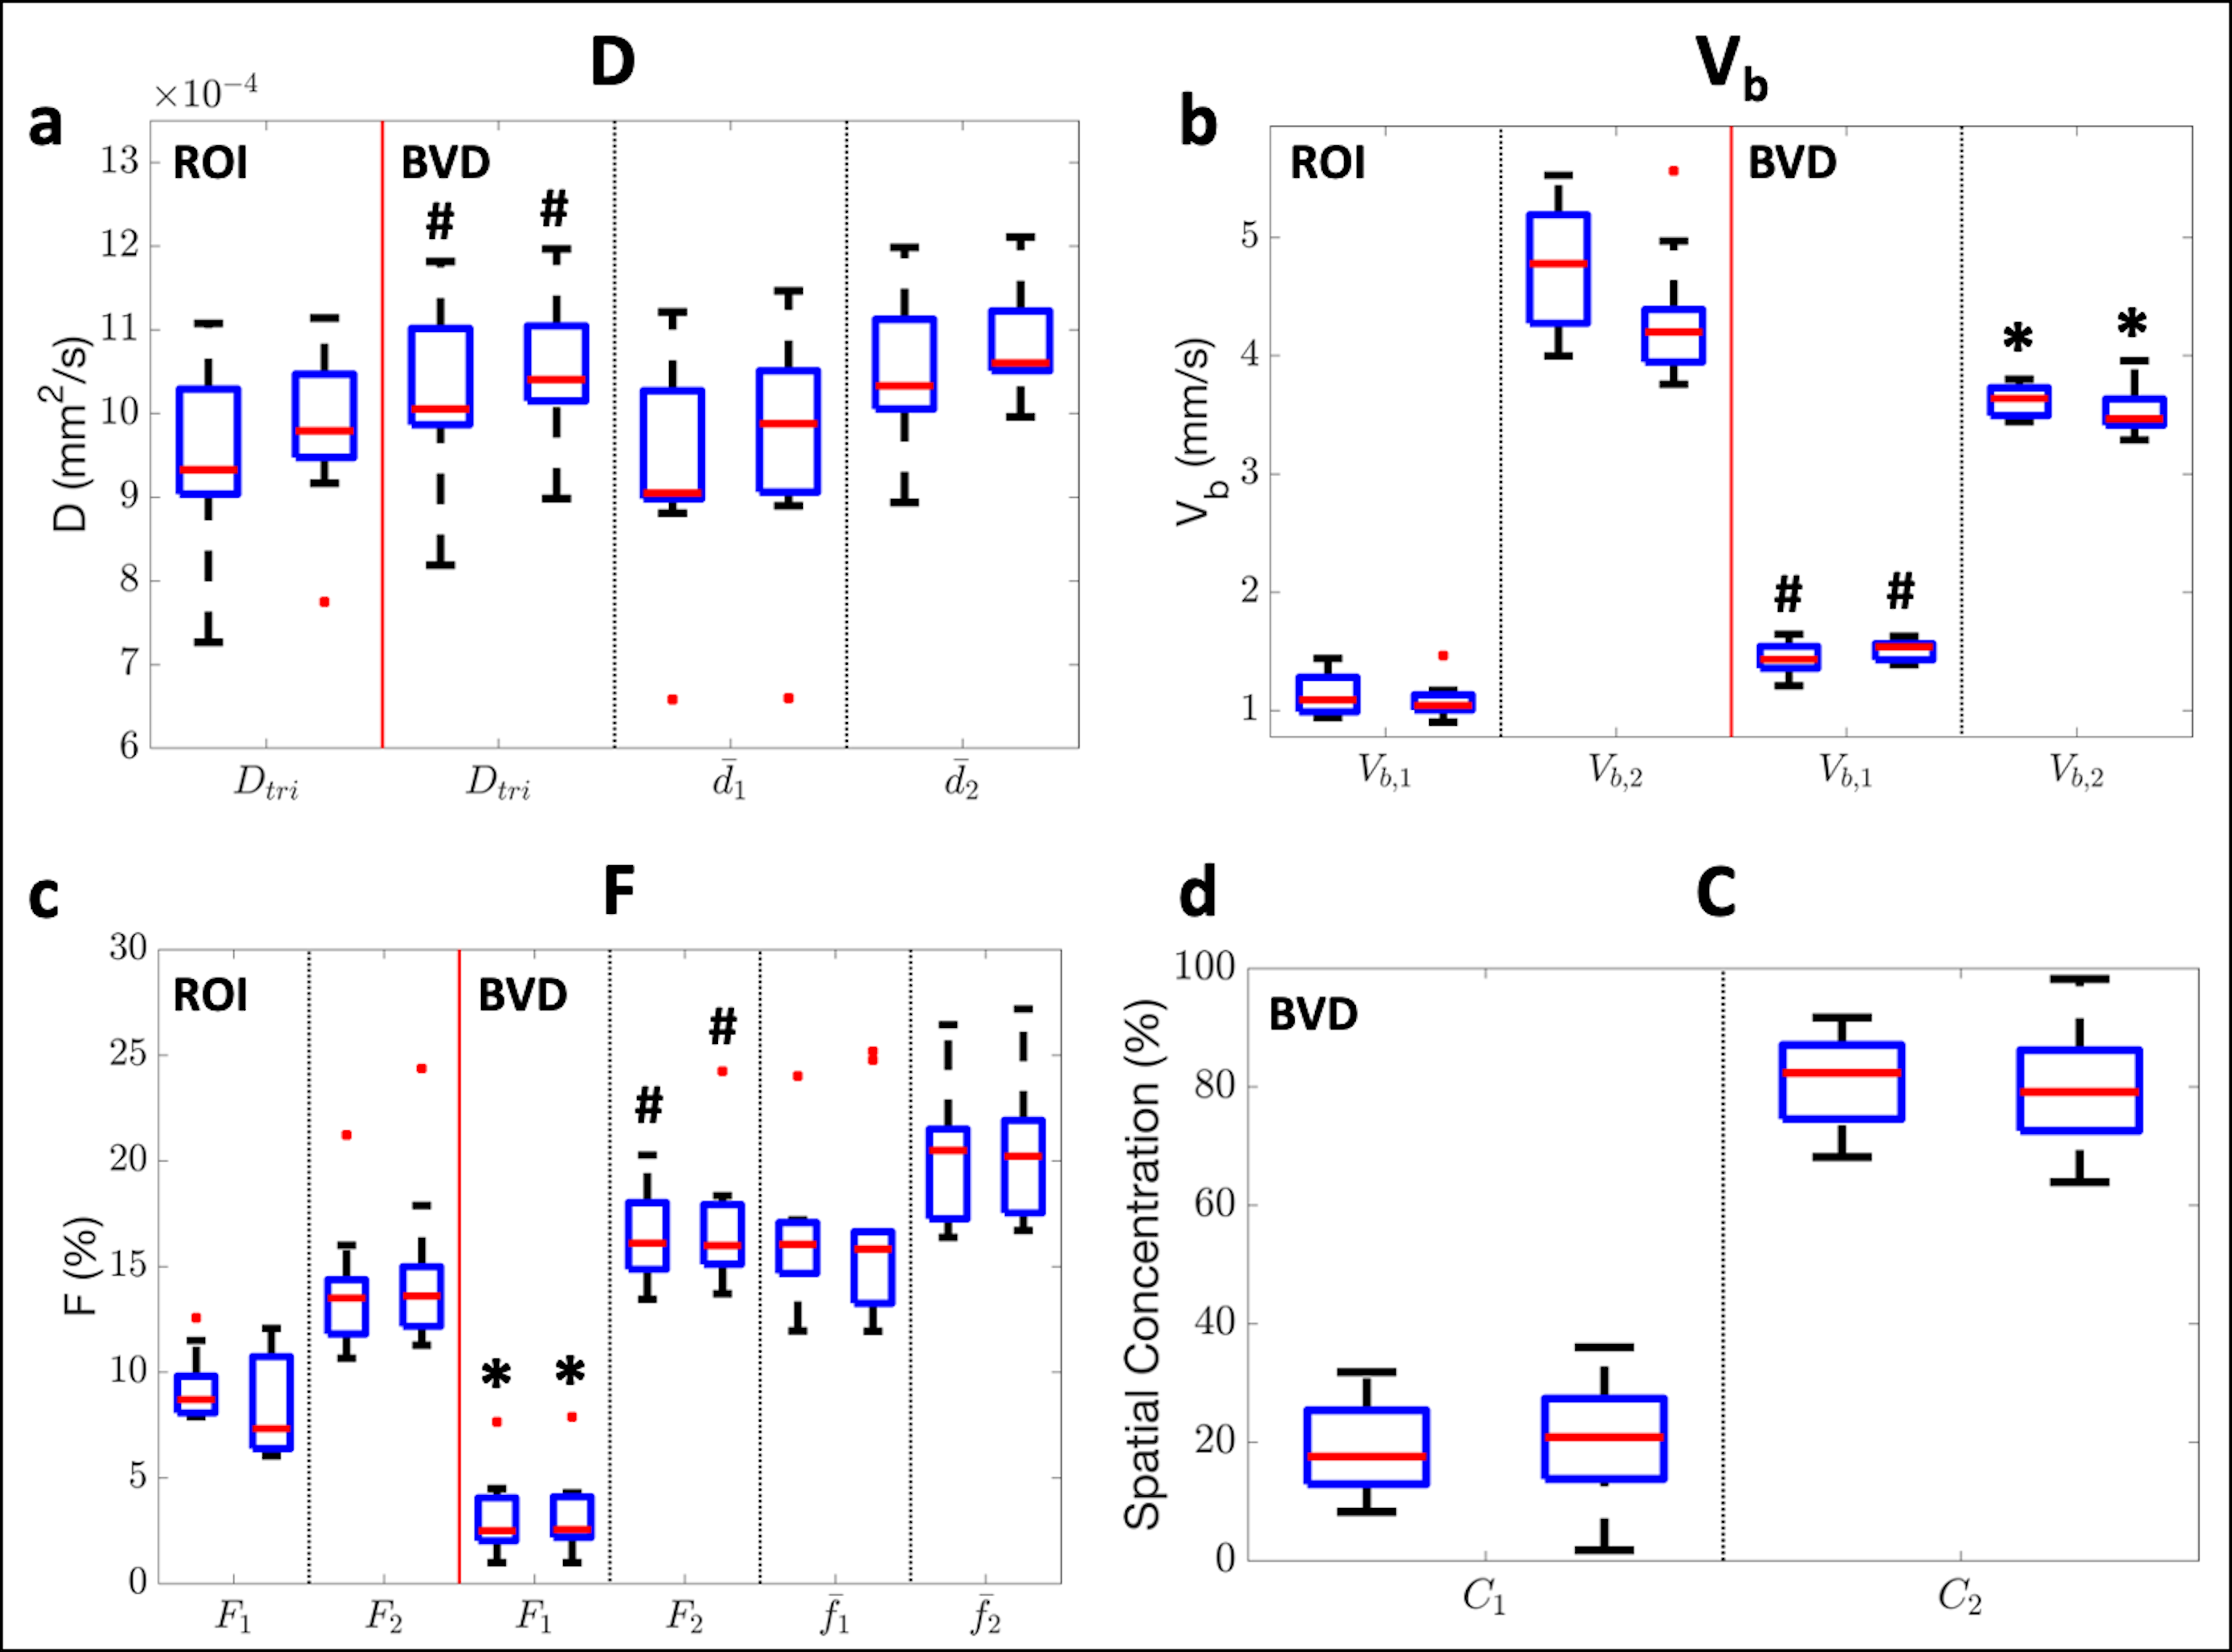
Tri-exponential IVIM estimates obtained using the 2D sampling were generally more repeatable (lower RPCs) than those obtained using the monopolar samplings (Table 1). Estimates obtained using BVD fitting were also more repeatable than estimates obtained using ROI-based fitting (Table 1 and Figure 3). Significantly larger values of Dtri, Vb,1, and F2 were measured using BVD fitting in comparison to ROI-based fitting (p<0.05; Figure 4a-c), while significantly smaller values were measured for Vb,2 and F1.Discussion and Conclusion
In this work, a new physical tri-exponential signal model is proposed containing two Vb components, instead of two pseudo-diffusion components.2-6 Additionally, repeatable tri-exponential estimates were obtained using 2D IVIM-DWI data sampling combined with BVD fitting.Different origins of the observed tri-exponential behavior of the IVIM signal in the liver have been hypothesized, including contributions from different flow velocities (either from the interstitial compartment or blood vessels of different sizes)9,10 and different contributions from arterial and venous blood.6 In this work, a bimodal spatial distribution of Vb was observed in ROIs excluding major vessels. This suggests that when using ROI-based fitting, the spatial distribution of flow velocities may be responsible for the observed tri-exponential behavior.
In the parameter maps, Vb(Ω2) tended to be close to and include major vessels, while Vb(Ω1) was generally in tissue further away from major vessels. The larger estimates of Vb,2 and C2 in comparison to Vb,1 and C1, as well as the spatial locations of Vb(Ω1) and Vb(Ω2), suggest that larger microvessels may be the primary contributors to the IVIM signal decay caused by perfusion.
Limitations of this work include the potential bias and error propagation of BVD fitting. Any bias occurring during the voxelwise bi-exponential and/or Vb distribution fittings (steps 1-2) will propagate throughout the rest of the analysis. Additionally, errors associated with the overlapping portions of the two Vb components (step 3) may also lead to bias in the estimations of Dtri, F1, and F2 (step 4).
In conclusion, 2D IVIM-DWI data sampling combined with BVD fitting can attain repeatable tri-exponential liver IVIM estimates.
Acknowledgements
The authors acknowledge support from the NIH (R01 EB030497), from the University of Wisconsin-Madison Office of the Vice Chancellor for Research and Graduate Education with funding from the Wisconsin Alumni Research Foundation, as well as from the UW Departments of Radiology and Medical Physics. Also, GE Healthcare provides research support to the University of Wisconsin-Madison.References
1. Le Bihan D, Breton E, Lallemand D, Aubin M, Vignaud J, Laval-Jeantet M. Separation of diffusion and perfusion in intravoxel incoherent motion MR imaging. Radiology. 1988;168(2):497-505.
2. Chevallier O, Wáng YXJ, Guillen K, Pellegrinelli J, Cercueil J-P, Loffroy R. Evidence of Tri-Exponential Decay for Liver Intravoxel Incoherent Motion MRI: A Review of Published Results and Limitations. Diagnostics. 2021;11(2):379.
3. Riexinger A, Martin J, Wetscherek A, et al. An optimized b‐value distribution for triexponential intravoxel incoherent motion (IVIM) in the liver. Magnetic Resonance in Medicine. 2021;85(4):2095-2108.
4. Kuai Z-X, Liu W-Y, Zhu Y-M. Effect of multiple perfusion components on pseudo-diffusion coefficient in intravoxel incoherent motion imaging. Physics in Medicine & Biology. 2017;62(21):8197.
5. Cercueil J-P, Petit J-M, Nougaret S, et al. Intravoxel incoherent motion diffusion-weighted imaging in the liver: comparison of mono-, bi-and tri-exponential modelling at 3.0-T. European radiology. 2015;25(6):1541-1550.
6. Wurnig MC, Germann M, Boss A. Is there evidence for more than two diffusion components in abdominal organs?–A magnetic resonance imaging study in healthy volunteers. NMR in Biomedicine. 2018;31(1):e3852.
7. Simchick G, Geng R, Zhang Y, Hernando D. b-M1-Optimized Waveforms for Improved Stability of Quantitative Intravoxel Incoherent Motion DWI. In Proceedings of the 29th Annual Meeting of ISMRM. 2021;Abstract 0402.
8. Ahlgren A, Knutsson L, Wirestam R, et al. Quantification of microcirculatory parameters by joint analysis of flow‐compensated and non‐flow‐compensated intravoxel incoherent motion (IVIM) data. NMR in Biomedicine. 2016;29(5):640-649.
9. Riexinger AJ, Martin J, Rauh S, et al. On the field strength dependence of Bi‐and Triexponential Intravoxel Incoherent Motion (IVIM) parameters in the liver. Journal of Magnetic Resonance Imaging. 2019;50(6):1883-1892.
10. Fournet G, Li J-R, Cerjanic AM, Sutton BP, Ciobanu L, Le Bihan D. A two-pool model to describe the IVIM cerebral perfusion. Journal of Cerebral Blood Flow & Metabolism. 2017;37(8):2987-3000.
Figures