1717
Evaluation of breast cancer using IVIM-Kurtosis and compartmental tracer kinetic models through semi-automated segmentation1MRI Department, Fundación Argentina para el Desarrollo en Salud, Mendoza, Argentina, 2MRI Department, Fundación Escuela de Medicina Nuclear, Mendoza, Argentina, 3Instituto Balseiro, Universidad Nacional de Cuyo, San Carlos de Bariloche, Argentina, 4Universidad de Mendoza, Mendoza, Argentina, 5GQNYCS, Comisión Nacional de Energía Atómica, CABA, Argentina, 6GE Healthcare, Santiago de Chile, Chile
Synopsis
This study aims to evaluate the correlation between the IVIM-DKI models (which describe pure and pseudo diffusion) and the quantitative and semiquantitative parameters from dynamic contrast-enhanced (DCE) MRI (that analyze vascular permeability and pharmacokinetics). A Python algorithm was implemented to adjust the intensities of 12 b-values DWI to a biexponential function modeling the IVIM and DKI. Then, the statistical association between these parameters and the DCE MRI was evaluated with a Pearson’s correlation coefficient. The f and D* factors are both good biomarkers for the evaluation of perfusion properties, according to the examined correlation between all the parameters.
Introduction
Advanced DWI models such as intravoxel incoherent motion (IVIM) and diffusion kurtosis imaging (DKI), allow the characterization of the tissue perfusion by the signal attenuation due to the microcirculation of blood in the capillary network and the non-Gaussian modelling of water molecules motion related with the movement of the molecules in the intra- and extra- cellular space.Through modifying the DWI bipolar gradients by the $$$b$$$-value parameter, a specific range of velocities can be codified, and thus, analyze different cellular and tisular effects. IVIM-DKI model follows a biexponential behavior, allowing the technique to describe pure diffusion ($$$D$$$), and pseudo-diffusion related to microcirculation ($$$D^*$$$), along with microvascular volume fraction ($$$f$$$).
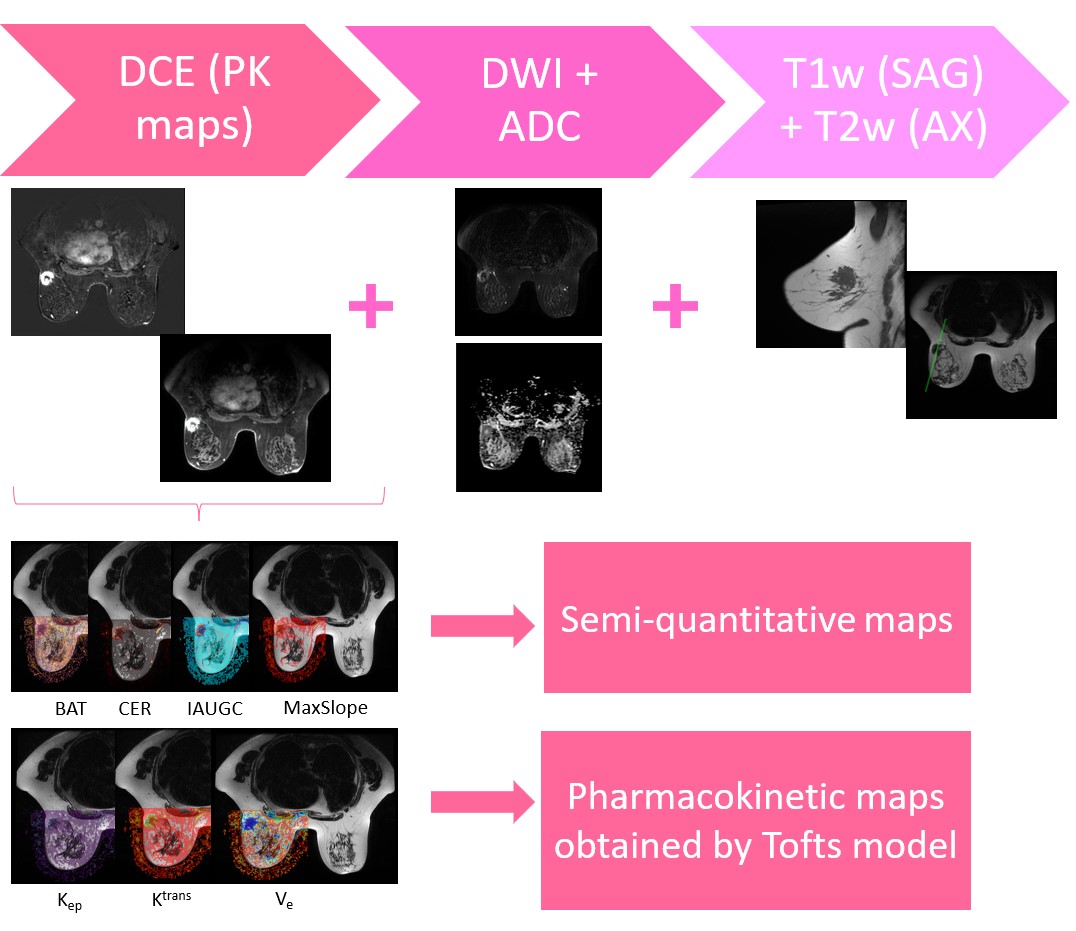
Dynamic contrast-enhanced (DCE) MRI assesses the vascular permeability, volume of extravascular-extracellular spaces (EES) and tissue perfusion applying mathematical models which allow to fit signal intensity-time curves to measure relevant biomarkers such as bolus arrival time (BAT), wash-in (MS), initial area under the time-to-signal intensity curve (IAUC) and maximum enhancement ratio (CER). The Tofts model is a conventional compartment algorithm which permits measuring the time course of contrast agent (Gd-DTPA) concentration in the tissue, obtaining microcirculatory pharmacokinetic parameters ($$$K_{\text{trans}},k_{\text{ev}}$$$ and $$$v_{\text{e}}$$$).
The aim of this study is to evaluate the correlation between IVIM-DKI model and the quantitative and semiquantitative parameters from DCE imaging.
Methods
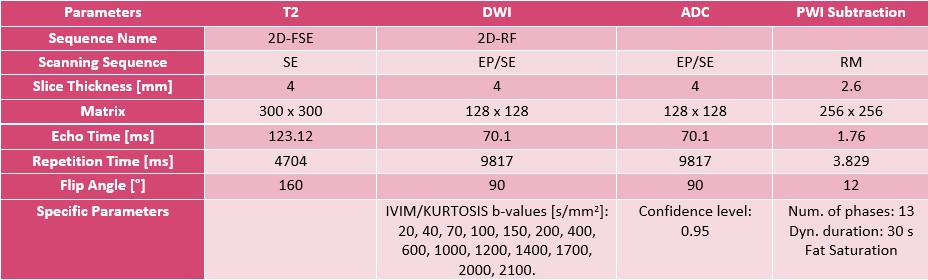
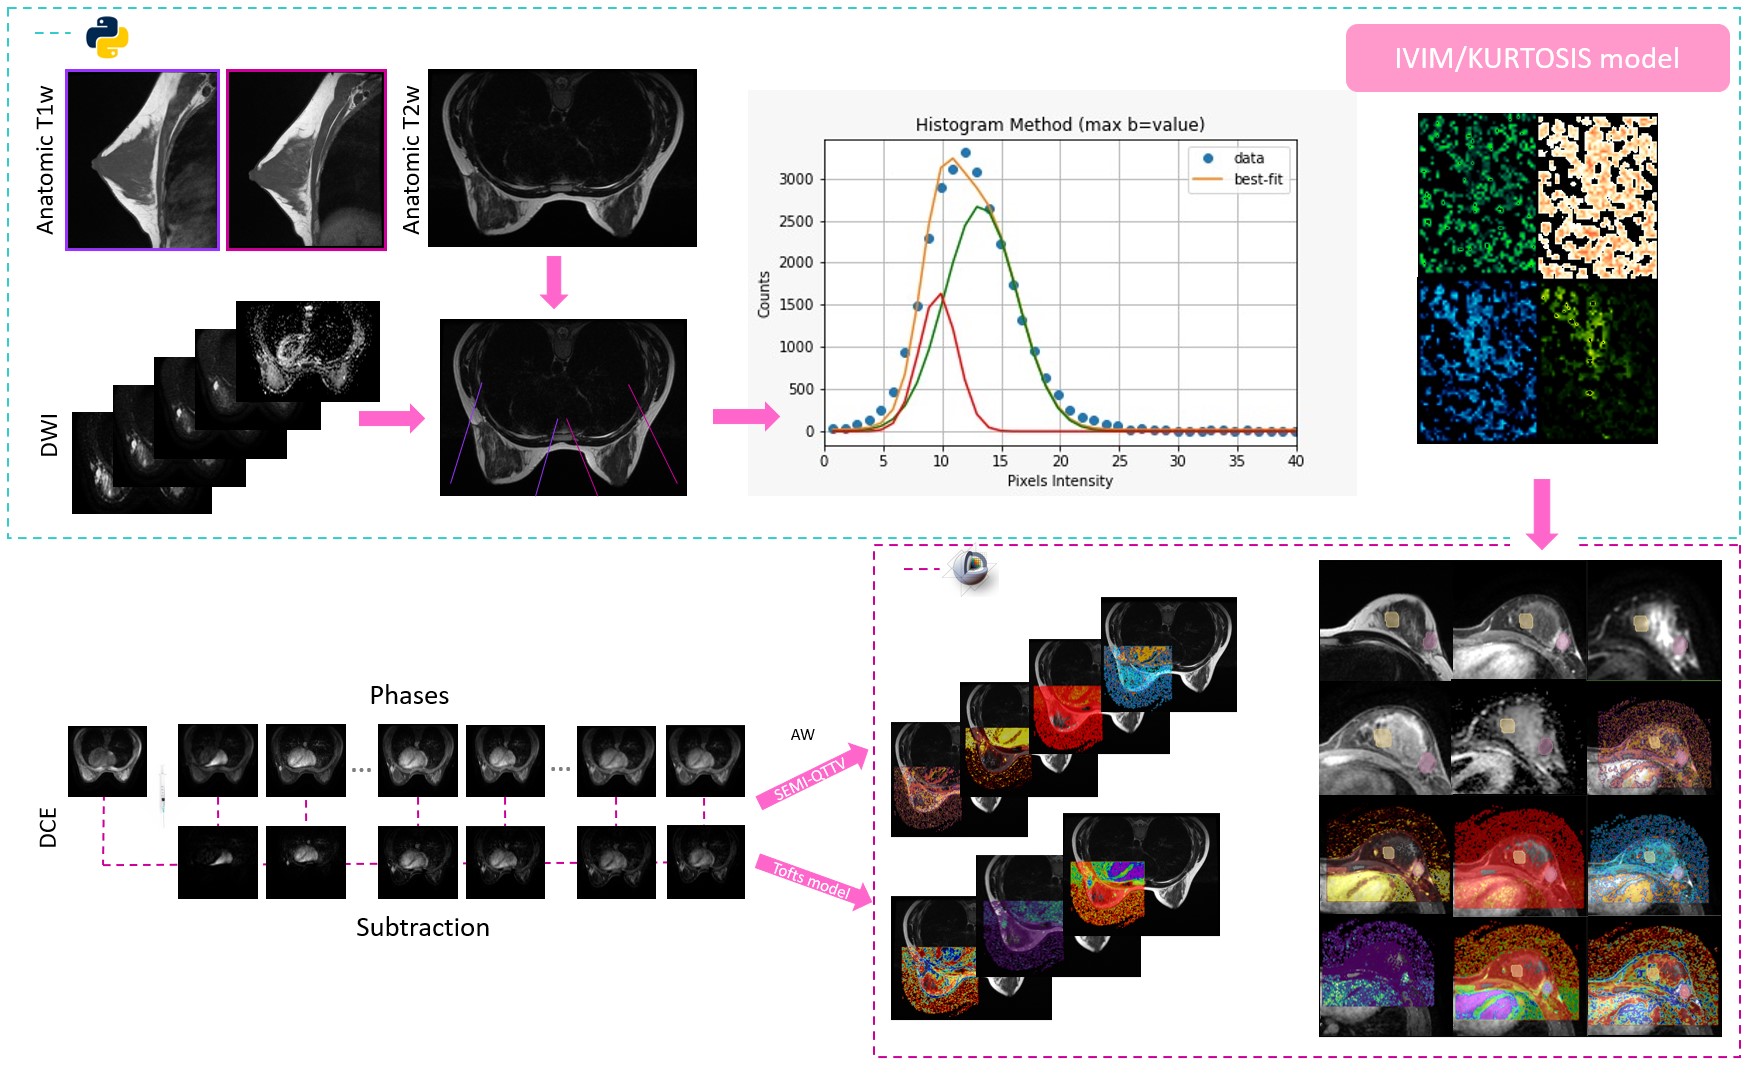
This is a prospective study approved by the Institutional Review Board. The study comprised a total of 12 female patients (mean age: 50±14 ys, range: 24 - 70 ys), 4 healthy controls (HC) and 8 with suspicion of breast pathology, all diagnosed following the BI-RADS guideline. Breast multiparametric examinations were performed with a 1.5 T Optima 450wGEM (General Electric), these studies included wT1 (bilateral sagittal), wT2, DWI and DCE sequences (Table 1). Sagittal images geometry and an histogram threshold were used to segment the area of analysis; in this region, the intensities of 12 b-values of the DWI were adjusted voxel by voxel to a biexponential function composed by the IVIM model $$$S_I(b)=S(b_0)f \text{e}^{-bD^*}$$$ plus an expression modeling the DKI parameter $$$S_K=S(b_0)\left(1-f\right) \text{e}^{-bD+b^2D^2{\frac{K}{6}}}$$$. Following Le Bihan 2019 [a], a correction factor (NCF) obtained from a phantom acquisition was added; thus, the fitting was made based on:$$M(b)=\left[\left(S_I(b)+S_K(b)\right)^2+\text{NCF}\right]^{\frac{1}{2}}$$.
A Python algorithm (LMFIT, SimpleITK) was performed to obtain $$$f$$$, $$$D^*$$$, $$$D$$$ and $$$S(b_0)$$$.
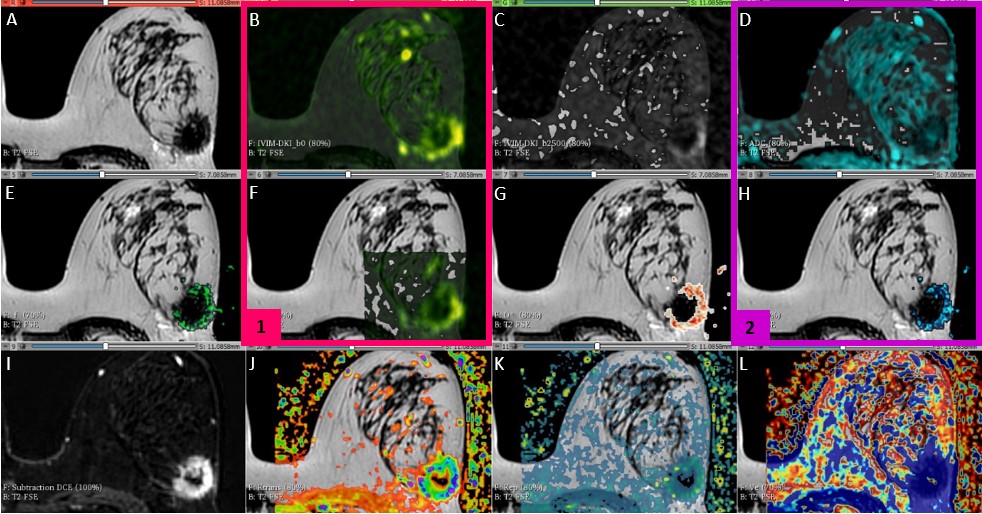
Regarding the pharmacokinetic parameters, both the quantitative and semi-quantitative values were generated at the VolumeShare 5 workstation (GE). The arterial input function (Toft model) was calculated by a semi-automatic method applied on the subclavian and external mammary artery. Two expert mastologists traced manual ROIs on healthy and pathological tissue, considering a 95% confidence level (Figure 1). An open-source software (3D-Slicer V4.11) was implemented for a landmark registration of the maps using wT2 as a fixed volume and all ROIs were traced and propagated for each study through the segmentation module. Figure 1 summarizes this workflow. Variables with a fitting error higher than 100% in the Levenberg-Marquardt method were not taken into account. A t-test was applied considering a $$$p<0.05$$$ as significantly different and a Pearson’s correlation coefficient was used to measure the statistical association between the parameters. The visual comparison between the $$$b_0$$$-value image intensities and $$$S(b_0)$$$ fit was implemented as a quality control.
Results
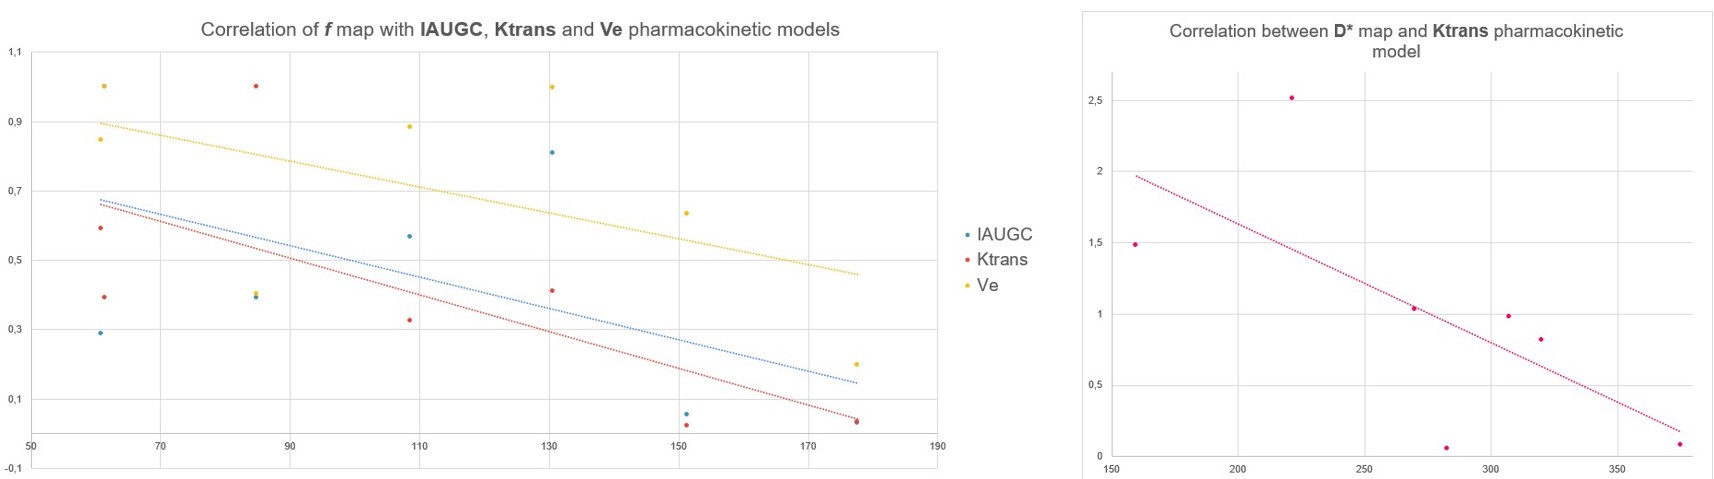
The fitting of the $$$S(b_0)$$$ coefficient had a visual correlation with the signal intensity of the DWI with b=0. In the ROIs with carcinoma, the D factor was correlated with the ADC from the monoexponential model of DWI (Figure 3). Regarding the NCF, a value of 13±2 was calculated and applied to the model. For high b-values (>1200 s/mm2), 82% of the studies of patients with carcinoma showed noise, damaging the fitting process for the kurtosis parameter; therefore, this parameter was not taken into account. For the ROIs traced in HT, more than 90% of the cases presented low SNR for b-values higher than 650 s/mm2. The Pearson's correlation test did not show correlation between D and pharmacokinetic parameters (r < 0.39). On the other hand, in pathologic tissue, f had correlation with Ktrans (r = 0.71), IAUGC (r = 0.55) and Ve (r = 0.54). Moreover, D* was correlated with Ktrans (r = 0.69) (Figure 4).Conclusions and discussion
In the future, we intend to find mechanisms to increase the SNR, especially at high b-values, to improve the fitting in HT and to start studying the K coefficient. The correlation found between f and IAUGC supports the findings of Le Bihan et. al1, who suggest that f is related to cerebral blood flow (CBF).Based on the analyzed correlation between parameters, it is concluded that f and D* factors are both good indicators for the evaluation of perfusion characteristics.
Acknowledgements
This project is part of a research agreement with General Electric Healthcare (GE). We wish to extend our special thanks to Thomas Doring and Eduardo Figueiredo from the GE Research Team.References
1. D. L. Bihan y R. Turner, «The capillary network: a link between ivim and classical perfusion», Magn. Reson. Med., vol. 27, n.o 1, pp. 171-178, sep. 1992.
2. M. Iima et al., «Quantitative Non-Gaussian Diffusion and Intravoxel Incoherent Motion Magnetic Resonance Imaging: Differentiation of Malignant and Benign Breast Lesions», Investigative Radiology, vol. 50, n.o 4, pp. 205-211, abr. 2015
3. D. Wu, G. Li, J. Zhang, S. Chang, J. Hu, y Y. Dai, «Characterization of Breast Tumors Using Diffusion Kurtosis Imaging (DKI)», PLoS ONE, vol. 9, n.o 11, p. e113240, nov. 2014
4. Z. Li et al., «The Diagnostic Performance of Diffusion Kurtosis Imaging in the Characterization of Breast Tumors: A Meta-Analysis», Front. Oncol., vol. 10, p. 575272, oct. 2020
Figures