1716
Susceptibility weighted imaging using Stack of Spiral trajectories1Department of Radiology, Mayo Clinic, Rochester, MN, United States
Synopsis
A new strategy to acquire Susceptibility Weighted Imaging was proposed with Stack of Spiral trajectories to reduce scan time while maintaining adequate SNR. Spiral encoding offers acceleration in scan speed by six times compared to conventional Cartesian methods, with similar SNR, resolution, and image quality. Due to its improved SNR efficiency, the proposed method has the potential to facilitate lesion detection with higher resolution SWI in a reasonable scan time.
Introductions
Susceptibility weighed imaging (SWI) provides contrast enhancement among the brain tissue especially the cerebral parenchyma, the vein, and the deep brain nuclei for lesion detection1-3. The contrast mechanism relies on the susceptibility induced phase accumulation over a long echo time4. A conventional SWI protocol usually adopts a 3D multi-echo gradient echo sequence, with the last TE occurring at 50 ms or more. A typical scan time of conventional SWI of 5 minutes is needed to encompass the whole brain for adequate contrast and resolution.Spiral imaging features good SNR efficiency5 and is less prone to motion artifacts, although it does exhibit blurring from chemical shift and B0 offsets. Several techniques have been developed over the past few years to mitigate this blurring and improve the image quality of spiral imaging, making it become a more robust method for routine imaging6,7. Unlike conventional Cartesian scanning using a shorter window to acquire data, spiral imaging has the ability to traverse more of k-space over a much longer spatial-encoding readout period, leading to better termporal and SNR efficiency. This is a natural fit with sequences such as SWI that require a long TE, shortening scan time without sacrificing SNR. The present work developed a strategy to take advantage of the spiral trajectories efficiencies to cover a larger extent of k-space for each excitation during the space before the required long echo time.
Materials and methods
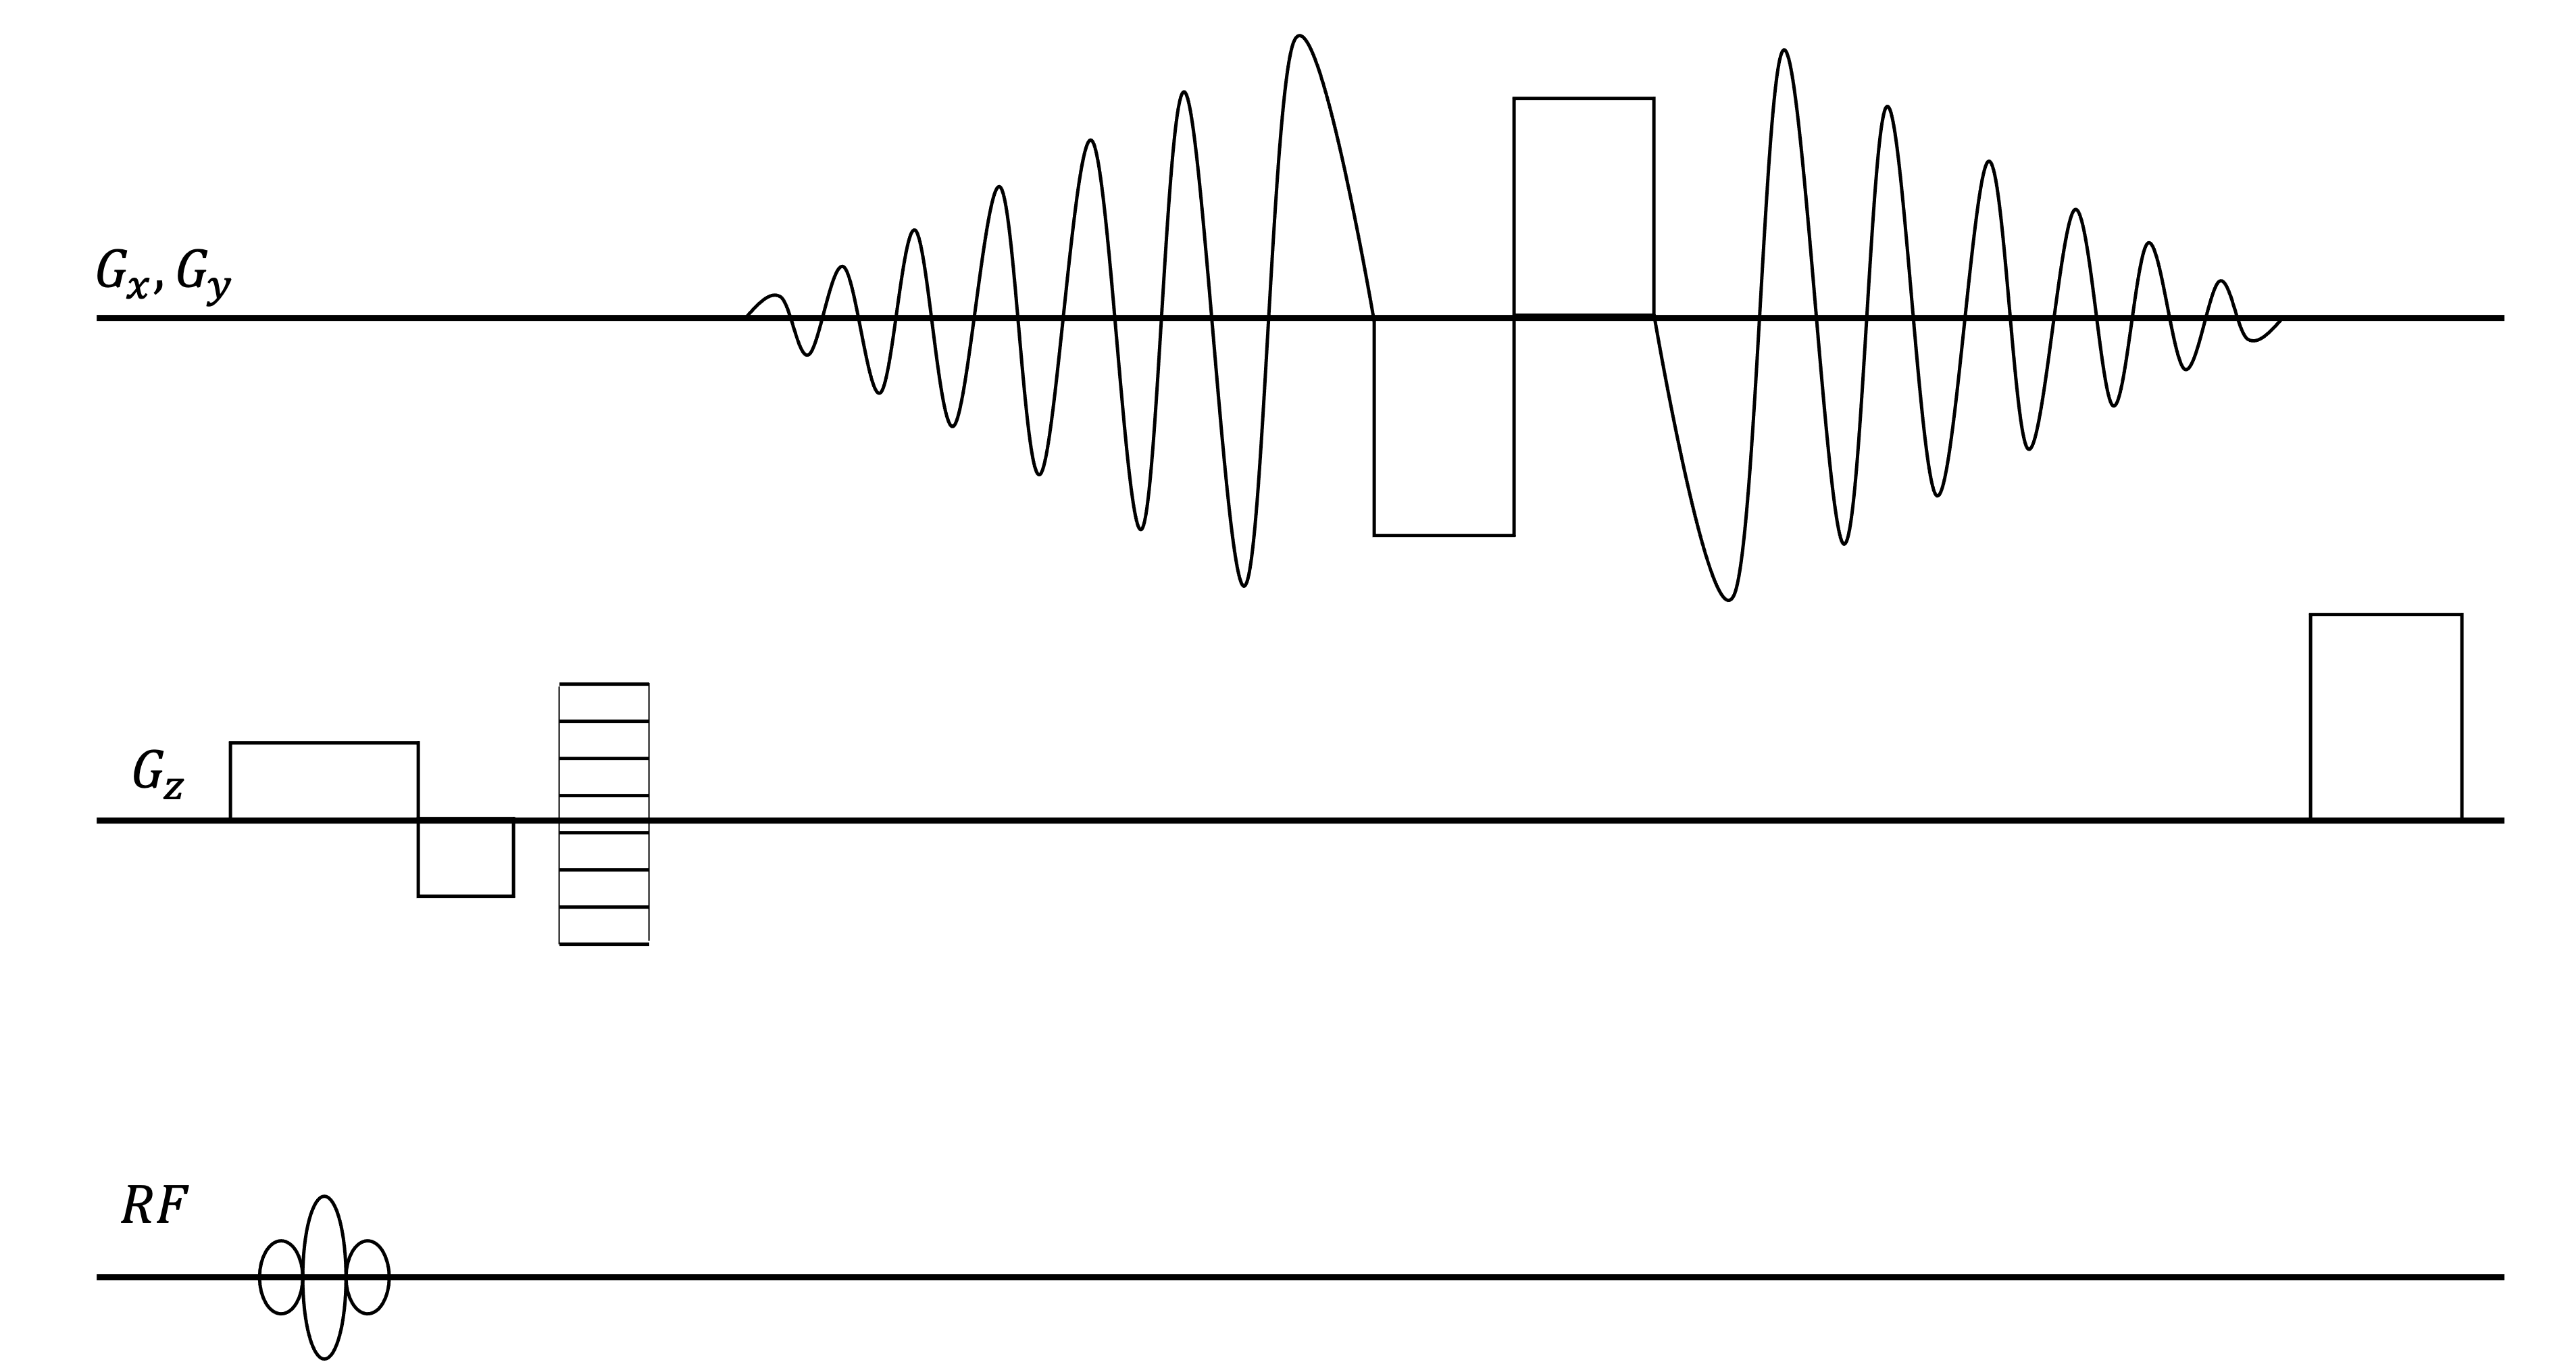
The Stack of Spiral (SOS) sequence illustrated in Fig 1 was utilized to perform the SWI scan. The designed Spiral Out-In trajectory initiates a Spiral-Out acquisition after excitation for a short-echo image with high SNR. Next, Spiral-In gradients following a pair of bipolar gradients are performed for a long-TE image. The amount of the phase accumulation for the SWI is proportional to the entire period of the Spiral Out-In wave form. The bipolar gradient between the echoes nulls the first gradient moment for the Spiral-In data to mitigate phase dispersion from blood flow and general motion effects.Three volunteers were recruited for the scans performed on a 3.0T scanner (Ingenia Elition X, Koninklijke Philips, Best, Netherlands) with IRB approved protocol after informed consent. Three different 3D Spoiled Gradient sequences, one Cartesian trajectory and two SOS, were compared with identical geometric prescription: spatial resolution of to cover a FOV. Other scan parameters are listed in Table 1.
Each dataset was 2X oversampled during the readout. The even and the odd samples were reconstructed separately to produce two images for the subsequent SNR evaluation8. The fourth set of SWI images were reconstructed from one of the NEX=2 water-selected SOS data in order to illustrate the image quality of the fastest SWI result the scanner could offer.
The reconstruction were performed offline following a conventional SWI procedure4 in Python 3.6. The magnitude images at different echo times were fitted to a T2* decay model to obtain the signal at TE=0 serving as the SWI overlay. The phase mask was then generated by the following procedure. The phase of the first echo was subtracted from that of the last echo to remove the offset irrelevant to the susceptibility induced field change. Subsequently, a Gaussian filter (width = 20% of the k-space coverage) was applied to mask the complex data after phase subtraction to retrieve the high frequency components. The negative phase was then selected for enhancing the contrast and the phase mask was multiplied four times on the overlaid template. The final exhibited SWI images were generated by the minimum intensity projection over 1.0-cm thickness, equivalent to 5 slices of the scan data.
Results
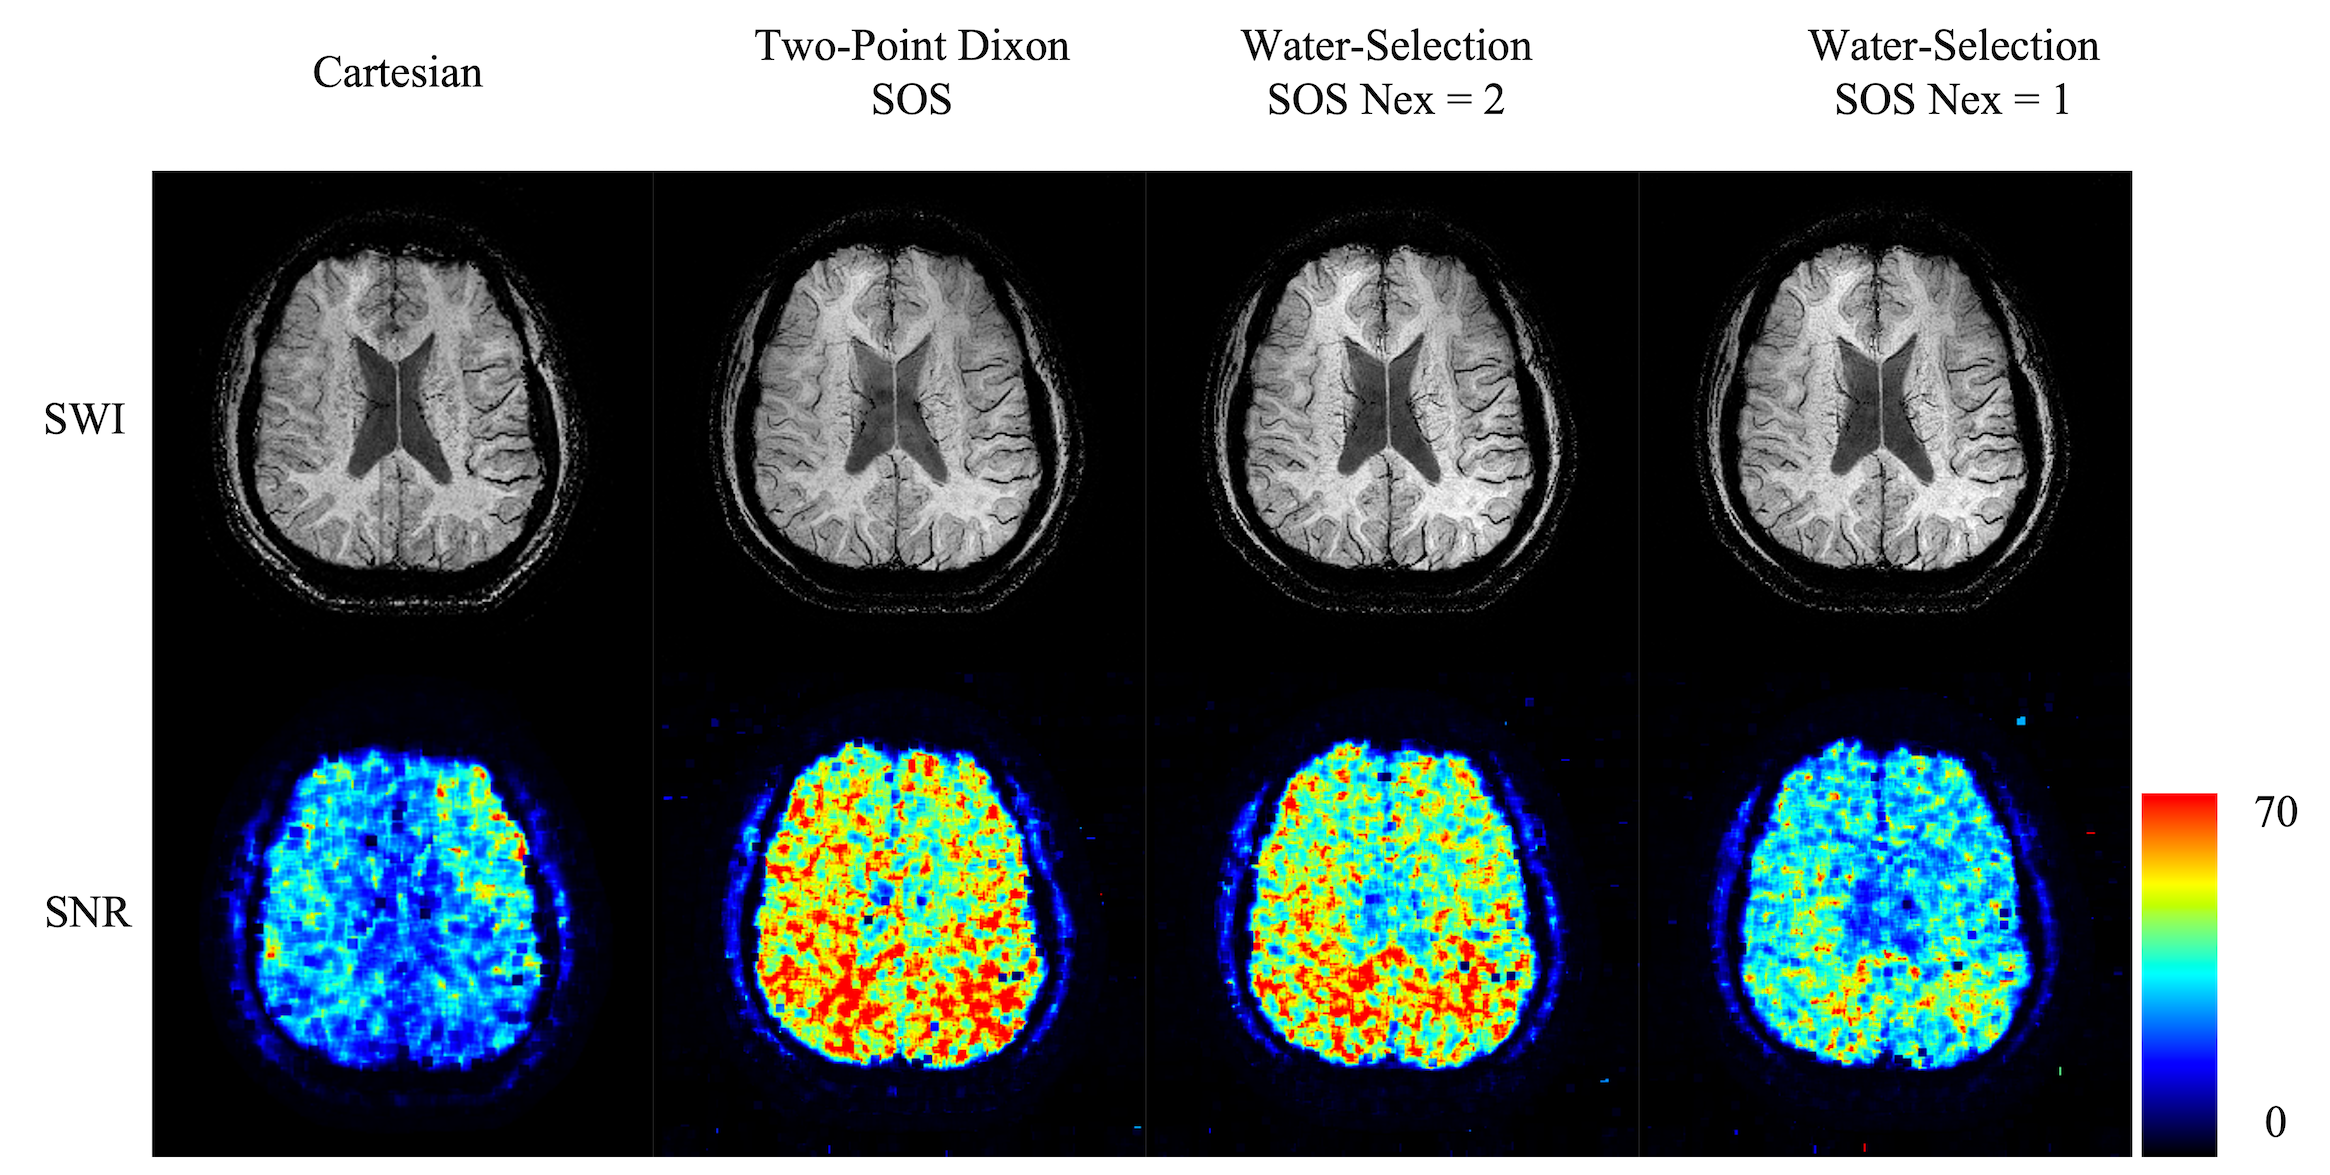
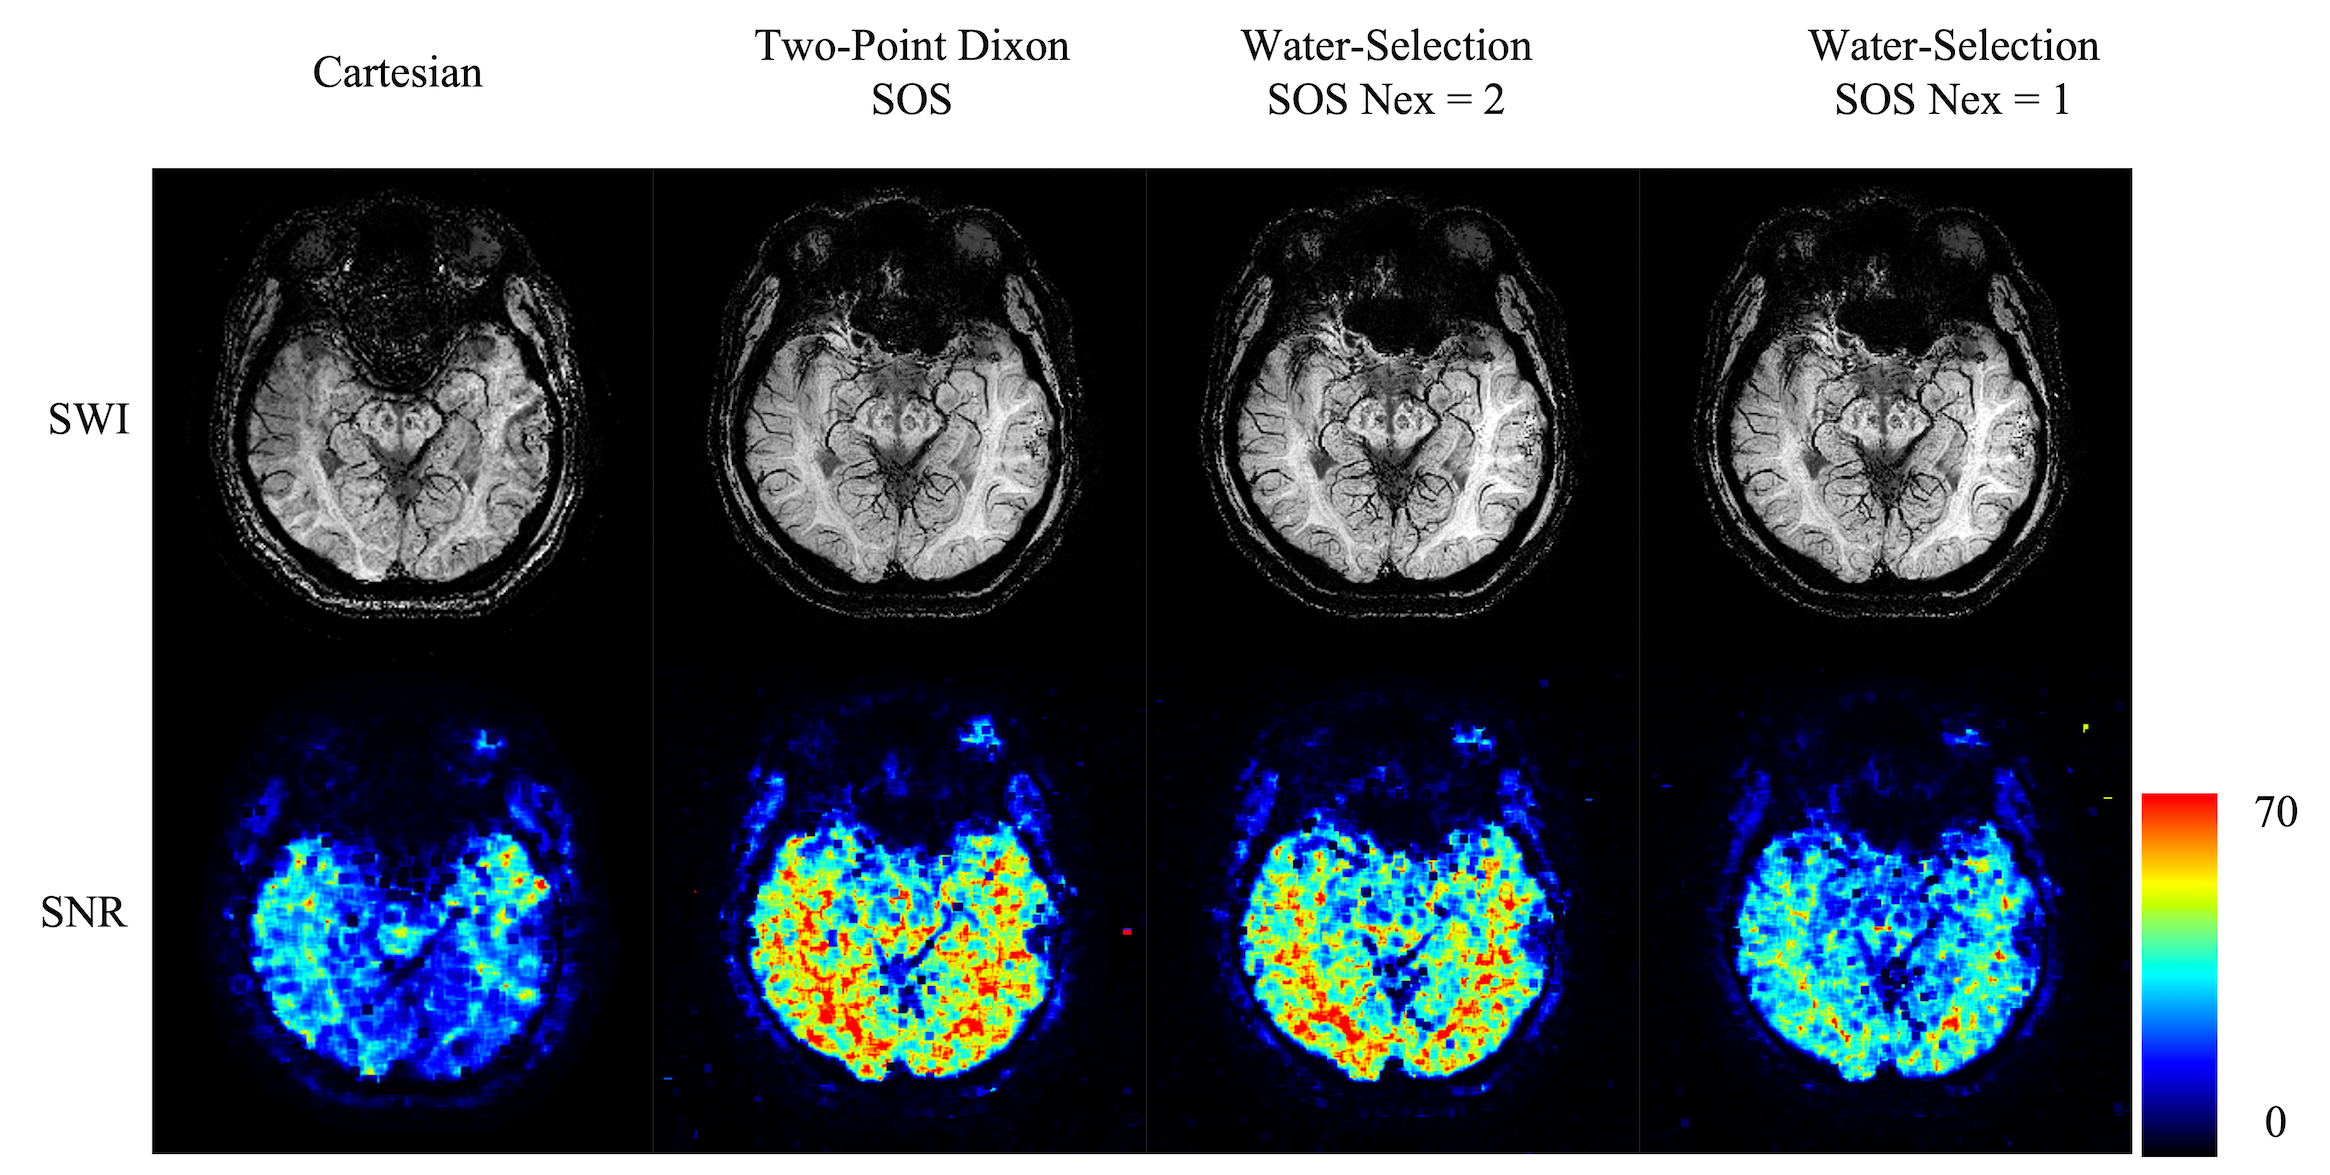
Figs 2 and 3 demonstrate the SWI reconstructions and their corresponding SNR measurements at two different locations. The overall contrast and the presence of the anatomy are similar among the images from different scans except for subtle differences. The vessels around the right ventricle (Fig. 2) and in the occipital lobe (Fig. 3) are better delineated in the SOS sequence. In spite of shorter scan time, SOS sequences demonstrate similar contrast and geometry of the midbrain nuclei as shown in Fig. 3. The SNR of the Cartesian scan is around 30 while the faster Two-Point Dixon SOS SNR is closer to 60. The water selected SWI can also achieve comparable SNR with the two-point Dixon scan under similar scan time. The high SNR efficiency of the SOS sequence allows a shorter water-selective approach, using a single average, to achieve a 76-sec scan with slightly better SNR than the ~8 minute Cartesian scan.Discussion
The long scan time of SWI has detracted from its application in clinical MRI. Spiral sampling trajectories for SWI address this challenge due to their high SNR and temporal efficiency. Results from this work show that Spiral imaging could take less than two minutes to achieve similar SNR to current conventional Cartesian SWI. Likewise, it adds the potential to achieve the higher spatial resolution for SWI and to reduce scan time for the Quantitative Susceptibility Mapping (QSM), which requires better resolution.Conclusion
This work presents a new SWI strategy imaged by a Spiral Out-In trajectory to offer a faster scan and better SNR efficiency.Acknowledgements
This study was supported in part by Koninklijke Philips.References
1. Cosottini, M., et al., Comparison of 3T and 7T susceptibility-weighted angiography of the substantia nigra in diagnosing Parkinson disease. AJNR Am J Neuroradiol, 2015. 36(3): p. 461-6.
2. Ng Kee Kwong, K.C., et al., Rim lesions are demonstrated in early relapsing-remitting multiple sclerosis using 3 T-based susceptibility-weighted imaging in a multi-institutional setting. Neuroradiology, 2021.
3. Chen, Y., et al., An interleaved sequence for simultaneous magnetic resonance angiography (MRA), susceptibility weighted imaging (SWI) and quantitative susceptibility mapping (QSM). Magn Reson Imaging, 2018. 47: p. 1-6.
4. Haacke, E.M., Susceptibility weighted imaging (SWI). Z Med Phys, 2006. 16(4): p. 237.
5. Pipe, J.G., High-Value MRI. J Magn Reson Imaging, 2019. 49(7): p. e12-e13.
6. Robison, R.K., et al., Correction of B0 eddy current effects in spiral MRI. Magn Reson Med, 2019. 81(4): p. 2501-2513.
7. Wang, D., N.R. Zwart, and J.G. Pipe, Joint water-fat separation and deblurring for spiral imaging. Magn Reson Med, 2018. 79(6): p. 3218-3228.
8. National Electrical Manufacturers Association, Determination of Signal-to-Noise Ratio (SNR) in Diagnostic Magnetic Resonance Imaging, in NEMA Standards Publications MS 1-2008 2021,
Figures