1711
Optimal Control of the contrast in a MP-RAGE sequence: an application on the pelvis1CREATIS, Lyon, France, 2Siemens Healthcare SAS, Saint-Denis, France, 3CPE, Lyon, France, 4Centre Léon Bérard, Lyon, France
Synopsis
MRI contrast enhancement by Optimal Control is a new approach to design optimal magnetization preparation. This allows to maximize the contrast between target tissues characterized by their relaxation times. Recent numerical implementations have made possible the optimization of such preparation in a steady state sequence without full recovery between each repetition. This abstract demonstrates the contrast flexibility offered by this approach when combined with a MPRAGE sequence on pelvis imaging at 3T.
Introduction
MPRAGE1 is a 3D sequence composed of : a magnetization preparation for contrast control; acquisition of multiple k-space lines with a short time of repetition (TR) and low flip angle spoiled gradient echo scheme; and a partial recovery step. This rapid and high spatial resolution sequence allows T1-weighted brain images thanks to an inversion recovery preparation 2,3,4. For other clinical applications (such as for cancer imaging), other weightings could be developed. However, contrasts achievable with a preparation using both T1 and T2 relaxation times are hard to predict due to the formation of an equilibrium state. In this context, we developed an Optimal Control (OC) framework based on the GRAPE algorithm5,6,7, that considers the full magnetization dynamics of the steady state, in order to optimize a complex preparation in this sequence.In the present work, we investigate the possibilities offered by our method when combined with a MPRAGE to reach different contrasts between pelvis tissues on a clinical MRI scanner. Four different optimized contrasts images are acquired on a healthy volunteer to demonstrate the versatility and efficiency of the proposed sequence design.
Methode
The proposed method relies on an adaptation of the GRAPE algorithm which enables the optimization of an OC preparation composed of an arbitrary number of pulses in a MPRAGE7. The approach is based on the general expression of the longitudinal steady state as a function of all the parameters of the sequence (acquisition and preparation). Then, the normalized signal in the the k-space center is derived. The optimization problem is:$$\begin{cases} \min_{u} \ C = |S_{a,i}| -|S_{b,i}|\\subject \ to\ |S_{a,i}|=0\ and\ TS =2 \end{cases} $$
Where:
- Optimization variables vector composed of angles, phases and delays : $$u \in R^{\ {N\times3}+1}$$
- Signal intensity
of tissue a, to be saturated, or
tissue b, to be maximized, after the
ith gradient echo acquisition of the readout, once the steady state
is achieved : $$S_{a/b,i} $$
- Time of a segment : $$TS\ (s) $$
T1 and T2 of a healthy volunteer were measured with respectively: two VIBE sequences with two different flip angles (2°,10°) and B1 correction, a CPMG train with 8 TE from 10ms to 60ms. Results were compared and harmonized with the literature8 (Table 1,A) .
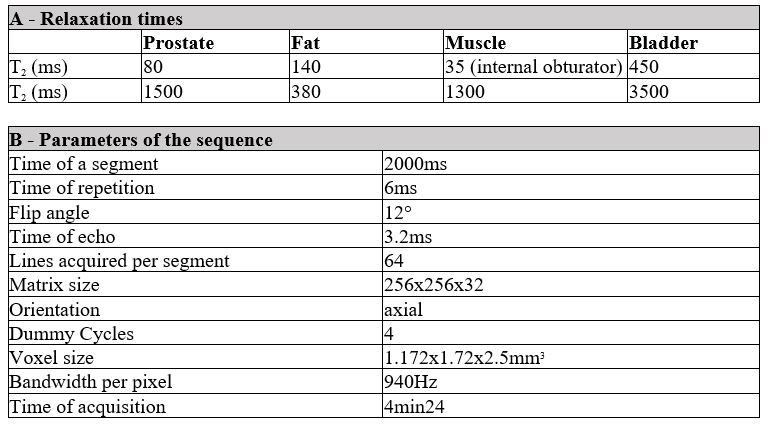
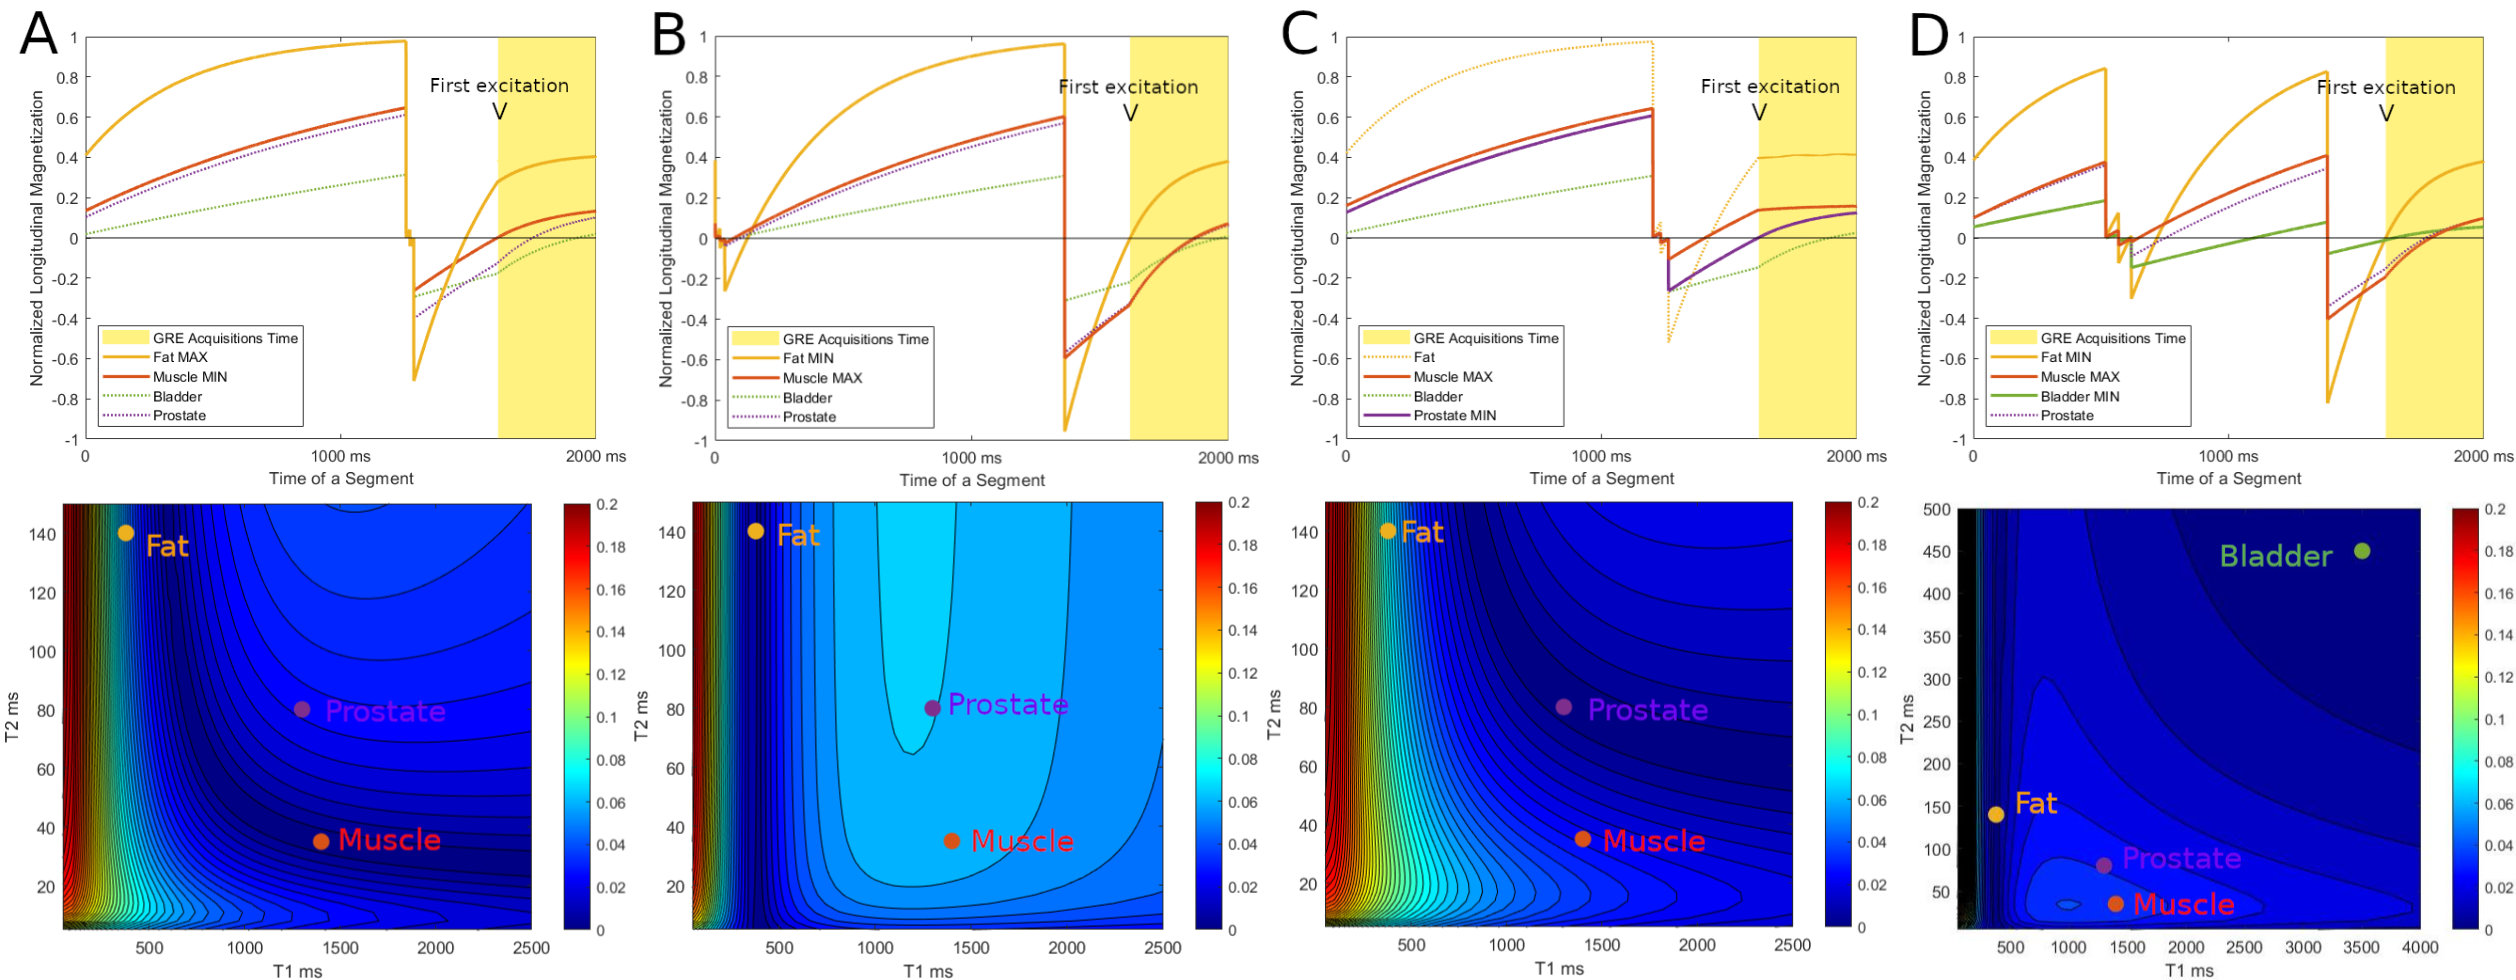
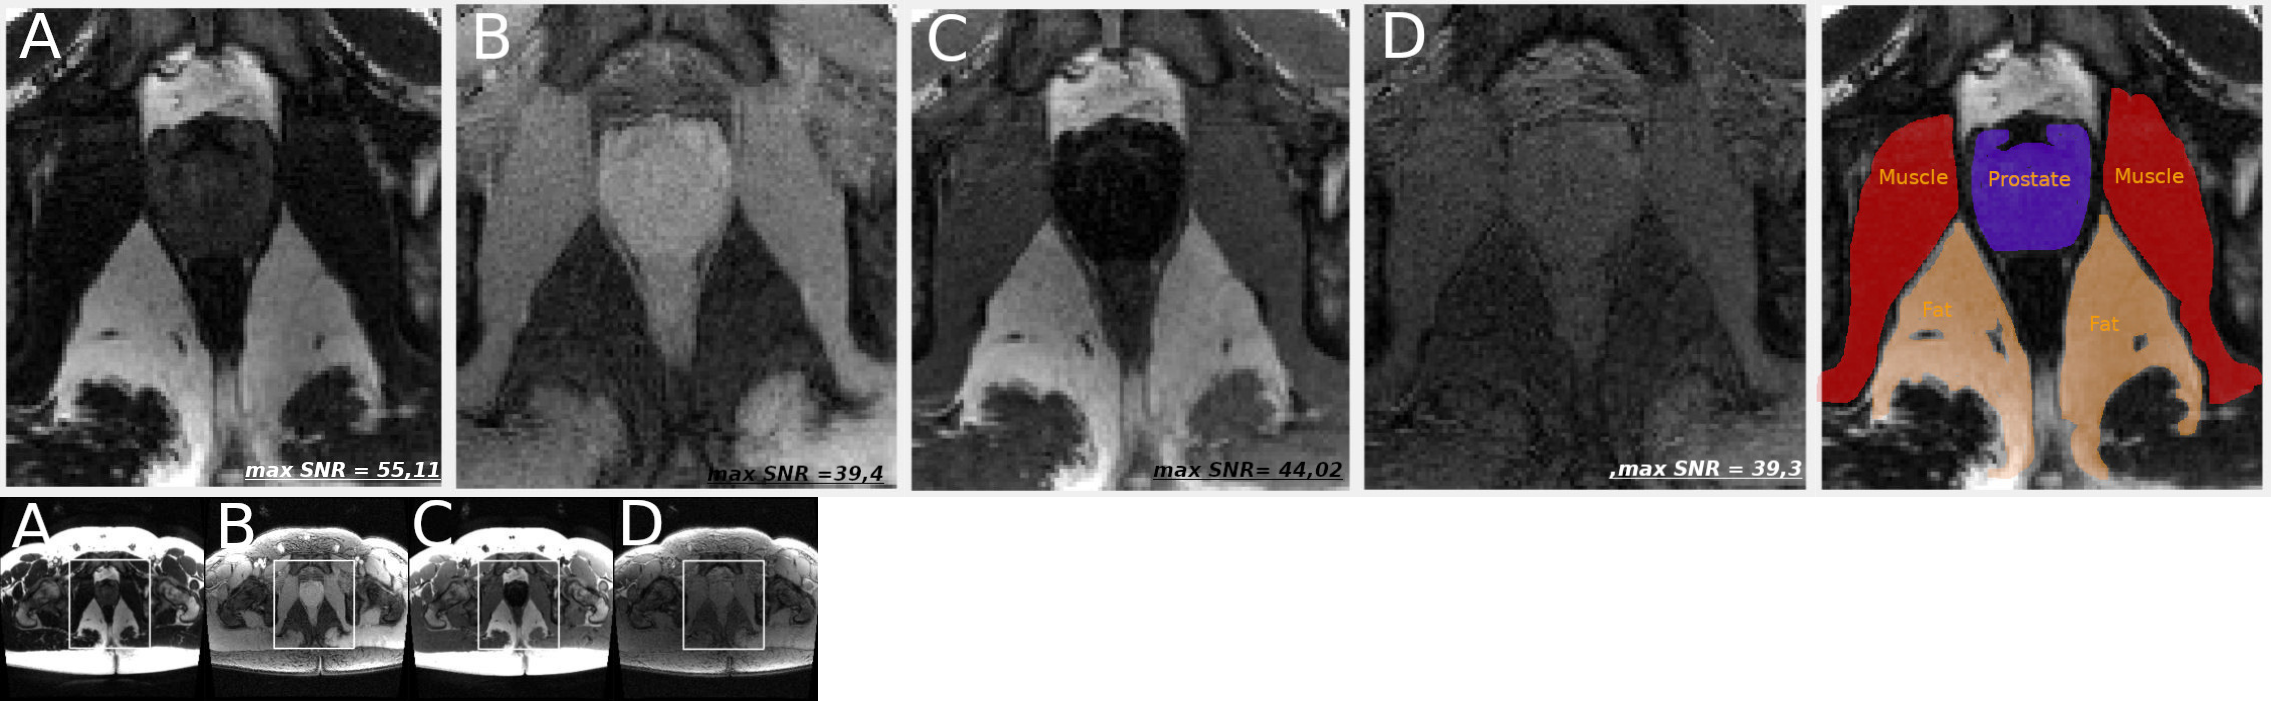
This relaxation times were used to optimize different contrasts between tissues : (A) fat enhancement with internal obturator (io) muscle saturation*, (B) io-muscle enhancement with fat saturation, (C) io-muscle enhancement with prostate saturation, (D) io-muscle enhancement with both bladder and fat saturation. (D) is more complex since two tissues were saturated.
Acquistion parameters remained unchanged between the different solutions (Table 1, B). The four optimized sequences were applied on the healthy volunteer on a 3T Magnetom Vida (Siemens Healthineers, Erlangen). SNR in each region of interest was measured and compared to expected values from the theoretical model.
*Note that for the optimization A, the set of pulses angles was fixed.
Results
Optimizations resulted in the four preparation modules as below:(A) :$$1256ms\ -\ 90^{°}\ - \ 15ms\ - 180^{°} \ - 15ms\ -\ 90_{\phi=180^{°}}^°\ -\ 330ms-\ acquisition$$
(B) :$$10ms\ -\ 90^{°}\ - \ 18ms\ - 180^{°} \ - 18ms\ -\ 90_{\phi=180^{°}}^°\ -\ 1320ms-\ 180^{°} -\ 250ms\ - acquisition$$
(C) :$$1202ms\ -\ 90^{°}\ - \ 30ms\ - 180^{°} \ - 30ms\ -\ 90_{\phi=180^{°}}^°\ -\ 354ms-\ acquisition$$
(D) :$$520ms\ -\ 90^{°}\ - \ 50ms\ - 180^{°} \ - 50ms\ -\ 90_{\phi=180^{°}}^°\ -\ 768ms-\ 180^{°} -\ 228ms\ - acquisition$$
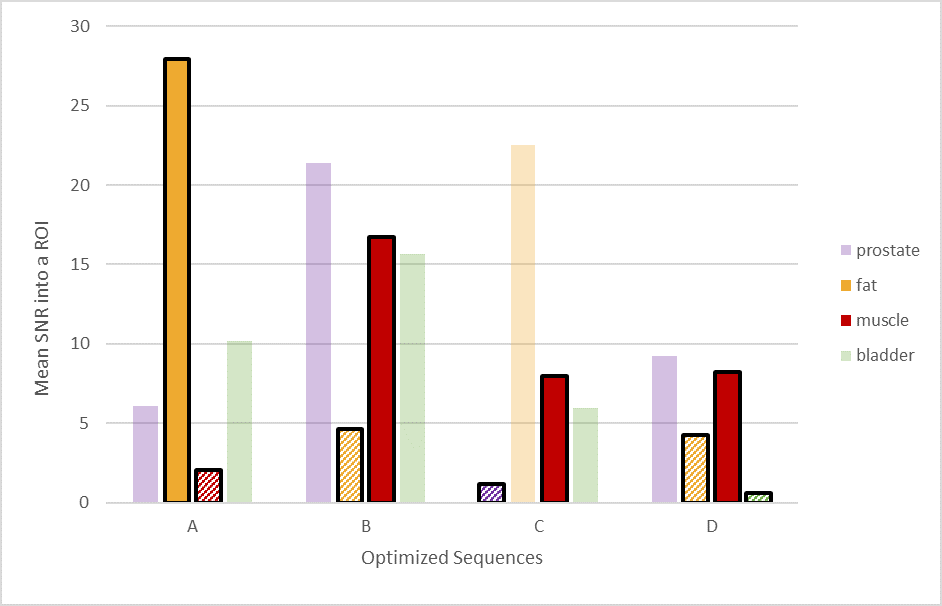
The first line of Figure 2 shows the longitudinal magnetizations’ evolution along a cycle for all four optimized contrasts. The second line illustrates the normalized signal intensity in the center of a k-space as a function of T1/T2 values. Figure 3 and 4 confirms the good saturation of io-muscle, ischiorectal fat, prostate, ischiorectal fat and bladder respectively for optimizations (A), (B), (C) and (D) . Figure 5 shows SNR of each tissue and demonstrates that four contrasts objectives are reached.
Discussion
The results presented are a proof of concept of the proposed contrast optimization method. The OC framework can be extended to the joint optimization of preparation and detection parameters. Increasing the number of preparation pulses gives more degrees of freedom to realize more challenging contrasts or involving a higher number of tissues, such as acquisition D. It is remarkable that preparations A and C are closed to existing preparation schemes (T2Prep-IR9). Finally, this method allows to achieve different contrasts preserving the advantages of a given detection scheme (such as spatial resolution and coverage, motion robustness).Conclusion
A generic optimal control framework was applied to optimize the preparation of a MP-RAGE sequence. Different contrasts are obtained on a 3T clinical MRI on the pelvis using similar acquisition parameters. Future works will investigate the benefit of this approach in the context of post-radiotherapy rectum MRI.Acknowledgements
This work was performed within the framework of the LABEX PRIMES (ANR-11-LABX-0063) of Université de Lyon, within the program "Investissements d'Avenir" (ANR-11-IDEX-0007) operated by the French National Research Agency (ANR). version courte: ANR-11-LABX-0063References
1. J. P. Mugler and J. R. Brookeman, “Three-dimensional magnetization-prepared rapid gradient-echo imaging (3D MP RAGE),” Magnetic Resonance in Medicine, vol. 15, no. 1, pp. 152–157, 1990, doi: 10.1002/mrm.1910150117.
2. R. Deichmann, C. D. Good, O. Josephs, J. Ashburner, and R. Turner, “Optimization of 3-D MP-RAGE Sequences for Structural Brain Imaging,” NeuroImage, vol. 12, no. 1, pp. 112–127, Jul. 2000, doi: 10.1006/nimg.2000.0601.
3. A. Sudhyadhom, I. U. Haq, K. D. Foote, M. S. Okun, and F. J. Bova, “A high resolution and high contrast MRI for differentiation of subcortical structures for DBS targeting: The Fast Gray Matter Acquisition T1 Inversion Recovery (FGATIR),” NeuroImage, vol. 47, pp. T44–T52, Aug. 2009, doi: 10.1016/j.neuroimage.2009.04.018.
4. M. Saranathan, T. Tourdias, E. Bayram, P. Ghanouni, and B. K. Rutt, “Optimization of white-matter-nulled magnetization prepared rapid gradient echo (MP-RAGE) imaging,” Magnetic Resonance in Medicine, vol. 73, no. 5, pp. 1786–1794, 2015, doi: https://doi.org/10.1002/mrm.25298.
5. N. Khaneja, T. Reiss, C. Kehlet, T. Schulte-Herbrüggen, and S. J. Glaser, “Optimal control of coupled spin dynamics: design of NMR pulse sequences by gradient ascent algorithms,” Journal of Magnetic Resonance, vol. 172, no. 2, pp. 296–305, Feb. 2005, doi: 10.1016/j.jmr.2004.11.004.
6. E. Van Reeth, H. Ratiney, M. Lapert, S. J. Glaser, and D. Sugny, “Optimal control theory for applications in Magnetic Resonance Imaging,” Pac. J. Math. Ind., vol. 9, no. 1, p. 9, Dec. 2017, doi: 10.1186/s40736-017-0034-3.
7. B. Vernier, E. Van Reeth, F. Pilleul, O. Beuf, and H. Ratiney, “MRI Contrast Enhancement of Magnetization Prepared Steady State Sequence: An Optimal Control Framework,” in 2021 IEEE 18th International Symposium on Biomedical Imaging (ISBI), Nice, France, Apr. 2021, pp. 1709–1713. doi: 10.1109/ISBI48211.2021.9434151.
8. J. Z. Bojorquez, S. Bricq et al., “What are relaxation times at 3T ?”, Magnetic Resonnance Imaging, vol. 35, pages 69-80, 2011, doi:10.1016/j.mri.2016.08.021
9. Improved delayed enhanced myocardial imaging with T2‐Prep inversion recovery magnetization preparation. J Magn Reson Imaging. 2008;28:1280–1286
Figures