1708
EPIFANI: an ultrafast T1, B1 and magnetization mapping technique1MR Solutions Ltd, Guildford, United Kingdom, 2Department of Biomedical Sciences, University of Antwerp, Wilrijk, Belgium, 3Department of Physics, University of Antwerp, Wilrijk, Belgium
Synopsis
Quantitative MRI still struggles to be used in clinical practice due to long acquisition times. We introduce EPIFANI, an ultrafast B1-corrected T1 mapping technique which uses EPI images acquired in two successive repetition times and a parametric map fit used in VAFI. Both a single-shot and a multi-shot version of EPIFANI were tested on phantoms and in vivo and report accurate T1 values.
Introduction
Quantitative MRI maps allow a non-invasive tissue characterization but fast and accurate relaxometry mapping still remains challenging. In particular, T1 has been investigated as a potential biomarker in neuroradiology for the study of neurodegenerative diseases, as well as tumor characterization and identification, which has promoted the development of T1 mapping techniques in the last decade. Nevertheless, this is still not widely used in clinical imaging protocols due to both long scanning times and calibration sensitivity. For example, RF calibration and knowledge of the excitation field B1 is of cardinal importance for quantitative imaging at high magnetic fields, as inhomogeneities in the excitation field are typical1 and cause an unequal tissue excitation.Variable flip angle with Actual Flip angle Imaging (VAFI)2 is a fast and low-SAR T1 mapping technique with a B1 correction which relies on the acquisition and fitting of Actual Flip angle Imaging (AFI)3 and SPoiled GRadient echo (SPGR) signals. Yet, an ultrafast approach for accurate T1 mapping represents a hot research topic and could promote the use of quantitative MRI as a clinical tool.
A 2D EPI implementation of VAFI called Echo Planar Imaging Fast Actual Nutation Imaging (EPIFANI) is here introduced with both a single-shot and a multi-shot fashion. EPIFANI allows simultaneous mapping of T1, B1, and T2*-reduced equilibrium magnetization M0* with ultrafast acquisitions.
Methods
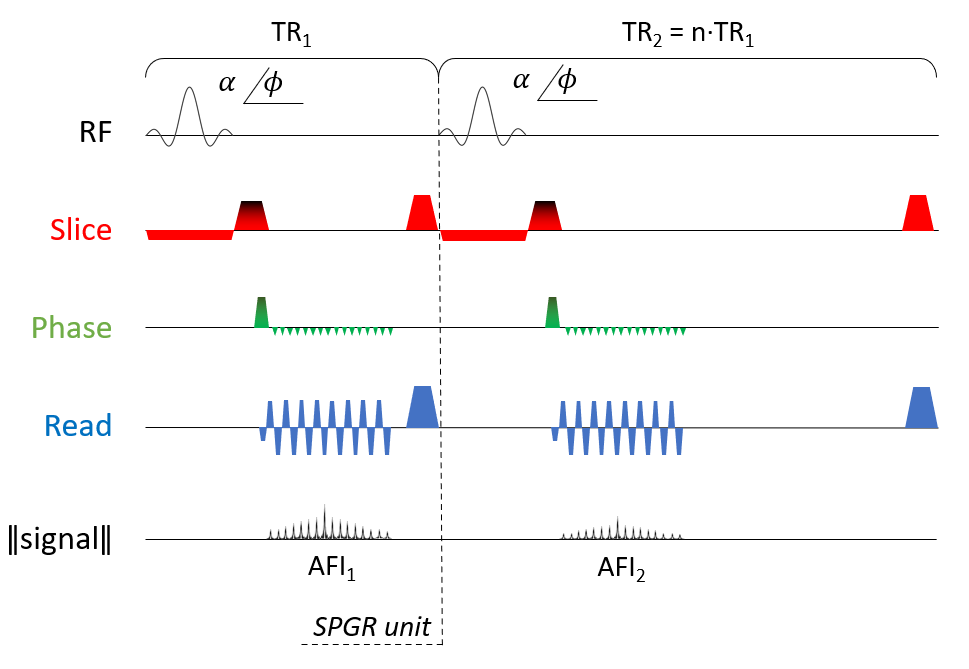
EPIFANI was developed including a 2D EPI readout to acquire data from both an AFI and SPGR sequence (Figure 1). Steady-state was reached with the application of a preparation pulse4 and 10 additional dummy pulses and, for each shot, the same k-space lines were sampled in a consecutive TR1-TR2 period. A single EPIFANI acquisition with the phase encoding gradient switch off was integrated into the sequence right before data acquisition and used as a navigator for Nyquist ghost correction. Even lines of the k-space of the individual shots were first flipped and phase errors were corrected by removing the phase offset provided by the navigator after inverse-Fourier transformation along the readout direction. T1, B1, and M0* were fitted via voxel-wise minimization of the residual sum of squares of the signal intensities and the model signal for AFI and SPGR. Simulations for robustness to noise, effects of T2* induced signal decay (T2*=[0.005-0.5]s), and misalignment among even and odd k-space lines were performed to assess the effects on parameter estimation.Data were acquired on an MR Solutions 4.7T preclinical scanner with flip angle FA=60°, n=TR2/TR1=1000ms/200ms, matrix size=128x128, FOV=40x40mm2, slice thickness=1mm, BW=200kHz – GRE-EPI acquisitions with FA=[15,25,35]°, TR=200ms – NEX=3, and an optimized RF phase increment with high spoiling gradient areas. Both single-shot and double-shot EPIFANI were performed. A homogeneous agar gelatin phantom and a mouse head were scanned with a quadrature coil with 38 mm ID. Reference T1 values were computed via a 14 points Inversion Recovery (TR=10s, TI=[0.05-4]s) and a VAFI acquisition.
Results
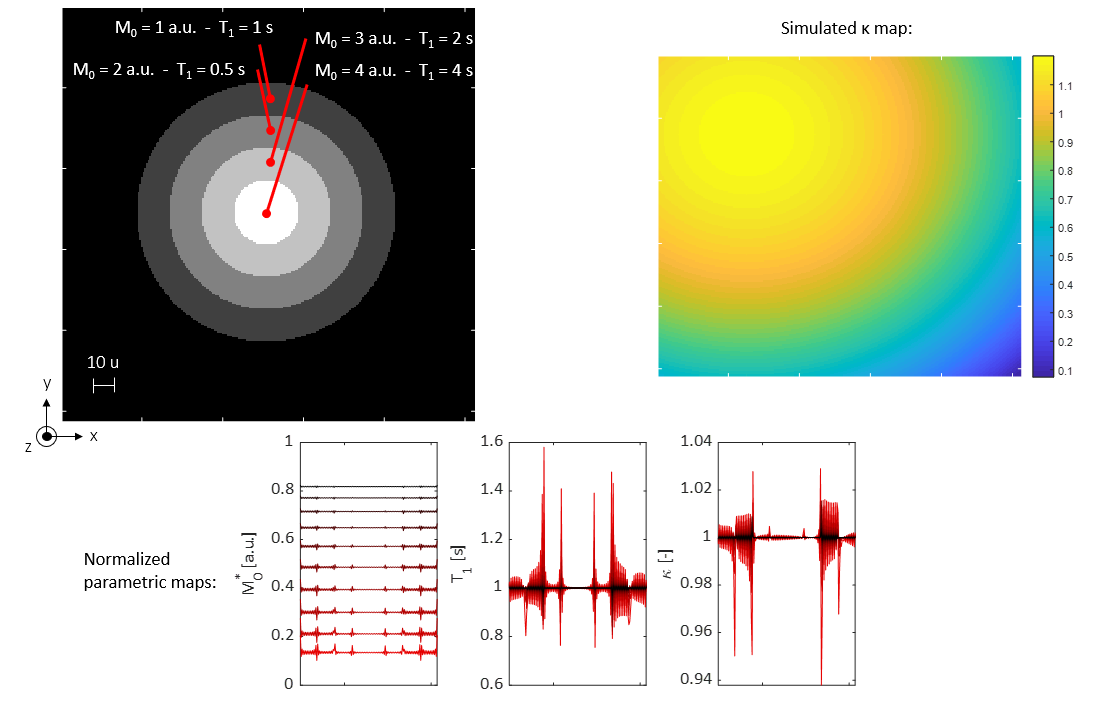
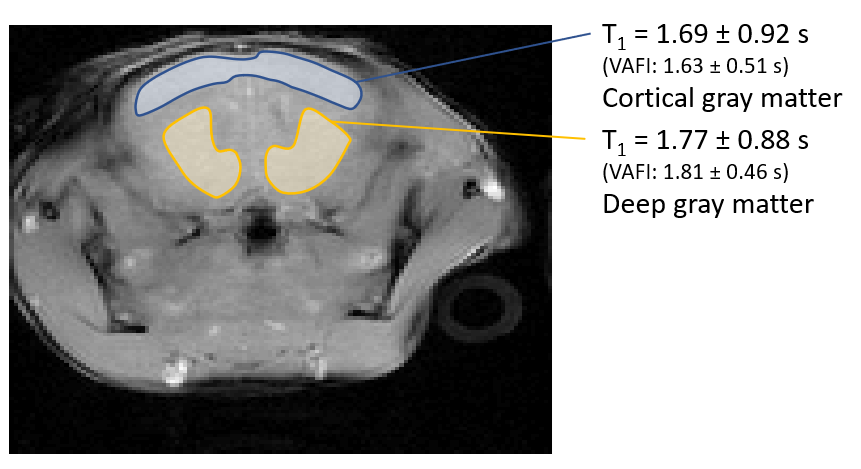
Simulations: maps of T1 and B1 reliably report the original input values, with inaccuracies found mainly along the tissue interfaces. Magnetization maps encompass the signal intensity variations provided by T2* decay in k-space (see Figure 2), although for T2* values smaller than 50ms with a single-shot acquisition median inaccuracies in T1 greater than 10% arise.Acquisitions: the single-slice acquisition for EPIFANI takes less than 20 seconds and provides mean T1 values of 2.056 (SE: 0.02) s with respect to 2.054 (SE: 0.001) s (IR) for the gelatin phantom. For in vivo data, an example of AFI image respective T1 values is reported in Figure 3. Median values for EPIFANI for cortical and deep grey matter T1 values (1.69±0.92 s - 1.77±0.88 s) are in line with literature5 and agree with VAFI values (1.63±0.51 s - 1.81±0.46 s).
Discussion
EPIFANI was developed as fast implementation of VAFI and can be used for ultrafast relaxometry mapping. While quantitative maps accurately report T1 values, the computed magnetization maps encompass the effects of T2* decay. Simulations confirm that the use of multi-shot acquisitions and partial Fourier is advisable to avoid T2* artifacts. Future developments will focus on the development of 3D EPIFANI, parameter optimization, and the validation of EPIFANI on a larger cohort of samples and tissues.Conclusion
EPIFANI allows the acquisition of ultrafast and accurate T1 and B1 maps.Acknowledgements
This research was funded by the B-Q MINDED EU H2020 project under grant agreement No.764513.References
[1] Boudreau M., Tardif C. L., Stikov N., Sled J. G., Lee W., and Pike G. B., “B1 mapping for bias-correction in quantitative T1 imaging of the brain at 3T using standard pulse sequences”, Journal of Magnetic Resonance Imaging, vol. 46, no. 6, pp. 1673–1682, 2017.
[2] Hurley S. A., Yarnykh V. L., Johnson K. M., Field A. S., Alexander A. L., and Samsonov A. A., “Simultaneous variable flip angle–actual flip angle imaging method for improved accuracy and precision of three-dimensional T1 and B1 measurements”, Magnetic Resonance in Medicine, vol. 68, no. 1, pp. 54–64, 2012.
[3] Yarnykh V. L., “Actual flip-angle imaging in the pulsed steady state: a method for rapid three-dimensional mapping of the transmitted radiofrequency field”, Magnetic Resonance in Medicine, vol. 57, no. 1, pp. 192–200, 2007.
[4] Zampini M.A. and Garipov R., “Fast Steady-State Approach for 3D T1 and B1 Mapping with an Updated Optimization Merit Function for an Improved Accuracy and Precision”, in ESMRMB 2020, vol. 33, p. S148, Springer, 2020.
[5] van de Ven R. C., Hogers B., van den Maagdenberg A. M., de Groot H. J., Ferrari M. D., Frants R. R., Poelmann R. E., van der Weerd L., and Kiihne S. R., “T1 relaxation in in-vivo mouse brain at ultra-high field”, Magnetic Resonance in Medicine, vol. 58, no. 2, pp. 390–395, 2007.
Figures