1707
Sampling Mask Optimization for Compressed Sensing PETRA MRI1Dept.of Radiology, Medical Physics, Medical Center University of Freiburg, Faculty of Medicine, University of Freiburg, Freiburg, Germany, 2Department of Diagnostic and Interventional Radiology, Medical Center University of Freiburg, Faculty of Medicine, University of Freiburg, Freiburg, Germany, 3Department of Radiology, Cantonal Hospital Grisons, Chur, Switzerland
Synopsis
Single point imaging (SPI) is intrinsically time-inefficient resulting in very long scan times in PETRA. Compressed sensing PETRA (csPETRA) shortens the acquisition time – here, various csPETRA undersampling schemes were generated and an optimal undersampling scheme was determined experimentally. It was shown in csPETRA knee imaging that in Poisson sampling combined with a spherical fully-sampled center results in minimum error compared to the fully-sampled acquisitions.
Introduction
MRI of short-T2* tissues such as bone and tendons requires special short-TE pulse sequences such as zero echo time (ZTE) and Pointwise Encoding Time Reduction with Radial Acquisition (PETRA)1,2. In ZTE, finite RF pulse durations and hardware delays (i.e., dead time) result in a sampling gap at the center of k-space, which increases in terms of number of missing acquisition dwells with increasing TE, spatial resolution, and acquisition bandwidth3,4. In PETRA, the missing samples are retrieved using single point imaging (SPI). As SPI is intrinsically time-inefficient, scan times in PETRA can become very long, and compressed sensing PETRA (csPETRA) sequence was proposed to shorten the acquisition time3.In this work, we investigated the effect of the undersampling scheme on the image quality of csPETRA for knee imaging using acceleration factors (Acc) up to 16. The optimal undersampling scheme was tested in 6 healthy volunteers.
Methods
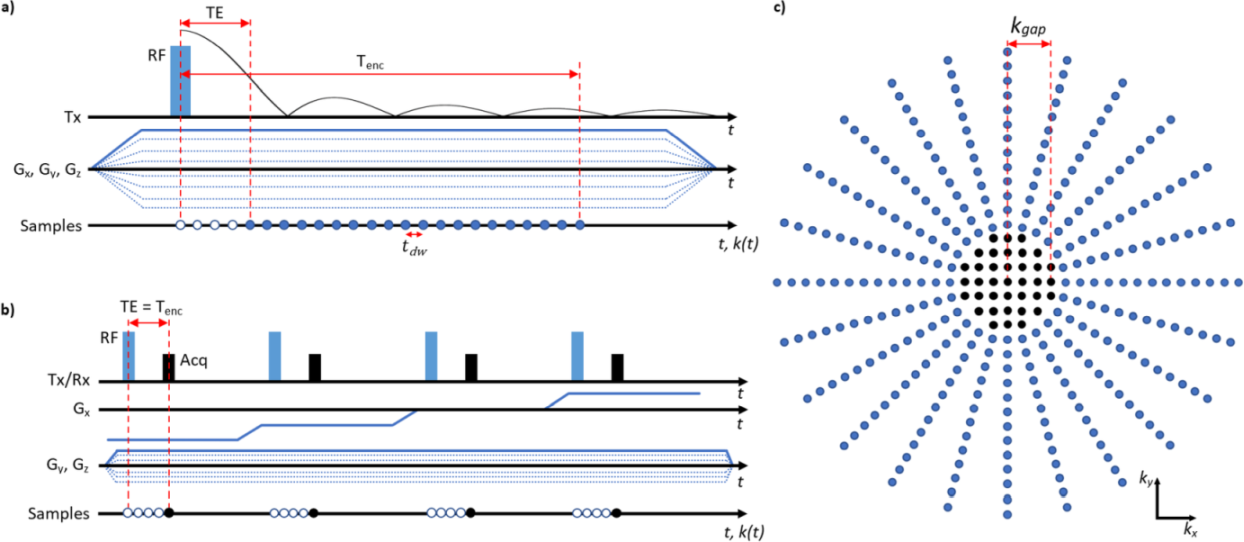
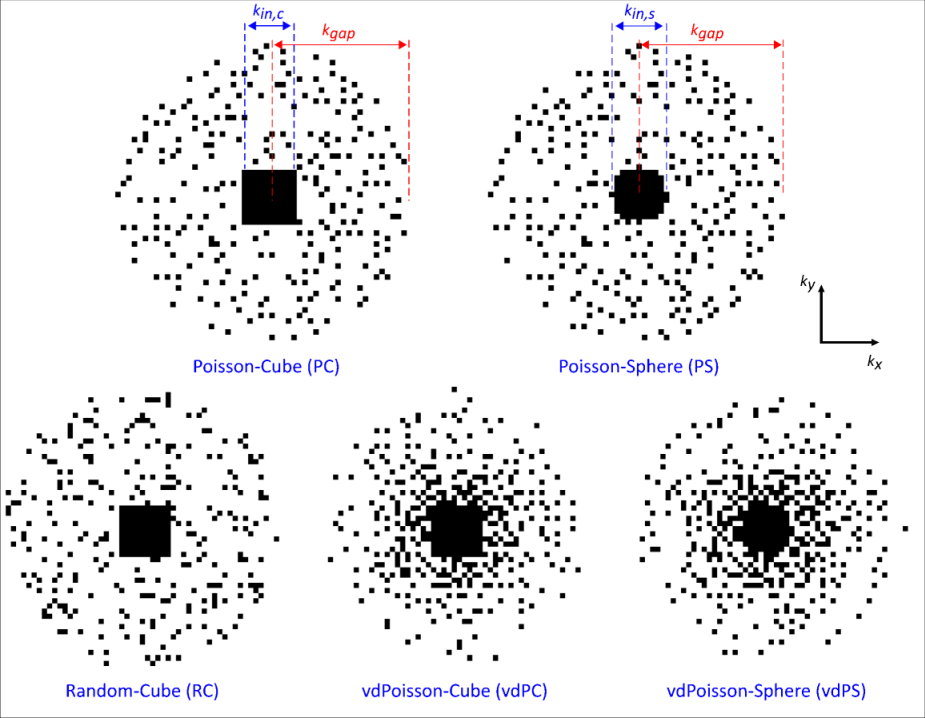
PETRA consists of an outer radial k-space acquisition and an SPI section to fill the inner k-space gap (Fig. 1). The number of samples at the k-space radius of the SPI section in PETRA is given by $$$N_{gap}=\frac{TE}{t_{dwell}}$$$ ($$$t_{dwell}$$$: dwell time).Hence, the required number of SPI samples is approximately $$$N_{spi}=\frac{4}{3}\pi(N_{gap})^3$$$, which shows a cubic relation between the radius of the gap and total scan time. To reduce the scan time for the SPI section only a small portion of the SPI points is acquired in csPETRA, and the image is reconstructed by solving the following minimization problem:$$\begin{matrix}\underset{\mathbf{m}}{\operatorname{argmin}}\lambda\text{TV}(\mathbf{m})+\alpha\|\mathbf{m}\|_1\\s.t.\|\mathbf{M\mathcal{F}m}-\mathbf{s}\|_2<\epsilon\end{matrix},$$where $$$\mathbf{M}$$$ is the sampling mask, $$$\mathbf{m}$$$ is the vectorized 3D image, $$$\mathbf{\mathcal{F}}$$$ is the 3D discrete Fourier transform operator, TV(⋅) is 3D total variation operator, $$$\|⋅\|_1$$$ is $$$\ell_1$$$-norm operator, $$$\|⋅\|_2$$$ is $$$\ell_2$$$-norm operator, $$$\lambda$$$ and $$$\alpha$$$ are scalar weights of TV and $$$\ell_1$$$-norm regularization operators, respectively. $$$\epsilon$$$ is the bound on the data fidelity error. The CS reconstruction was implemented using Alternating Direction Method of Multipliers5 of the BART toolbox6.In this study, various SPI sampling masks were generated by varying the distribution of the sampling positions, the density of samples, and the shape of the fully sampled region to improve the image quality. For comparison, 5 different undersampling schemes were generated: Random-Cube(RC), Poisson-Cube(PC), Poisson-Sphere(PS), variable-density Poisson-Sphere(vdPS), and variable-density Poisson-Cube(vdPC). In RC, sampling points are determined fully-randomly with a cubical fully-sampled region whereas in the other schemes the pseudo-random Poisson disk distribution7 is used. In RC, PC, and vdPC a cubical fully-sampled region is selected, whereas in PS and vdPS a spherical region is selected. In vdPC and vdPS, the density of the samples was set inversely proportional to the distance to k-space center. In Fig. 2 the sampling patterns at $$$k_z=0$$$ plane are presented.
The performance was measured using the Structural Similarity (SSIM) index8 and the normalized-mean-square-error. Moreover, images were semi-quantitatively analyzed independently by 2 radiologists specialized on musculoskeletal radiology (12 and 2 years of experience): (i) Artifacts and image quality for bone, muscle and intraarticular structures and (ii) contrast between different adjacent structures and delineation of those were evaluated using 5 point Likert scales9. Original PETRA images were used as the standard of reference. Inter-reader agreement was calculated using Kappa with quadratic weighting10.
Experiments were performed at a 3T MRI system (MAGNETOM Prisma, Siemens, Erlangen) using a 15‑channel Tx/Rx knee coil (QED, Cleveland, OH). In-vivo PETRA data of the knee of six healthy volunteers was acquired with a full SPI section: FOV=(18cm)3, TR=2ms, TE=48µs, $$$\tau_{RF}$$$=8µs, $$$\alpha$$$=6°, voxel size=(0.45mm)3, projections: 150,000, SPI points: 82,519, tacq=7.8mins. Undersampling with SPI was applied retrospectively.
Results
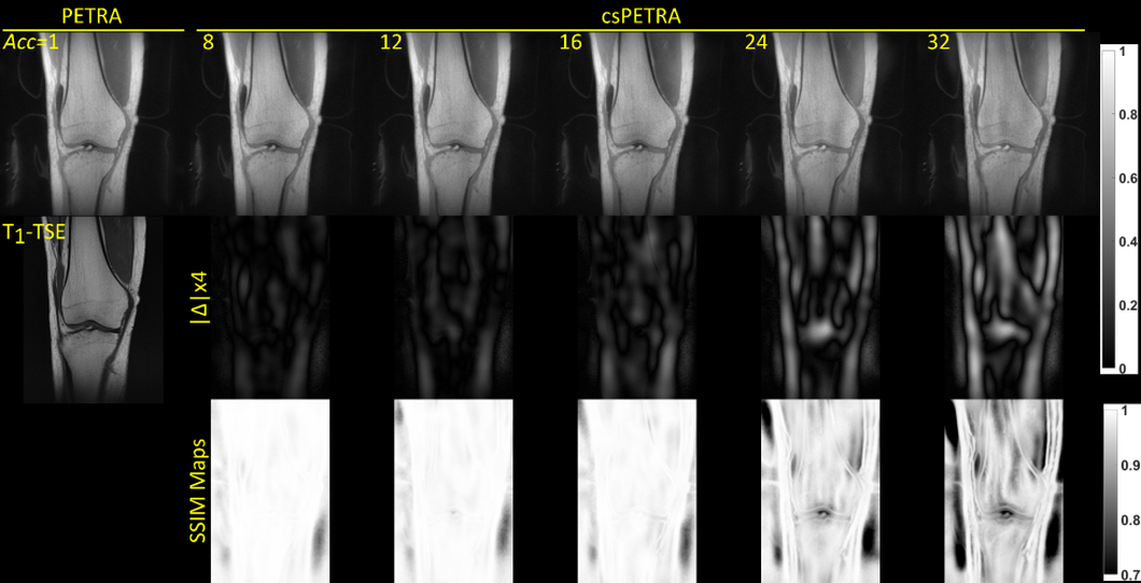
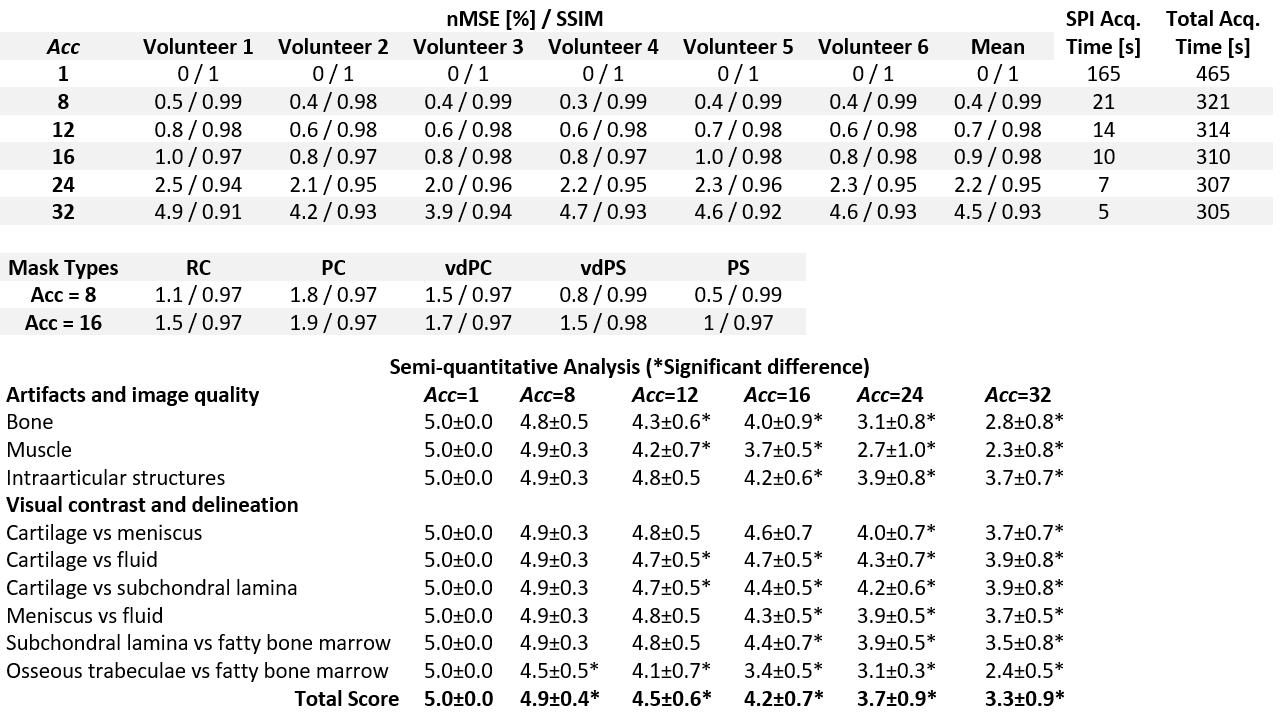
In Fig. 3 csPETRA knee images of one volunteer are presented for the RC, PC, PS, vdPS, and vdPC schemes together with the absolute differences and SSIM maps for an acceleration rate of 8. The PS scheme with a spherical fully-sampled region with $$$k_{in,s}=10k_{𝑑𝑤}$$$, outperformed other schemes in terms of nMSE and SSIM. For PS case nMSE of 0.5% and a SSIM of 0.99 (Table 1) were found for 8-fold acceleration. In Figure 4, csPETRA knee images with PS are presented for different Acc with a TSE image as reference. The error intensity increases with Acc which is visible in structures that contain low frequency information such as muscles. Table 1 shows the semi-quantitative analysis, and nMSE and SSIM table of images with their acquisition times. The nMSE is less than 1% even for the acceleration factor of Acc=16, in which the SPI acquisition time was reduced from 165 seconds to 10 seconds. The average SSIM of all volunteers for Acc=16 was 0.97. SSIM maps suggest that structural information is preserved for intra- and periarticular structures including menisci, cartilage, ligaments, and periarticular tendons.Discussion
csPETRA reduces the acquisition times significantly while preserving the anatomical details. Using a sampling mask with Poisson sampling and a spherical fully-sampled region (PS) results in minimum error and highest structural similarity compared to the fully-sampled PETRA image for knee imaging. The optimal sampling mask for csPETRA was determined for knee imaging among various undersampling schemes up to an acceleration rate of 16. For different regions of interest and SNR conditions, undersampling mask can be further optimized empirically.Acknowledgements
.References
1. Weiger M, Pruessmann KP. MRI with Zero Echo Time. In: Harris RK, editor. Encyclopedia of Magnetic Resonance. Chichester, UK: John Wiley & Sons, Ltd; 2012. p. emrstm1292. doi: 10.1002/9780470034590.emrstm1292.
2. Grodzki DM, Jakob PM, Heismann B. Ultrashort echo time imaging using pointwise encoding time reduction with radial acquisition (PETRA). Magn. Reson. Med. 2012;67:510–518 doi: 10.1002/mrm.23017.
3. Ilbey S, Fischer J, Bock M, Ozen AC. Compressed Sensing PETRA MRI. In: Proceedings of the 29th scientific meeting, International Society for Magnetic Resonance in Medicine, Virtual; p. 908.
4. Froidevaux R, Weiger M, Rösler MB, Brunner DO, Pruessmann KP. HYFI: Hybrid filling of the dead‐time gap for faster zero echo time imaging. NMR in Biomedicine 2021;34 doi: 10.1002/nbm.4493.
5. Boyd S, Parikh N, Chu E. Distributed optimization and statistical learning via the alternating direction method of multipliers. Now Publishers Inc; 2011.
6. Tamir JI, Ong F, Cheng JY, Uecker M, Lustig M. Generalized magnetic resonance image reconstruction using the Berkeley advanced reconstruction toolbox. In: ISMRM Workshop on Data Sampling & Image Reconstruction, Sedona, AZ. ; 2016.
7. Cook RL. Stochastic sampling in computer graphics. ACM Trans. Graph. 1986;5:51–72 doi: 10.1145/7529.8927.
8. Z Wang A, C Bovik H, Sheikh R, Simoncelli EP. Image quality assessment: from error visibility to structural similarity. IEEE transactions on image processing 2004;13:600–612.
9. Jamieson S. Likert scales: how to (ab)use them. Med Educ 2004;38:1217–1218 doi: 10.1111/j.1365-2929.2004.02012.x.
10. Landis JR, Koch GG. The Measurement of Observer Agreement for Categorical Data. Biometrics 1977;33:159 doi: 10.2307/2529310.
Figures