1702
Quantification of grey matter sodium content in joint sodium MR reconstructions using anatomical regularization and T2* estimation at 3T1KU Leuven, Leuven, Belgium, 2New York University School of Medicine, New York City, NY, United States
Synopsis
Sodium MR signal acquisition and image reconstruction are severely hampered by the fast relaxation properties of the sodium nuclei. Signal decay due to fast transverse relaxation during readout leads to loss of high frequency information and severe partial volume effects (e.g.signal spill over from CSF into GM). In this work, we apply a reconstruction framework including anatomical regularization and signal decay modeling and estimation to dual echo sodium data to three subjects to investigate its effect on cortical grey matter sodium quantification.
Introduction
Sodium nuclei yield the second largest in vivo MRI signal and can be used to image the function of excitable tissues in humans. Unfortunately, the signal acquisition and image reconstruction are severely hampered by the fast relaxation properties of the sodium nuclei. Signal decay due to fast transverse relaxation during readout leads to loss of high frequency information - even in very fast radial readout sequences. Consequently, reconstructed sodium images have low spatial resolution leading to severe partial volume effects [1] which especially affect the quantification in cortical grey matter areas due to their proximity to cerebrospinal spinal fluid (CSF). We have previously presented a framework [2] for iterative sodium MR reconstruction that includes signal decay modeling and joint estimation and is aided by anatomical regularization using the Bowsher’s method [3] with a high resolution proton MR image as a prior. In this work, we apply this reconstruction framework to sodium data of three subjects to investigate its effect on cortical grey matter sodium quantification.Theory
In the joint reconstruction framework, we model the expected acquired signal in k-space as$$\bar{s}[f,d] (k) = \int_V f(x) c(x) d(x,t(k))) e^{-i2\pi \langle k,x \rangle} dx,$$
where $$$f$$$ is the transverse sodium magnetization to be reconstructed, $$$c$$$ is the coil sensitivity, $$$d$$$ is spatially dependent signal decay, and $$$t(k)$$$ is the k-space trajectory.
The signal decay is approximated using the mono-exponential model
$$d(x,t(k)) = e^{-\frac{t(k)}{T_2^*(x)}} = \Gamma (x) ^{\frac{t(k)}{T_E}} $$
with
$$\Gamma (x) = e^{-\frac{T_E}{T_2^*(x)}},$$
leading to the joint reconstruction problem for dual echo Na MR data
$$\text{argmin}_{f,\Gamma} \underbrace{||s_1 - \bar{s}_1[f,\Gamma]||_2^2}_{\text{data fidelity 1st echo}} + \underbrace{||s_2 - \bar{s}_2[\Gamma f,\Gamma]||_2^2}_{\text{data fidelity 2nd echo}} + \underbrace{\beta _r \left( R(\Re f) + R(\Im f) \right) + \beta_\Gamma \, R(\Gamma)}_{\text{regularization}}.$$
Anatomical regularization on $$$f$$$ and $$$\Gamma$$$ is incorporated using the symmetric Bowsher prior [3] where the structural information is derived from a high resolution hydrogen T1 MR image.
Methods
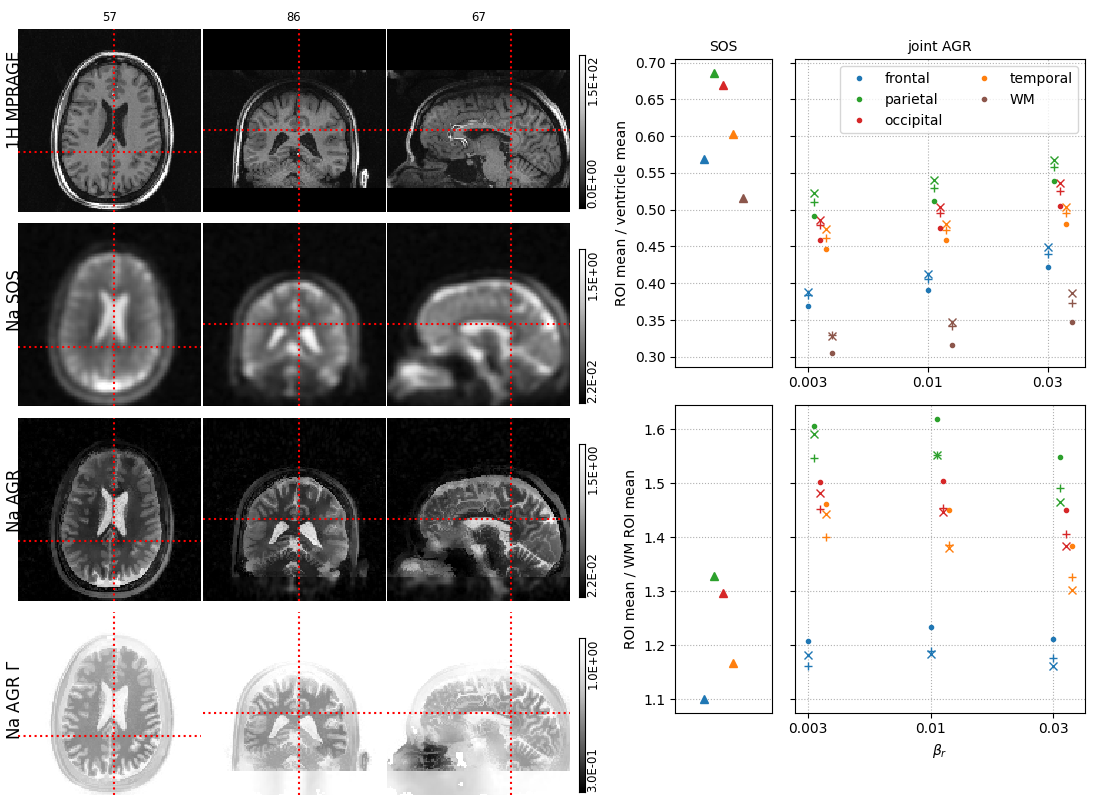
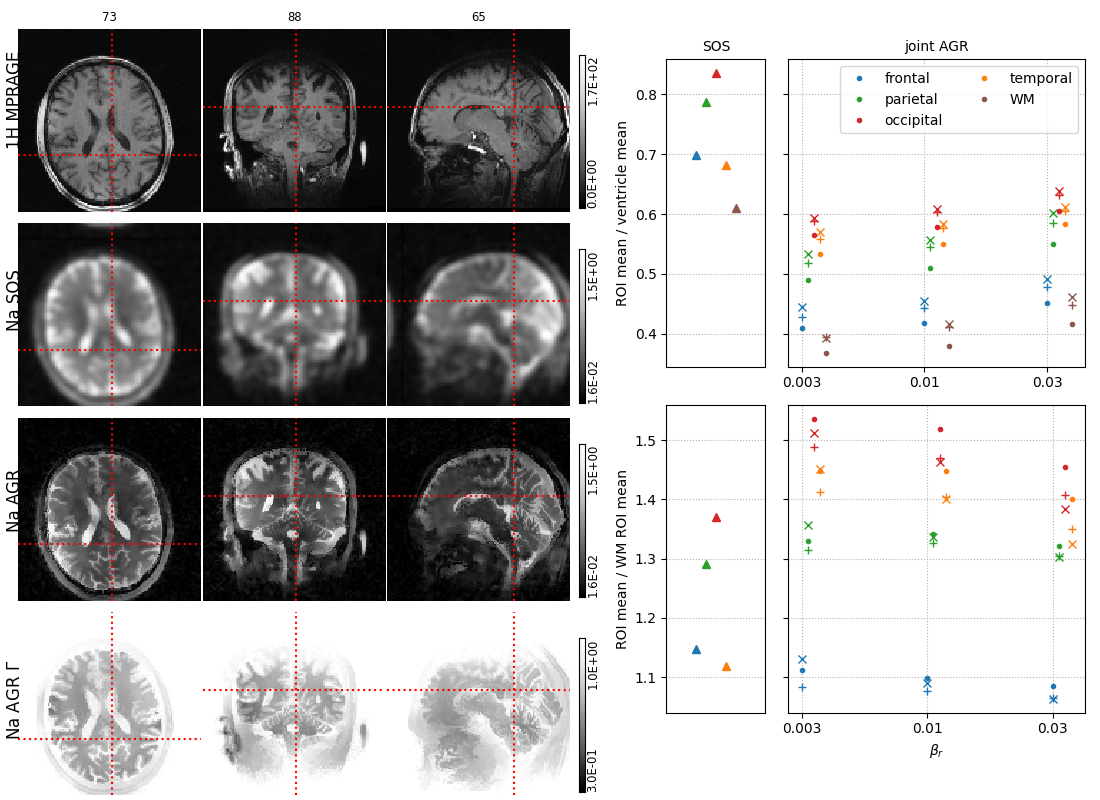
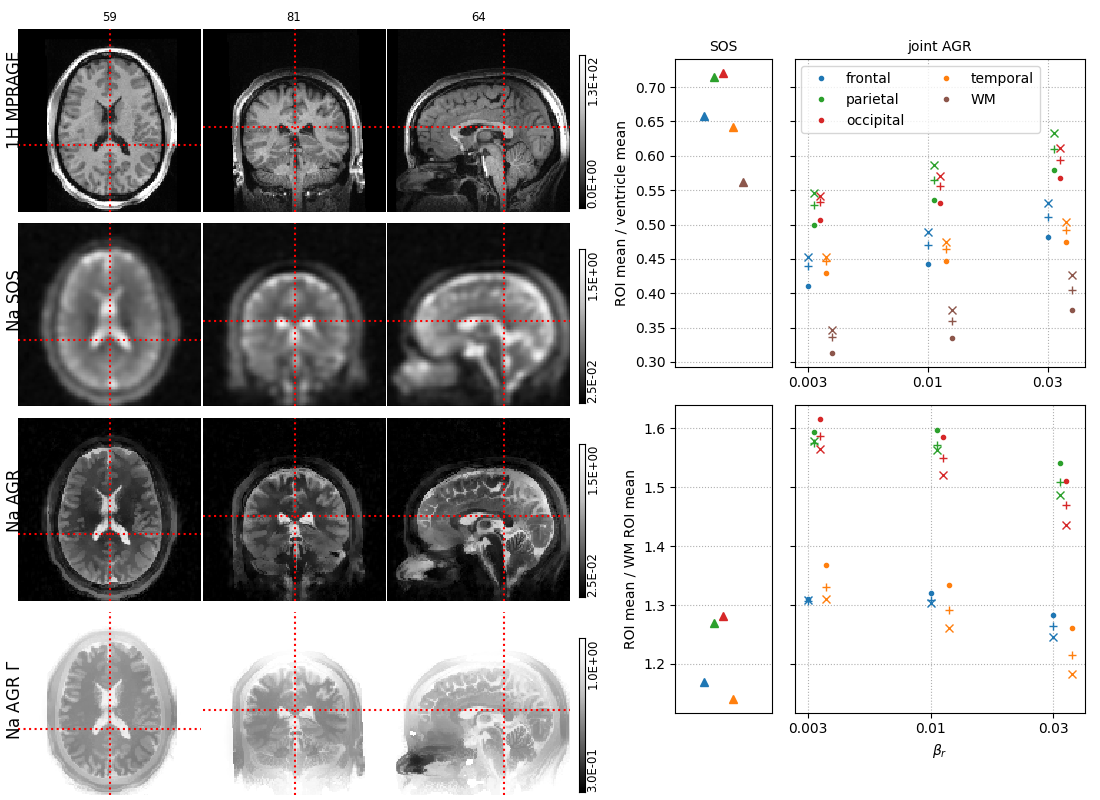
Three dual echo (0.3/5 ms) sodium data sets were acquired at 3T using a MAGNETOM PRISMA and a custom-built 8 channel dual tuned head coil. The data were acquired using a twisted projection sequence [4] with 1596 views (4mm nominal spatial resolution) and a repetition time of 100ms. The data sets were reconstructed using the framework above for different levels of regularization (AGR "anatomical-guided reconstructions").The large scale non-convex optimization problem was solved using alternating L-BFGS-B updates. Coil sensitivities were estimated using a sum of squares image from all channels. In all reconstruction we quantified the mean signal intensity in the frontal, parietal, occipital and temporal lobes, as well in white matter and the two lateral ventricles. The latter was used to calculated the signal intensity of CSF. Relative regional sodium content was quantified by calculating the ratios between the cortical regions of interest (ROIs) with respect to the CSF ROI and WM ROI. All ROIs were defined based on a freesurfer brain parcellation of a hydrogen MPRAGE sequence that was acquired using the same coil. For comparison, the same quantities were calculated in a standard sum of squares (SOS) image obtained from inverse Fourier transforms of filtered k-space data.Results
Reconstructed images and regional quantification results for all 3 subjects are shown in Figures 1-3.In general, the AGR reconstructions preserve the boundaries between CSF and GM/WM better which results in lower signal spill over from CSF into GM/WM. The latter also leads to better contrast between GM and WM. In all cases, the regional quantification results are robust against the choice of the regularization parameters $$$\beta_r$$$ and $$$\beta_{\Gamma}$$$. Moreover, the ratio of cortical Na signal to the ventricles (CSF) in the joint AGR reconstructions (range 0.4 - 0.64) is lower compared to the SOS image (range 0.57 - 0.83) in all regions and subjects. In contrast, the cortical to white matter ratio was increased in the AGR reconstruction compared to the SOS image in all regions and subjects except for the frontal ROI in the second subject.Discussion & Conclusion
Our results demonstrate that sodium MR reconstruction using anatomical regularization in combination with signal decay modeling and estimation allows to suppress noise while preserving anatomical detail at the same time. The latter strongly reduces signal spill-over from CSF into GM/WM leading to lower regional GM/CSF ratios and higher regional GM/WM ratios. The improvements afforded by this approach could have significant implications for the assessment of changes in cortical sodium content as a result of degenerative disorders such as Alzheimer's disease [5].Acknowledgements
References
[1] Stobbe et al., "Calculating potential error in sodium MRI with respect to the analysis of small objects", Magnetic Resonance in Medicine, 79, 2018
[2] Schramm et al. "Joint sodium MR reconstruction and T2* estimation using anatomical regularization", ISMRM 2021.
[3] Bowsher et al. “Utilizing MRI information to estimate F18-FDG distributions in rat flank tumors”, Nuclear Science Symposium Conference Record, 2004 IEEE
[4] Boada et al., "Fast three dimensional sodium imaging.", Magnetic Resonance in Medicine, 37, 1997
[5] Mellon et al., "Sodium MR imaging detection of mild Alzheimer disease: preliminary study.", American Journal of Neuroradiology 30, 2009
Figures