1701
Reproducibility of IVIM Quantification Across Diffusion Gradient Waveforms using Pseudo-Diffusion and Physical IVIM Signal Models1Radiology, University of Wisconsin-Madison, Madison, WI, United States, 2Medical Physics, University of Wisconsin-Madison, Madison, WI, United States
Synopsis
The intravoxel incoherent motion (IVIM) DWI signal has been shown to depend on both b-value and the first motion moment (M1). However, traditional pseudo-diffusion IVIM signal models only include b-value dependence. In this work, monopolar and 2D (b-M1) IVIM acquisitions were acquired using diffusion gradient waveforms with different maximum amplitudes to emulate different gradient hardware. From each acquisition, IVIM estimates were obtained by fitting pseudo-diffusion and physical (M1 dependent) IVIM signal models. Estimated IVIM parameters were compared across acquisitions. Reproducible physical IVIM estimates were obtained using 2D IVIM-DWI acquisitions, while pseudo-diffusion IVIM estimates obtained using monopolar acquisitions demonstrated poor reproducibility.
Introduction
Intravoxel incoherent motion (IVIM) DWI has demonstrated promise in the evaluation of diffuse1-6 and focal1,7-11 liver diseases. However, conventional IVIM-DWI methods (using monopolar gradient waveforms) lead to high measurement variability and poor precision (repeatability and reproducibility) of IVIM perfusion fraction (F) and pseudo-diffusion (D*) measurements.1,2,7,11-14 Recently, an IVIM-DWI acquisition utilizing 2D (b-value and first motion moment (M1)) noise-optimized gradient waveforms was proposed, demonstrating substantially improved stability.15Further, the perfusion component of the IVIM signal has been shown to depend on both b and M1.16,17 However, traditional pseudo-diffusion IVIM signal models only include b-value dependence.18 A physical IVIM signal model that includes both b and M1 dependence has recently been proposed.16 Therefore, the purpose of this work was to evaluate the reproducibility of liver pseudo-diffusion and physical IVIM estimates obtained from 2D (b-M1) and monopolar IVIM acquisitions.
Methods
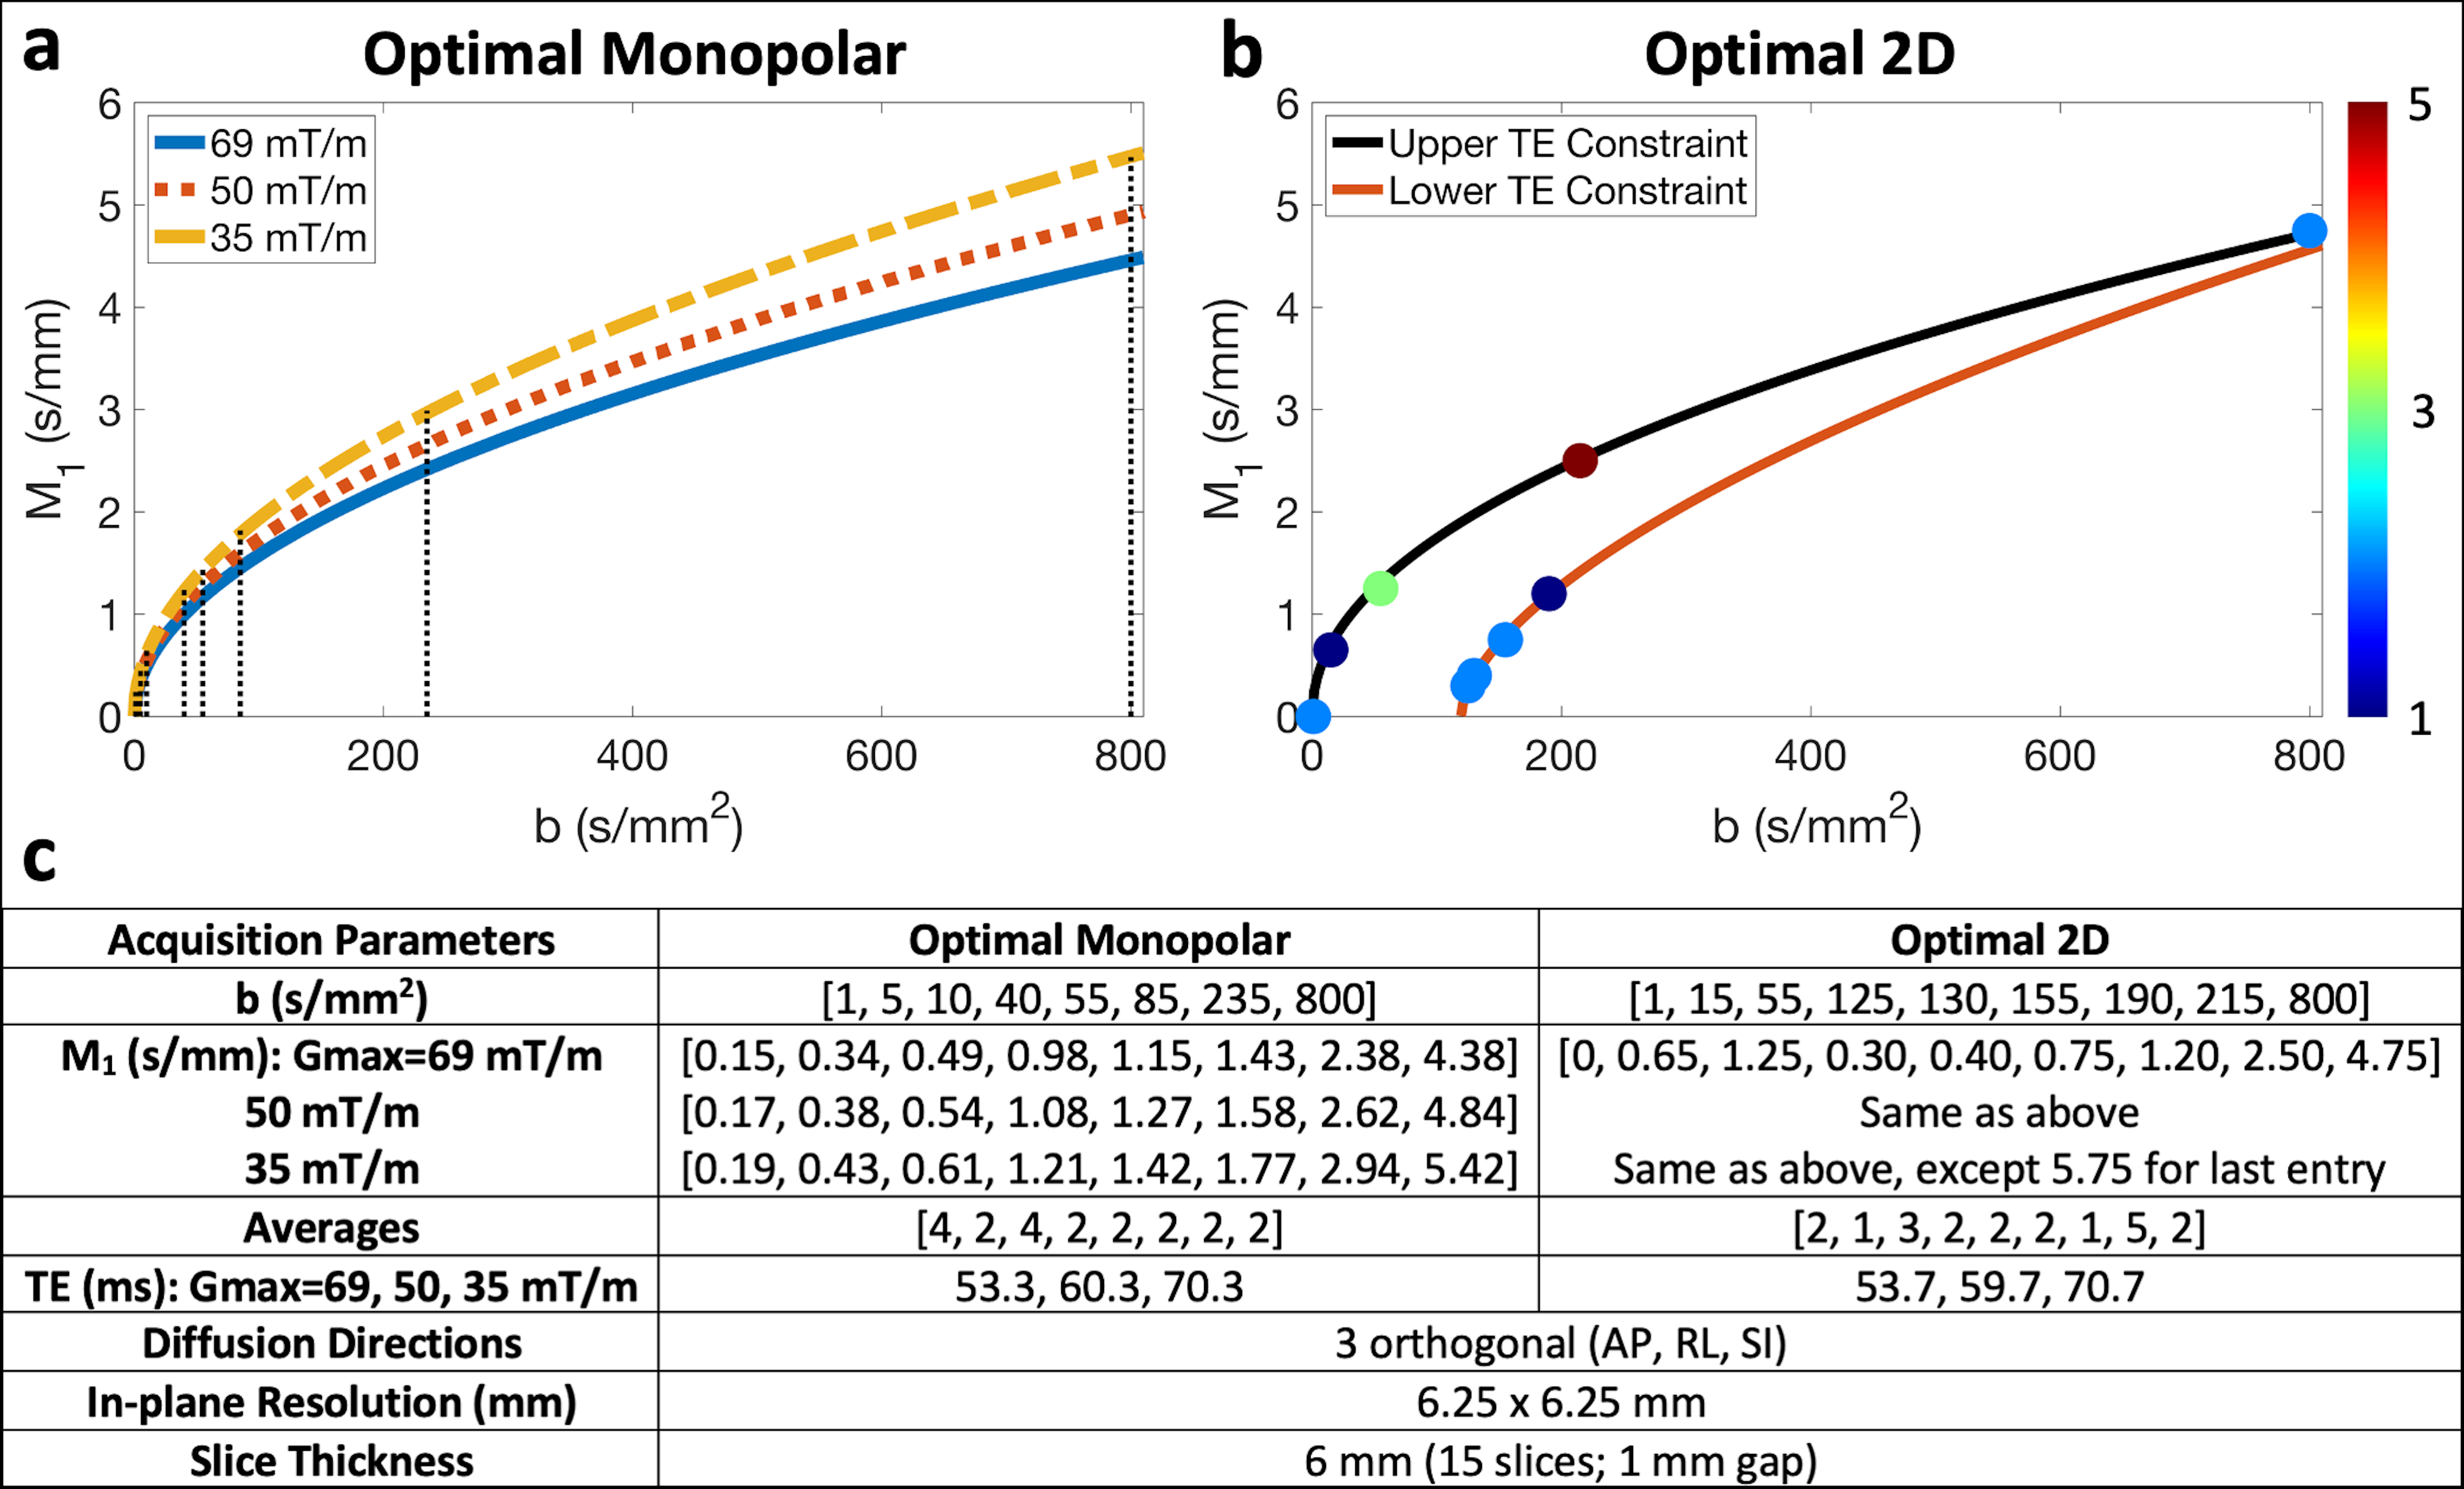
Computational methods: Cramer-Rao lower bound (CRLB) optimization was performed to determine optimal monopolar and optimal 2D (b-M1) IVIM-DWI 20-point data samplings15 (i.e., points in the b-M1-space that can be realized using specifically-designed diffusion gradient waveforms) based on the physical signal model16$$S(b,M_1)=S_0[(1-F)e^{-bD}+Fe^{-bD_b}e^{-M_1^2V_b^2/2}]\qquad Eq.[1]$$
(D: diffusion coefficient, Vb: blood velocity standard deviation, Db=1.75x10⁻³ mm2/s: diffusivity of blood) and SNR=10. To emulate different MR gradient hardware, diffusion gradient waveforms were designed for each sampling three times using Gmax = 35, 50, and 69 mT/m, while keeping other hardware and pulse sequence timing constraints constant.
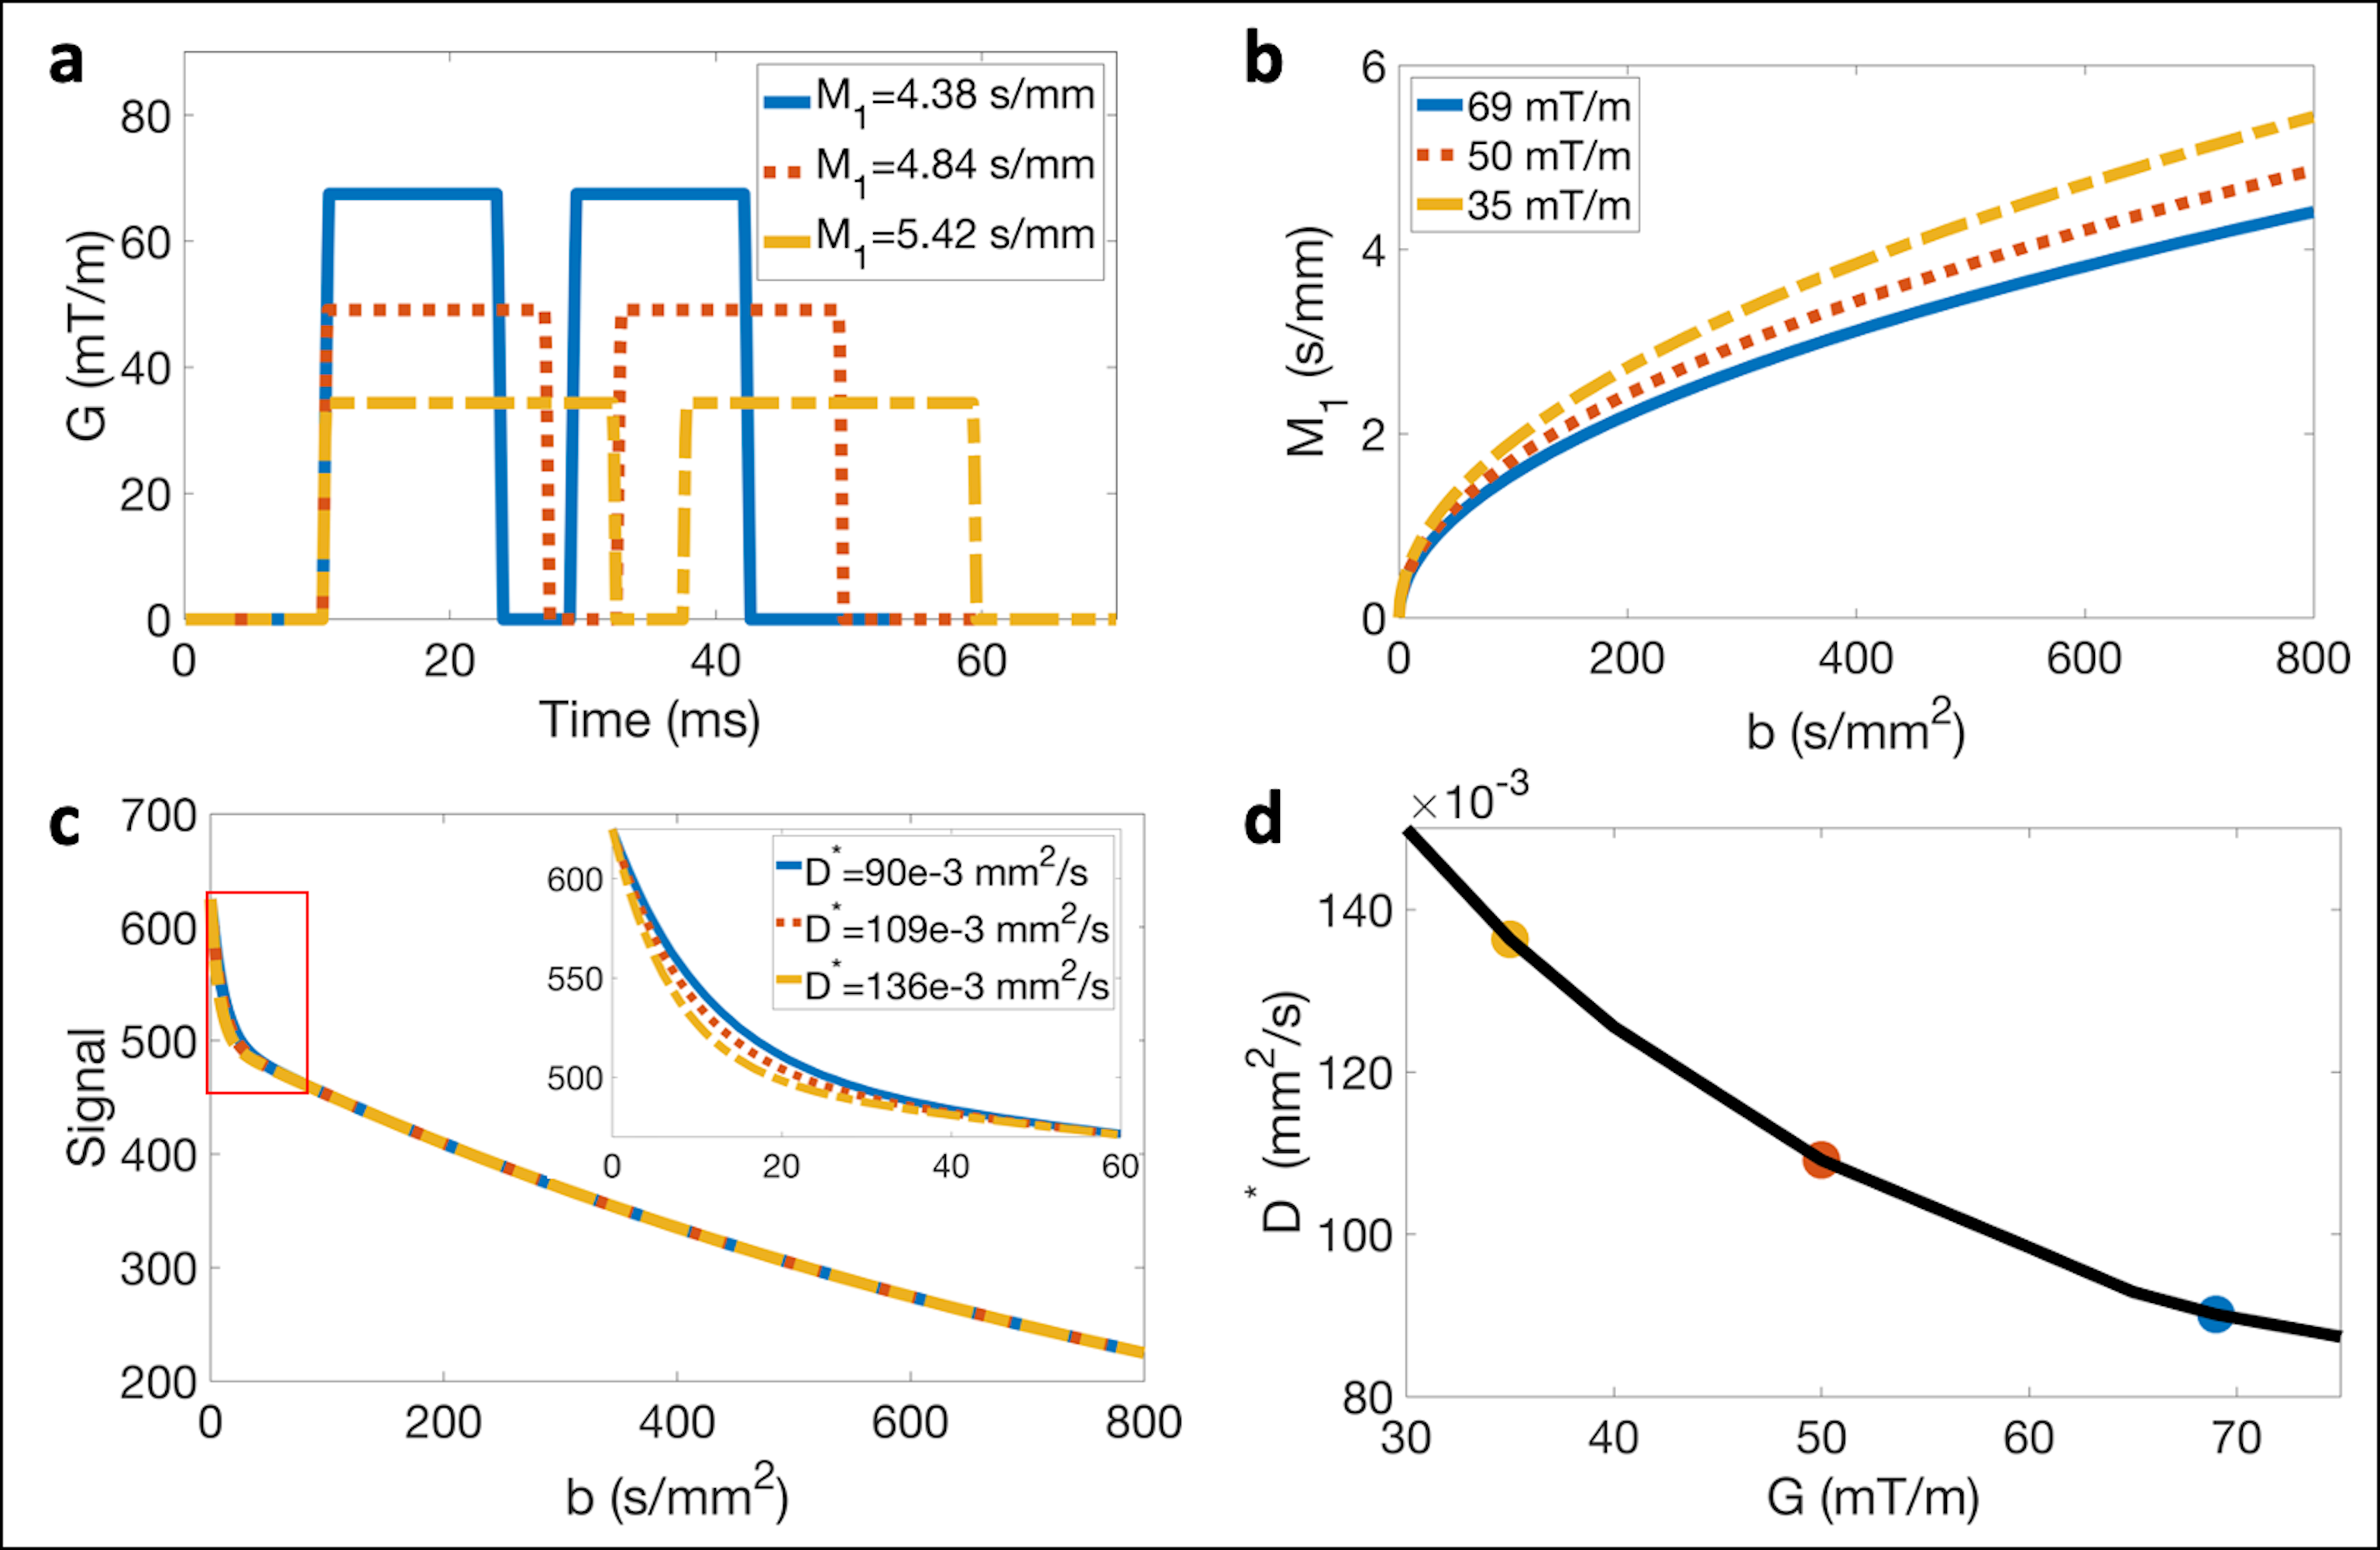
Simulations to evaluate the theoretical dependence of D* on Gmax for monopolar waveforms were performed by simulating physical IVIM signals using Eq. [1] and fixed values of S0, D, F, and Vb. Then, the simulated signals were fit to the traditional pseudo-diffusion signal model18
$$S(b)=S_0[(1-F)e^{-bD}+Fe^{-bD^*}]\qquad Eq.[2]$$
to obtain estimates of S0, D, F, and D*.
MR acquisition: With IRB approval and informed consent, six (n=6) volunteers underwent liver MR exams (3T Signa Premier, GE Healthcare). The determined optimal monopolar and optimal 2D IVIM samplings (Figure 1a,b) were acquired using respiratory triggering and each set of waveforms described above (detailed parameters in Figure 1c).
In vivo data analysis: IVIM estimates (S0, D, F, Vb, and D*) were obtained by performing voxelwise non-linear least squares fitting (Matlab, MathWorks) to Eqs. [1] and [2] (only monopolar datasets fit to Eq. [2]). Average measurements were determined within manually segmented ROIs covering all visible portions of the right liver lobe, excluding major vessels.
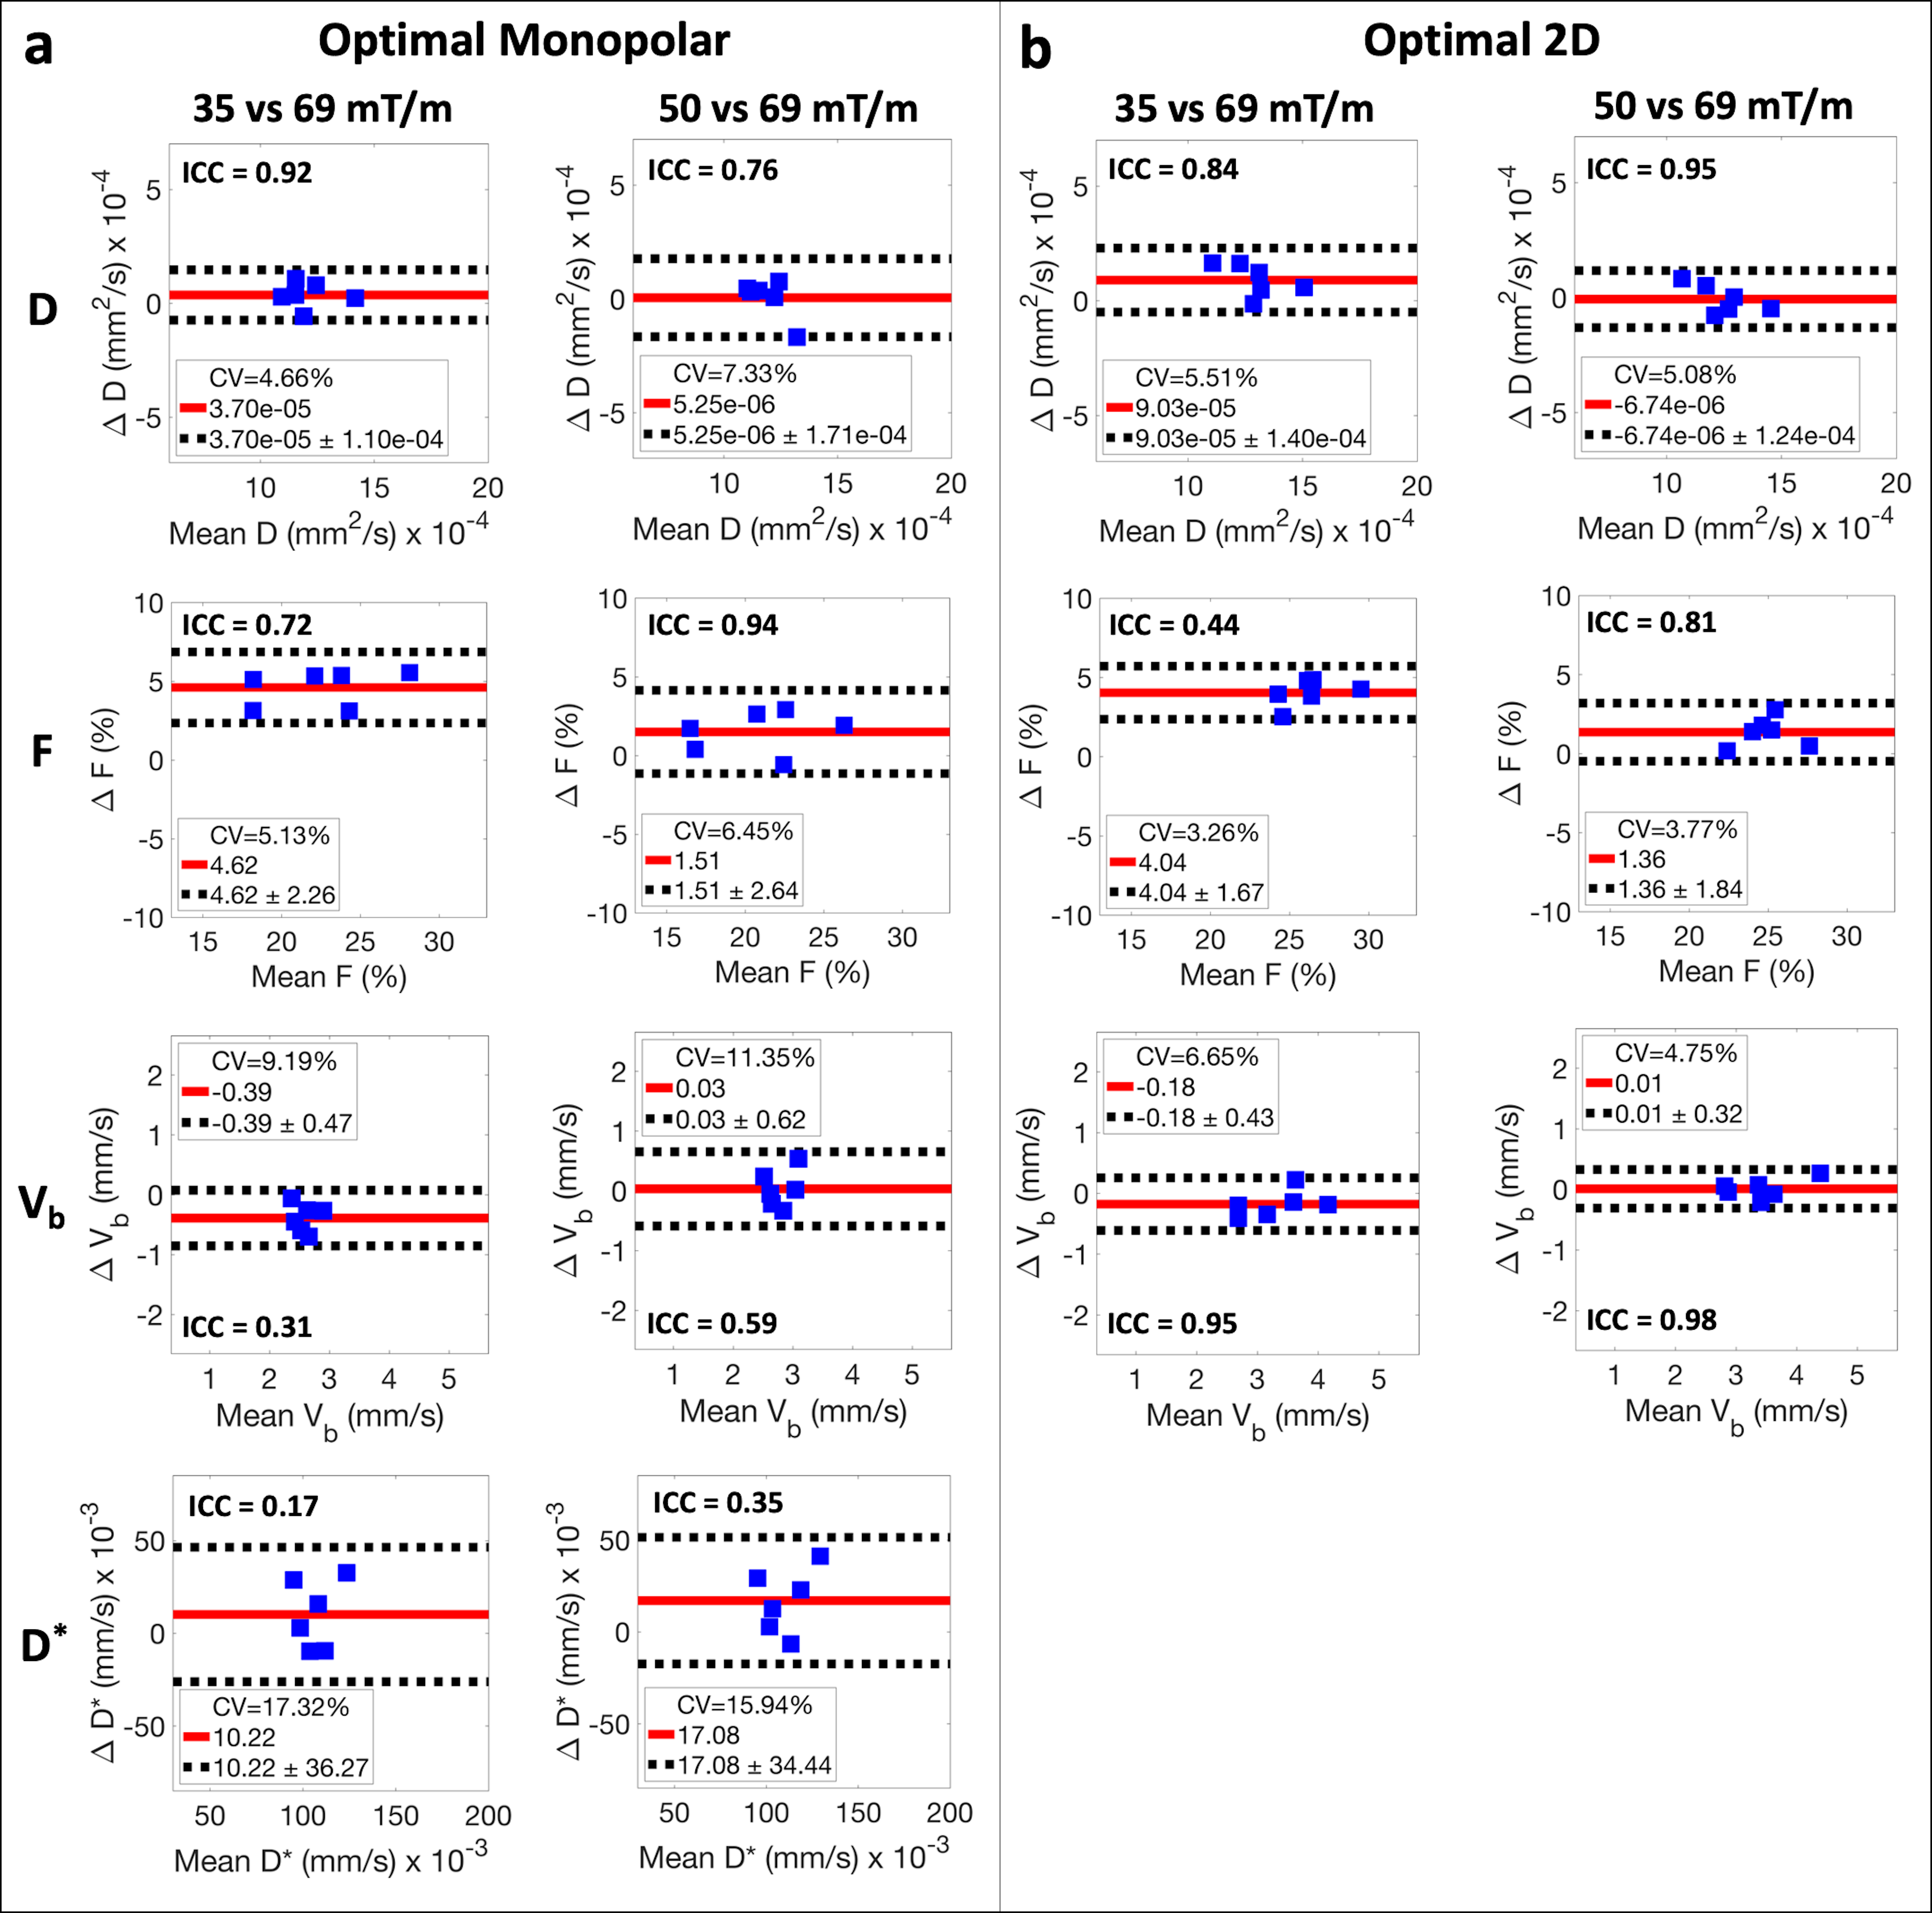
Reproducibility was evaluated by comparing measurements obtained using Gmax = 35 and 50 mT/m waveforms to those using Gmax = 69 mT/m (system limit). Specifically, intraclass correlation coefficients (ICCs) were calculated, and Bland-Altman analysis was performed to determine coefficients of variation (CVs), mean differences, and reproducibility coefficients (RPCs). Paired sample t-tests were also performed (significance level ⍺=0.05).
Results
Simulations illustrated that monopolar waveforms generated using different Gmax follow different trajectories through the b-M1-space (Figure 2a,b). Due to the M1 dependence of the IVIM signal, this leads to dependence of D* estimates on Gmax (i.e., poor reproducibility of monopolar-based D* measurements; Figure 2c,d).In vivo liver experiments confirmed poor reproducibility (ICCs ≤ 0.35) of D* using monopolar waveforms with different Gmax (Figure 3a). Using 2D sampling, good to excellent reproducibility (ICCs ≥ 0.81) was observed for D, F, and Vb, except for F when comparing Gmax = 35 vs 69 mT/m, which demonstrated a large mean difference (4.04%; Figure 3b). Lower CVs, mean differences, and RPCs were also observed for F and Vb using 2D sampling in comparison to monopolar sampling.
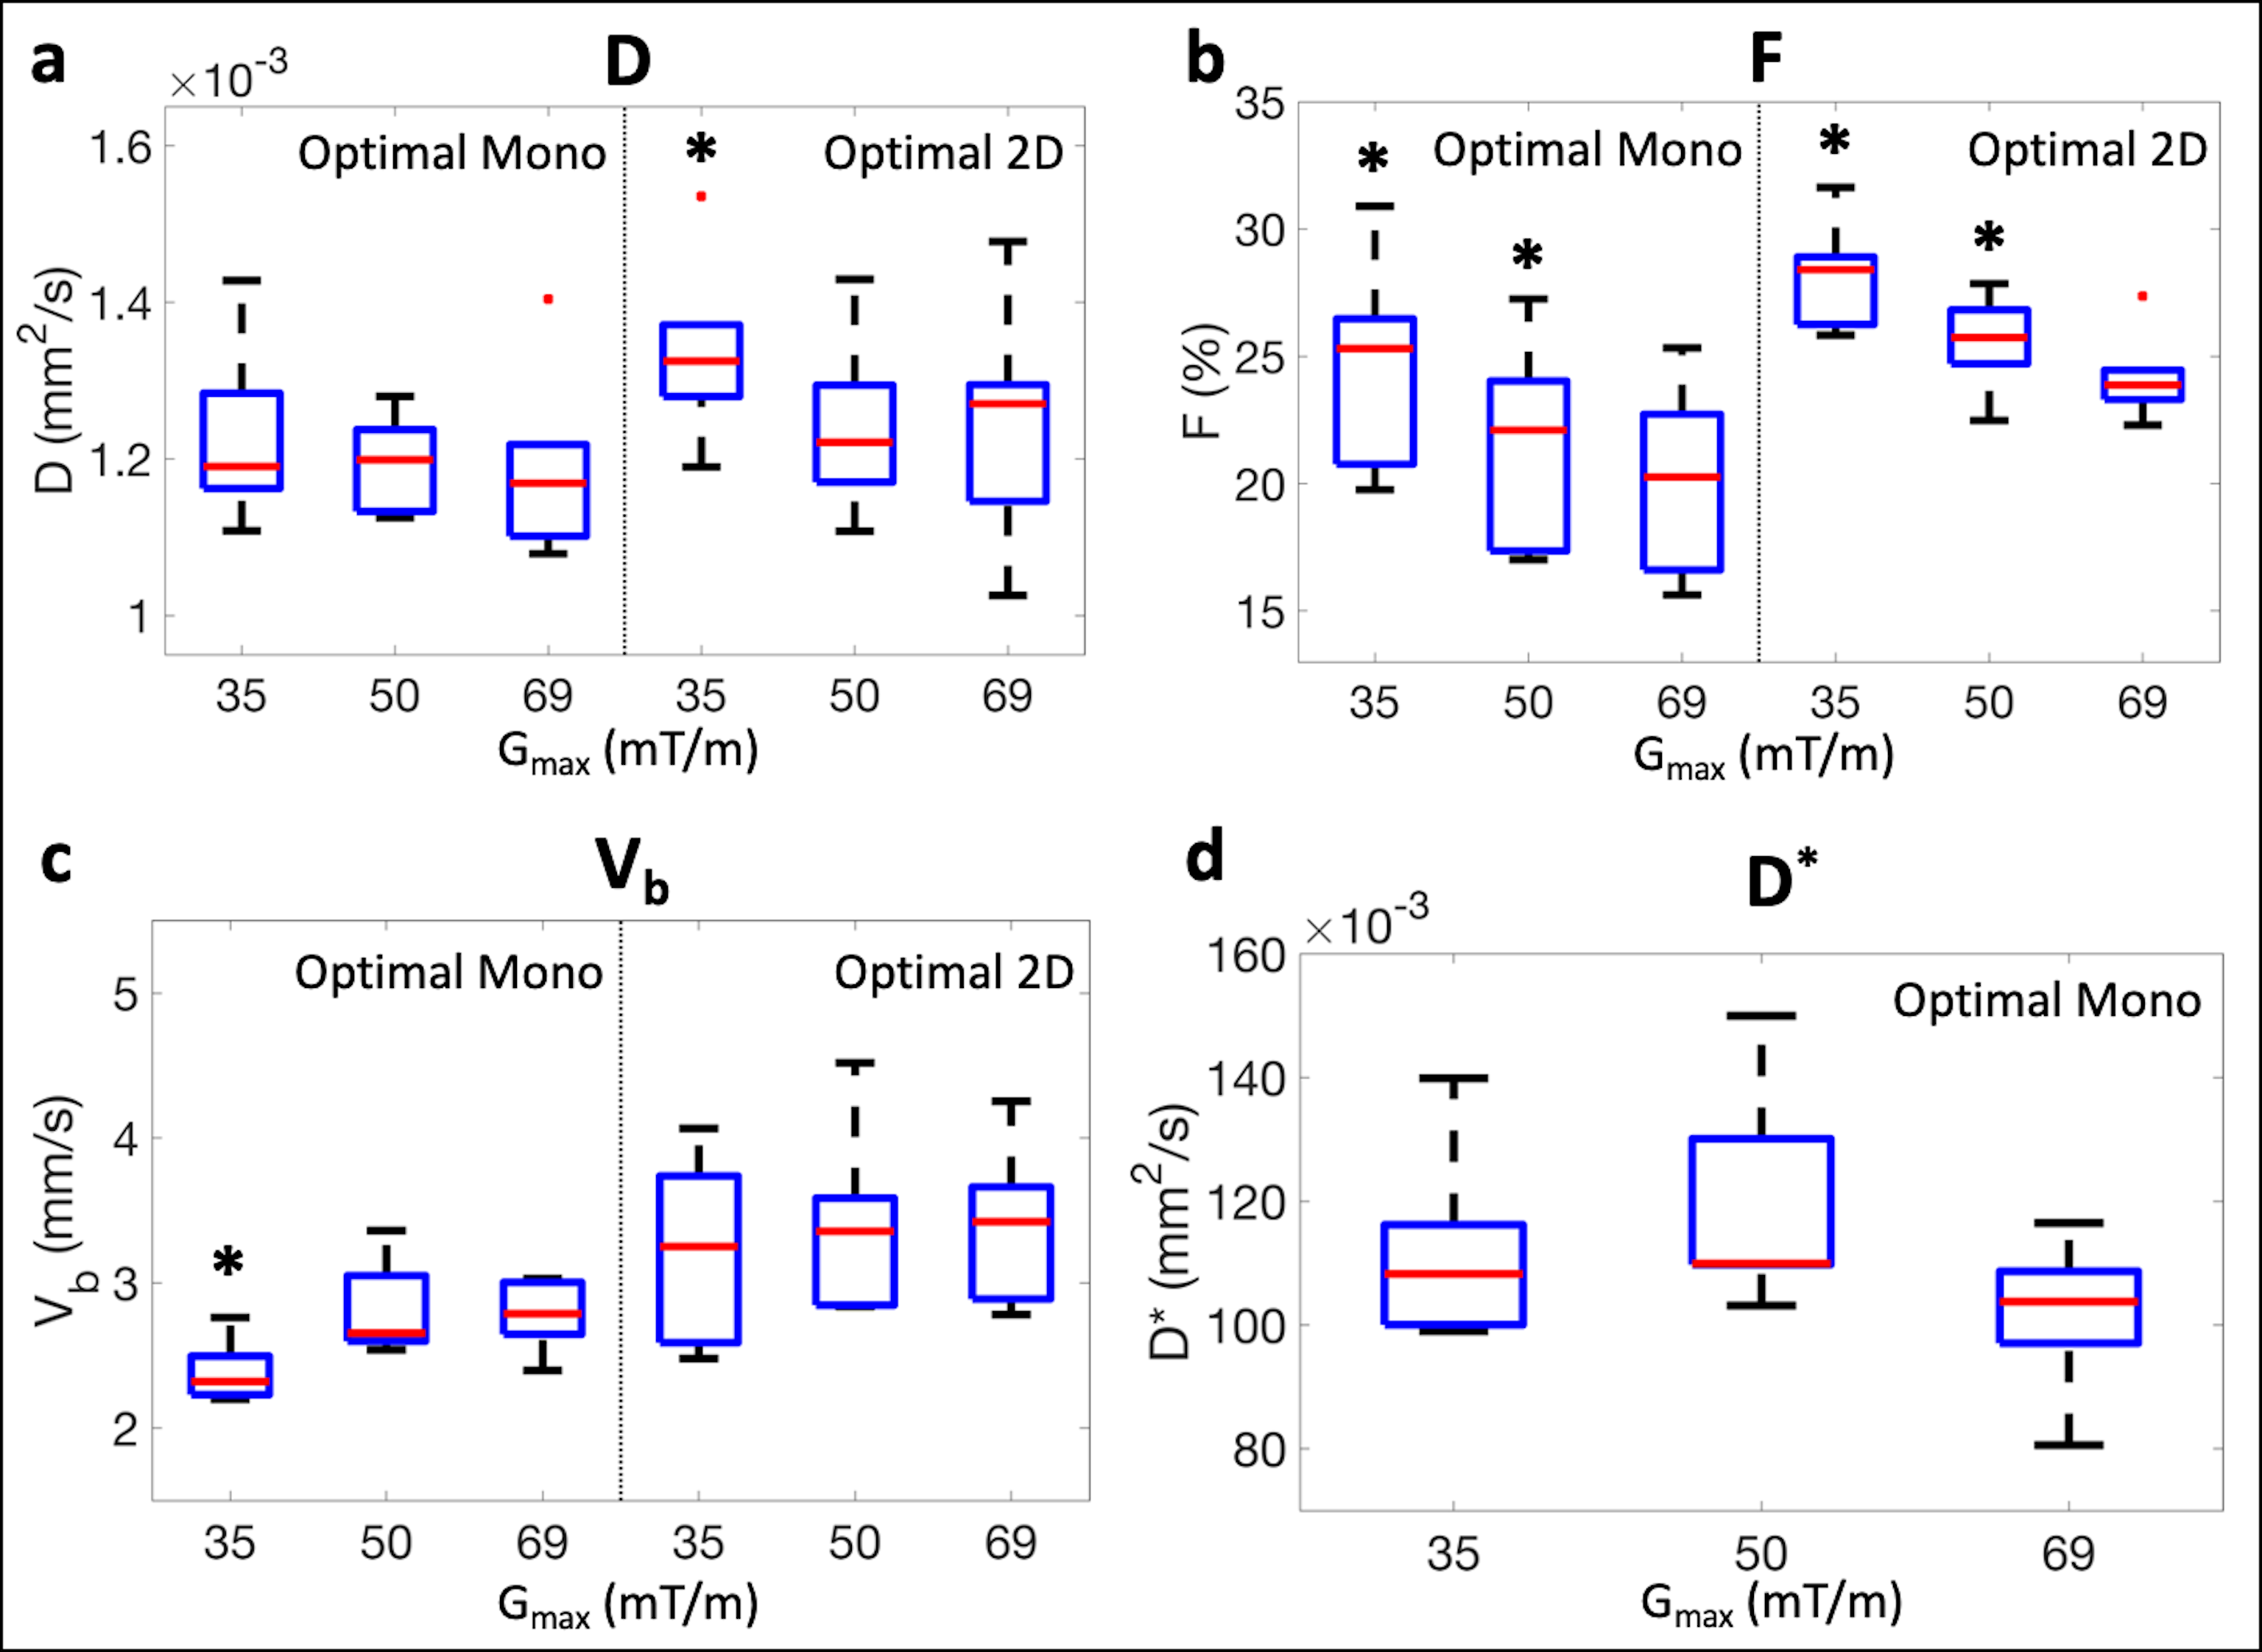
Significantly larger measurements of F were observed for Gmax = 35 and 50 mT/m waveforms in comparison to the Gmax = 69 mT/m waveform using both samplings (Figure 4b). Although not significant, larger measurements were also observed for D* when using monopolar waveforms with lower Gmax (Figure 4d). D and F measurements were nearly identical using both signal models; therefore, only measurements using the physical signal model (Eq. [1]) are displayed in Figures 3 and 4a,b.
Discussion and Conclusion
In this work, reproducible physical IVIM estimates were obtained using 2D IVIM-DWI acquisitions with different diffusion gradient waveforms. In contrast, traditional pseudo-diffusion IVIM using different monopolar waveforms demonstrated poor reproducibility.Vb is a fundamental physical quantity (unlike D*) that can be estimated by accounting for M1 in the IVIM signal model. The observed reproducibility of Vb in this work suggests that Vb may be reproducible across MR gradient hardware. In this work, reproducibility was evaluated in a highly controlled manner, where Gmax was varied (causing additional changes in waveform timing) while other relevant hardware features remained constant (MR system, electronics, coil, software, etc).
Although Vb demonstrated excellent reproducibility, significant differences in F were observed. These differences are likely due to confounding effects of T2 relaxation, including dependence of F (which is a signal fraction and hardware dependent) on echo time.19,20
Limitations of this work include evaluation of reproducibility in a small number of healthy volunteers on a single MR scanner and use of a large voxel size, which may be inadequate for evaluating focal liver diseases.
In conclusion, 2D IVIM acquisitions combined with physical IVIM signal models can enable reproducible liver IVIM estimates across gradient waveforms. This work may advance the establishment of quantitative IVIM biomarkers for liver disease.
Acknowledgements
The authors acknowledge support from the NIH (R01 EB030497), from the University of Wisconsin-Madison Office of the Vice Chancellor for Research and Graduate Education with funding from the Wisconsin Alumni Research Foundation, as well as from the UW Departments of Radiology and Medical Physics. Also, GE Healthcare provides research support to the University of Wisconsin-Madison.References
1. Li YT, Cercueil J-P, Yuan J, Chen W, Loffroy R, Wáng YXJ. Liver intravoxel incoherent motion (IVIM) magnetic resonance imaging: a comprehensive review of published data on normal values and applications for fibrosis and tumor evaluation. Quantitative imaging in medicine and surgery. 2017;7(1):59.
2. Tosun M, Onal T, Uslu H, Alparslan B, Akhan SÇ. Intravoxel incoherent motion imaging for diagnosing and staging the liver fibrosis and inflammation. Abdominal Radiology. 2020;45(1):15-23.
3. Zhang B, Liang L, Dong Y, et al. Intravoxel incoherent motion MR imaging for staging of hepatic fibrosis. PloS one. 2016;11(1):e0147789.
4. Ding L, Xiao L, Lin X, Xiong C, Lin L, Chen S. Intravoxel Incoherent Motion (IVIM) Diffusion-Weighted Imaging (DWI) in Patients with Liver Dysfunction of Chronic Viral Hepatitis: Segmental Heterogeneity and Relationship with Child-Turcotte-Pugh Class at 3 Tesla. Gastroenterology research and practice. 2018;2018.
5. Shin HJ, Yoon H, Kim M-J, et al. Liver intravoxel incoherent motion diffusion-weighted imaging for the assessment of hepatic steatosis and fibrosis in children. World journal of gastroenterology. 2018;24(27):3013.
6. Guiu B, Petit J-M, Capitan V, et al. Intravoxel incoherent motion diffusion-weighted imaging in nonalcoholic fatty liver disease: a 3.0-T MR study. Radiology. 2012;265(1):96-103.
7. Wu H, Liang Y, Jiang X, et al. Meta-analysis of intravoxel incoherent motion magnetic resonance imaging in differentiating focal lesions of the liver. Medicine. 2018;97(34).
8. Peng J, Zheng J, Yang C, et al. Intravoxel incoherent motion diffusion-weighted imaging to differentiate hepatocellular carcinoma from intrahepatic cholangiocarcinoma. Scientific Reports. 2020;10(1):1-7.
9. Zheng J, Gong XQ, Tao YY, et al. A Correlative Study Between IVIM-DWI Parameters and the Expression Levels of Ang-2 and TKT in Hepatocellular Carcinoma. Frontiers in Oncology. 2021;10:2944.
10. Kim JH, Joo I, Kim T-Y, et al. Diffusion-related MRI parameters for assessing early treatment response of liver metastases to cytotoxic therapy in colorectal cancer. American Journal of Roentgenology. 2016;207(3):W26-W32.
11. Öz A, Server S, Sökmen BK, Namal E, Inan N, Balcı NC. Intravoxel Incoherent Motion of Colon Cancer Liver Metastases for the Assessment of Response to Antiangiogenic Treatment: Results from a Pilot Study. Medical Principles and Practice. 2020;29(5):429-435.
12. Andreou A, Koh D, Collins D, et al. Measurement reproducibility of perfusion fraction and pseudodiffusion coefficient derived by intravoxel incoherent motion diffusion-weighted MR imaging in normal liver and metastases. European radiology. 2013;23(2):428-434.
13. Cui Y, Dyvorne H, Besa C, Cooper N, Taouli B. IVIM Diffusion-weighted Imaging of the Liver at 3.0 T: Comparison with 1.5 T. European journal of radiology open. 2015;2:123-128.
14. Dyvorne HA, Galea N, Nevers T, et al. Diffusion-weighted imaging of the liver with multiple b values: effect of diffusion gradient polarity and breathing acquisition on image quality and intravoxel incoherent motion parameters—a pilot study. Radiology. 2013;266(3):920-929.
15. Simchick G, Geng R, Zhang Y, Hernando D. b-M1-Optimized Waveforms for Improved Stability of Quantitative Intravoxel Incoherent Motion DWI. In Proceedings of the 29th Annual Meeting of ISMRM. 2021;Abstract 0402.
16. Ahlgren A, Knutsson L, Wirestam R, et al. Quantification of microcirculatory parameters by joint analysis of flow‐compensated and non‐flow‐compensated intravoxel incoherent motion (IVIM) data. NMR in Biomedicine. 2016;29(5):640-649.
17. Moulin K, Aliotta E, Ennis DB. Effect of flow‐encoding strength on intravoxel incoherent motion in the liver. Magnetic resonance in medicine. 2019;81(3):1521-1533.
18. Le Bihan D, Breton E, Lallemand D, Aubin M, Vignaud J, Laval-Jeantet M. Separation of diffusion and perfusion in intravoxel incoherent motion MR imaging. Radiology. 1988;168(2):497-505.
19. Führes T, Riexinger AJ, Loh M, et al. Echo time dependence of biexponential and triexponential intravoxel incoherent motion parameters in the liver. Magnetic resonance in medicine. 2021.
20. Jerome NP, d’Arcy J, Feiweier T, et al. Extended T2-IVIM model for correction of TE dependence of pseudo-diffusion volume fraction in clinical diffusion-weighted magnetic resonance imaging. Physics in Medicine & Biology. 2016;61(24):N667.
Figures