1692
Volume of hyperintense inflammation (VHI): a deep learning-enabled quantitative imaging biomarker of inflammation load1Centre for Medical Imaging, University College London, London, United Kingdom, 2Department of Imaging, University College London Hospital, London, United Kingdom, 3Rheumatology, University College London Hospital, London, United Kingdom, 4Medical Physics, University College London Hospital, London, United Kingdom, 5Centre for Medical Image Computing, University College London, London, United Kingdom
Synopsis
Short inversion time inversion recovery (STIR) MRI is widely used in clinical practice to identify and quantify inflammation in patients with axial spondyloarthritis. However, assessment of STIR images is limited by the qualitative nature of image interpretation, which depends on observer expertise, and can be biased by the clinical setting. To address this, we propose the volume of hyperintense inflammation (VHI) as a quantitative imaging biomarker of inflammation load, underpinned by a recently-described segmentation method incorporating deep learning and intensity-based segmentation.
Introduction
Short inversion time inversion recovery (STIR) MRI is the workhorse of clinical imaging protocols for numerous inflammatory diseases, and shows areas of inflammation as increased signal. For example, in spondyloarthritis, areas of hyperintense signal in the subchondral bone are referred to as bone marrow oedema (BMO) and form part of the diagnostic criteria in this disease [1]. However, despite the important role that STIR MRI plays in diagnosis and monitoring of inflammation, it is typically interpreted in a purely qualitative fashion. This introduces a source of subjectivity and consequently evaluation of inflammation burden can vary widely depending on reader expertise and the clinical setting. Furthermore, clinical radiological reports are generally purely descriptive without quantitative assessment of inflammation. To address these problems, we propose a quantitative imaging biomarker of inflammation, underpinned by a recently-developed semiautomated segmentation method [2], known as the volume of hyperintense inflammation (VHI). The proposed methodology has been shown to improve interobserver agreement in inflammation assessment [2]. To further validate this approach, we assess the relationship of VHI with visual scoring and the responsiveness of VHI to biologic therapy in a cohort of patients with spondyloarthritis undergoing scans before and after treatment.Methods
Study cohortData were acquired in a prospective longitudinal study conducted at University College London Hospital between April 2018 and July 2019 with the aim of evaluating responsiveness and response prediction using quantitative imaging biomarkers; 28 subjects were included. Patients were diagnosed with axial spondyloarthritis according to ASAS criteria [1] and all underwent pre- and post-biologic therapy MRI scans of SIJs. STIR and T1-weighted turbo spin echo sequences were acquired in an oblique coronal plane (parallel to the sacrum) with the same FOV on a 3T Philips Ingenia scanner. Quantitative MRI sequences were also used but not analysed for the present study. For the STIR acquisition, parameters included: TR 5316ms, TE 50ms, TI 210ms, echo train length 21, slice thickness 3mm, pixel spacing 0.59x0.59mm, image matrix 336x336, number of slices 23-25.
Segmentation methodology and VHI measurement
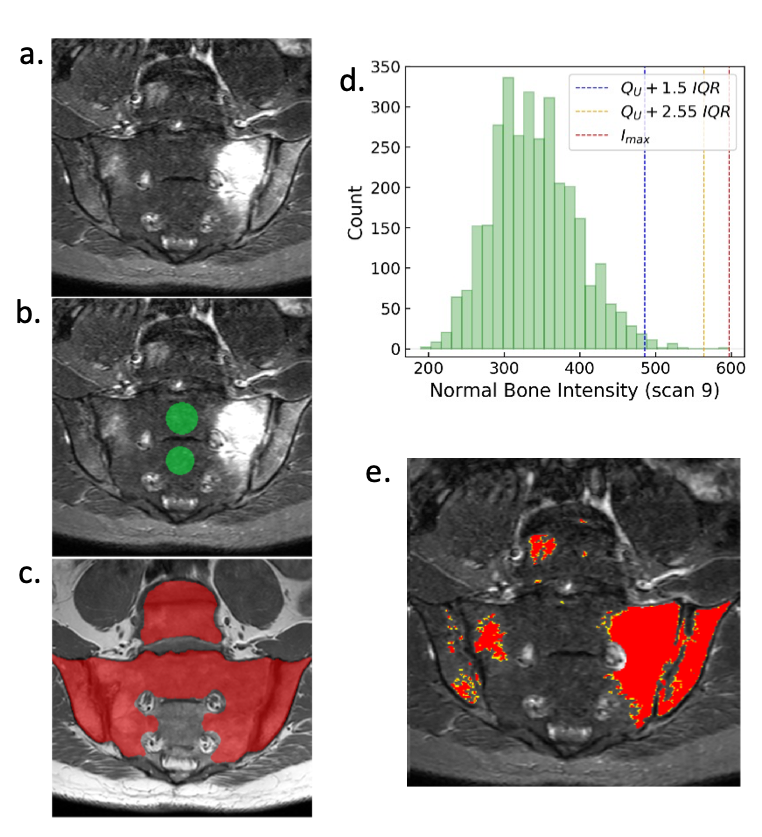
Inflammation was segmented using a recently-described semiautomated procedure, which uses deep learning to segment areas where inflammation could potentially occur and then a thresholding procedure to identify abnormal voxels within this region [1]. Briefly, the procedure is as follows (see Figure 1): (i) areas of ‘normal bone’ and ‘disease’ regions are segmented, the latter using deep learning, (ii) voxels in the ‘disease’ region with outlying intensity with respect to the ‘normal bone’ region are designated as inflamed, (iii) erroneously segmented regions (e.g. vessels within the bone marrow) are removed by a human observer (cleaning was performed by a consultant radiologist with seven years of experience in musculoskeletal MRI). The deep learning-based segmentation of the disease region employs a convolutional neural network with 2D U-net architecture; the training procedure is described in [1]. The resulting cleaned segmentation defines the volume of STIR-hyperintense inflammation (VHI), which is the proposed biomarker of inflammation load.
Evaluation of VHI responsiveness to biologic therapy
Responsiveness (a measure of the sensitivity to change of a biomarker in response to treatment) was defined as the difference in mean change between clinically improved and unimproved groups, normalized by the standard deviation of the change scores in the clinically unimproved groups:
$$Responsiveness = \frac{{\overline{Δ}_{improved}-\overline{Δ}_{unimproved}}}{SD_{change scores(unimproved)}}$$
Clinical improvement was defined as a 50% improvement in the validated BASDAI symptom score. Responsiveness was calculated for and compared between VHI and SPARCC visual scoring.
Results
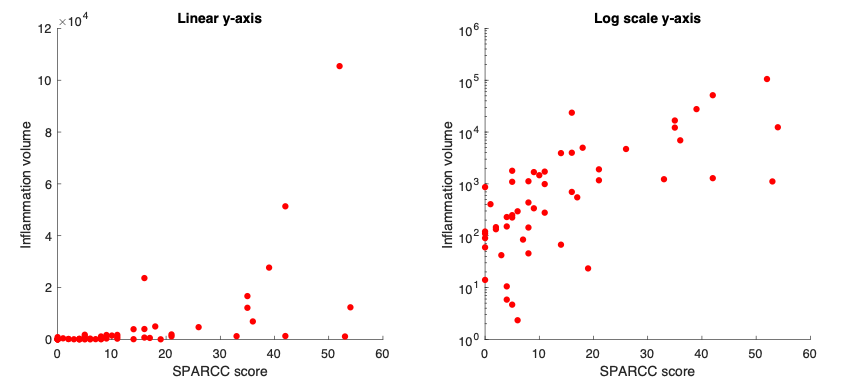
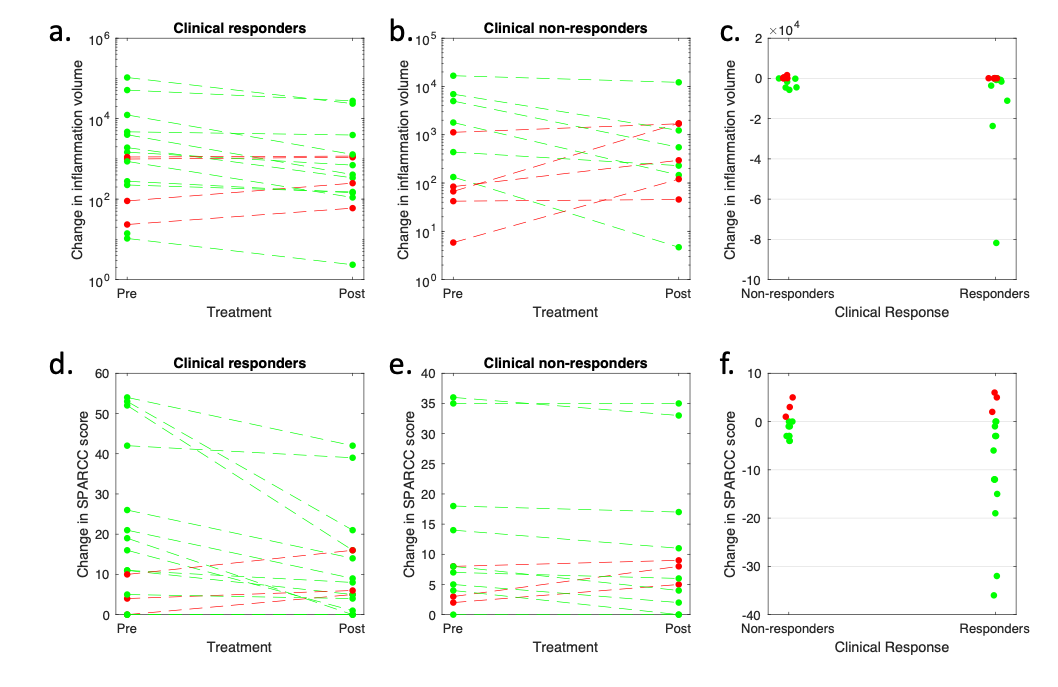
The relationship between VHI and visual scoring is shown in Figure 2. Note that VHI shows a nonlinear relationship with SPARCC scoring, reflecting the fact that SPARCC scoring gives binary scores for each quadrant and therefore effectively ‘plateaus’ at higher inflammation volumes. The relationship becomes approximately linear with logarithmic transformation. Response plots for VHI and for SPARCC scoring, subdivided by clinical response, are shown in Figure 3. Responsiveness was 2.77 for inflammation volume and 2.76 for SPARCC scoring. Of the clinical responders (16/28), 12/16 were also classified as responding by VHI and 13/16 were classified as responding by SPARCC scoring. Of the clinical non-responders (12/28), 5/12 were also classified as non-responding by VHI and 3/12 were classified as non-responding by SPARCC scoring.Discussion
At present, there is no imaging biomarker of inflammation that is used widely in clinical practice, and image interpretation is performed in a qualitative fashion, introducing substantial subjectivity. Here, we propose a quantitative imaging biomarker known as the volume of hyperintense inflammation - VHI – which provides similar information to SPARCC scoring but avoids the need for subjective and laborious visual assessment of image intensity. The biomarker is underpinned by deep learning and intensity-based segmentation [2]. The responsiveness of VHI is similar (and in this cohort slightly superior) to visual scoring and produces similar response classifications to SPARCC scoring. Apart from removal of erroneous regions such as vessels, the proposed segmentation approach does not rely on observer expertise to identify inflammation and therefore promises to improve the consistency, operator dependency and speed of inflammation assessment. Further research could focus on greater automation of the method, including automatic removal of vessels and image artefacts, further reducing the need for manual input.Acknowledgements
Timothy J.P. Bray is supported by an NIHR Clinical Lectureship (CL-2019-18-001). Carolyna Hepburn is supported by Action Medical Research, the Rosetrees Trust and The Stoneygate Trust. Alexis Jones and Margaret A. Hall-Craggs are supported by the National Institute for Health Research (NIHR) Biomedical Research Centre (BRC). This work was undertaken at UCLH/UCL, which receives funding from the UK Department of Health’s NIHR BRC funding scheme. The views expressed in this publication are those of the authors and not necessarily those of the UK Department of Health.References
1. Sieper J, Rudwaleit M, Baraliakos X, et al. The Assessment of SpondyloArthritis international Society (ASAS) handbook: A guide to assess spondyloarthritis. Annals of the Rheumatic Diseases. 2009;68(SUPPL. 2).
2. Hepburn C, Zhang H, Iglesias JE, et al. Towards Deep Learning-assisted Quantification of Inflammation in Spondyloarthritis: Intensity-based Lesion Segmentation. arXiv. 2106(11343).
Figures