1688
Real-time MRI in axial plane allows quantitative evaluation of mandibular condyles motion symmetricity
Karyna Isaieva1, Justine Leclère1,2, Xavier Dubernard2, Jacques Felblinger1,3, and Pierre-André Vuissoz1
1IADI, Université de Lorraine, INSERM, Nancy, France, 2Oral Medicine Department, University Hospital of Reims, Reims, France, 3CIC-IT, CHRU de Nancy, INSERM, Nancy, France
1IADI, Université de Lorraine, INSERM, Nancy, France, 2Oral Medicine Department, University Hospital of Reims, Reims, France, 3CIC-IT, CHRU de Nancy, INSERM, Nancy, France
Synopsis
Current diagnosis of temporomandibular disorders includes clinical examination and MRI; however, static MR images in only two key positions are not sufficient for detection of some cases of temporomandibular disk displacement. We acquired jaw opening and closure movements for 5 healthy volunteers with a real-time MRI in axial plane. The condyles were segmented with a convolutional neural network approach and motion curves of their mass centers were calculated. It was shown that the proposed protocol gives straighforward evaluation of condylar motion assymetry.
Introduction
Temporomandibular disorders (TMD) can be supposed in case of orofacial pain, headache and clicking sounds during the mouth opening and closure and can be caused by multiple reasons such as disk displacement, ligament lesions or infections [1]. Current diagnosis of temporomandibular disorders includes clinical examination and MRI [2]. Various dedicated devices also exist [3, 4], however their utilization imposes long installation and poor comfort, and introduces a bias related to extraoral reference points. MRI is a non-invasive, non-ionizing technology; however, static MR images in only two key positions (closed and open jaw) are not sufficient for detection of some even symptomatic cases of temporomandibular disk displacement. Emerging real-time MRI allows imaging of all intermediate jaw positions in dynamics, and thus could serve as a complement of existing methods for diagnosis of temporomandibular disorders. In current work we present a protocol enabling quantitative evaluation of relative mandible condyles position that enables straightforward detection of motion asymmetry which could be associated with disk displacement or luxation.Methods
The participants were five volunteers with no known temporomandibular disorders. However, since mandibular joint pathologies are quite common and frequently asymptomatic [2], it appeared that one volunteer (S1) presented a clicking sound during jaw motion. The MR images were acquired on a Siemens Prisma 3T. The imaging sequence was a radial RF-spoiled FLASH sequence [5] with TR=2.34 ms, TE=1.47 ms, and slice thickness was 8 mm. Image size was 136×136, and in-plane resolution was 1.41 mm. The plane was chosen to be the axial one that intersects the both condyles. The participants were asked to repetitively open and close the jaws with the maximal possible amplitude. The condyles were delineated as follows: firstly, 20 non-similar images per volunteer were chosen as the closest to centers of 20 k-means clusters based on Euclidean norm in intensity space. The condyles were manually delineated by a researcher. Then, a square region of interest (ROI) of 60 pixels was manually selected for each condyle (the same for the whole series). The left condyle (right on the image) ROIs were flipped in horizontal direction to make it similar to the right one. The resulting ROIs of images and masks were resized to 128 pixels and given as input and output correspondingly to a pre-trained classic U-Net convolutional neural network (16 as training set, 4 as validation set). The network was trained with an Adam optimizer with batch of 8 samples and with automatic early stopping with patience 2. The resulting model was applied for condyles segmentation on the whole series of images. The mass center of each condyle was projected on the axis of symmetry which was supposed to be perpendicular to the line connecting the condyles (in the closed jaw position) centers and intersecting their common mass center. Then, to avoid the noise caused by the automatic segmentation imperfections, the projection curves were filtered with a median filter of width of 1 sec. Then, the difference between left and right condyle was calculated and visually analyzed. To test the quality of the automatic segmentation, each 50-th image from each series was manually delineated by an expert. We have chosen mean square difference (MSD) between the projections calculated from the automatically and manually segmented condyles as the quality metrics.Results
The chosen automatic segmentation was found to be relatively time efficient (approximately 15 minutes per volunteer for all stages from delineation to prediction) and reliable (see Table). Despite at some images the condyles were segmented incorrectly, it was quite rare and thus easily suppressible by median filtering. An example of typical automatic condyle segmentation is shown in Figure 1.It can be seen that in case of asymmetric condylar motion, like in case of S1, steep peaks are present on the extracted difference curve (see Figure 2). They differ from the peaks of other volunteers by their shape and amplitude (see Figure 2 and Table 1).
Discussion
The present work, to best of our knowledge, is the first to use MRI in axial plane for investigation of condylar motion. However, the explored protocol needs to be improved. For the slice selection, sagittal images of only one of two condyles were used. This led to incorrect slice positioning for S4 (see Figure 3). Thus, sagittal images of both condyles should be mandatory used during the slice selection.Not only amplitude, but also position of the peak of the difference curve is important and could probably depend on duration of the disease. Involving of patients and more extensive analysis are needed for further conclusions.
Conclusions
Real-time MRI allows imaging of condyles in dynamics and could serve as a complementary tool for temporomandibular disorders diagnosis. Curve representing difference between the projections of the condyles mass centers on the axis of symmetry could serve as a tool allowing qualitative and quantitative characterization of condylar motion asymmetry; however, an accurate slice selection is required.Acknowledgements
This work was supported by Full3DTalkingHead (ANR-20-CE23-0008) of ANR (Agence Nationale de la Recherche, France); CPER "IT2MP", "LCHN" and FEDER.References
- Learreta, J. A., Matos, J. L., Freire Matos, M., & Durst, A. C. (2009). Current diagnosis of temporomandibular pathologies. CRANIO®, 27(2), 125-133.
- Sommer, O. J., Aigner, F., Rudisch, A., Gruber, H., Fritsch, H., Millesi, W., & Stiskal, M. (2003). Cross-sectional and functional imaging of the temporomandibular joint: radiology, pathology, and basic biomechanics of the jaw. Radiographics, 23(6), e14-e14.
- Santosa, R. E., Azizi, M., Whittle, T., Wanigaratne, K., & Klineberg, I. J. (2006). The influence of the leaf gauge and anterior jig on jaw muscle electromyography and condylar head displacement: a pilot study. Australian dental journal, 51(1), 33-41.
- Agbaje, J. O., Van de Casteele, E., Salem, A. S., Anumendem, D., Shaheen, E., Sun, Y., & Politis, C. (2017). Assessment of occlusion with the T-Scan system in patients undergoing orthognathic surgery. Scientific reports, 7(1), 1-8.
- Uecker, M., Zhang, S., Voit, D., Karaus, A., Merboldt, K. D., & Frahm, J. (2010). Real‐time MRI at a resolution of 20 ms. NMR in Biomedicine, 23(8), 986-994.
Figures

Figure 1. Typical
example of successful condyles segmentation (red contours are automatically
segmented; the blue contours are manually segmented).
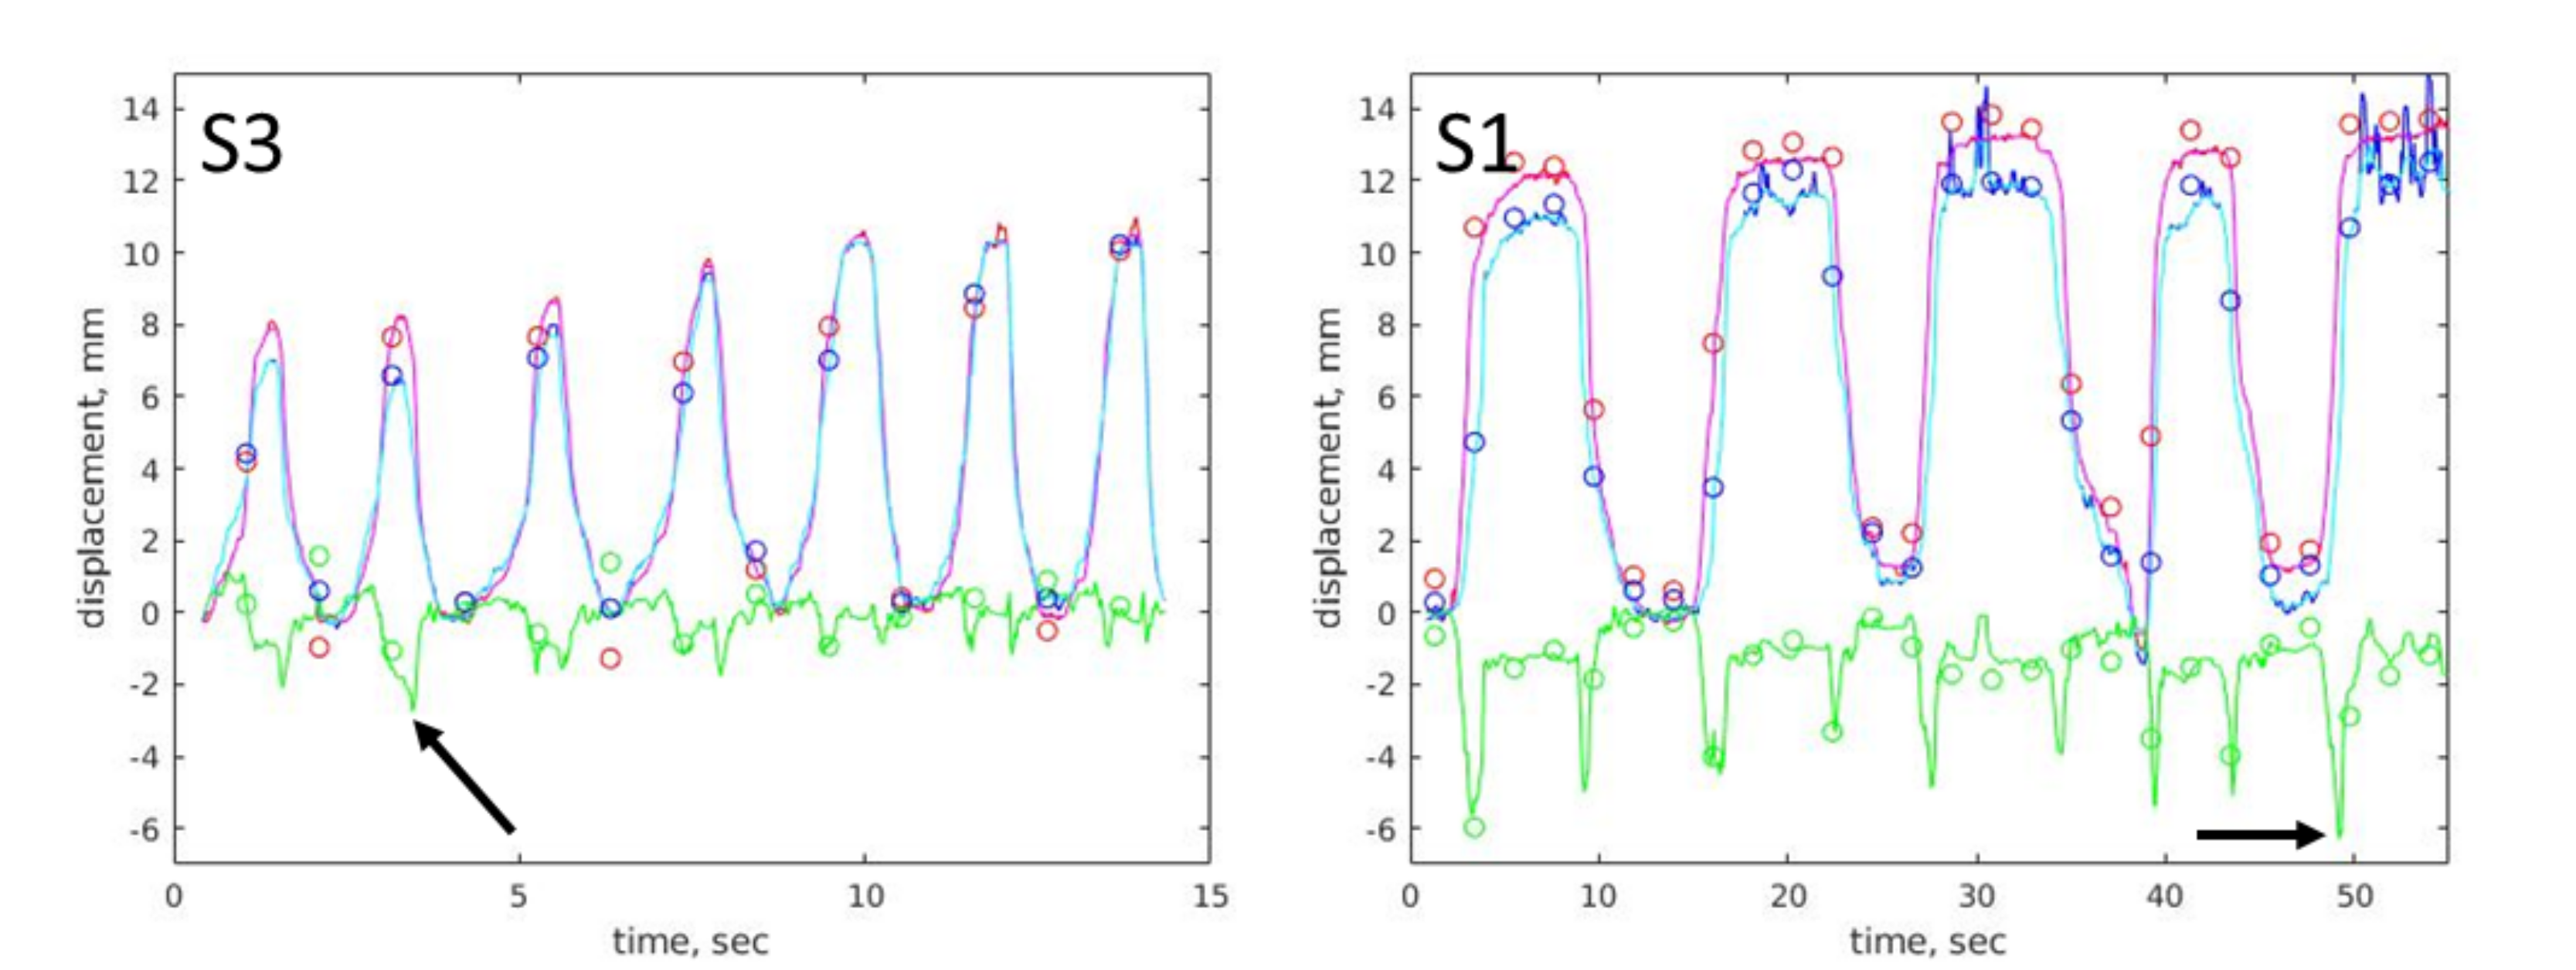
Figure 2.
Projections of condylar mass centres on the axis of symmetry for volunteers S3
and S1. The red curve and the blue curve show the trajectories of right and
left condyle, correspondingly, magenta and cyan curves are their filtered
versions, and the green curve is the difference between the lest and the right
condyle mass centres projections. The circles show the manually obtained
projections. The arrows show positions of maximal peaks.
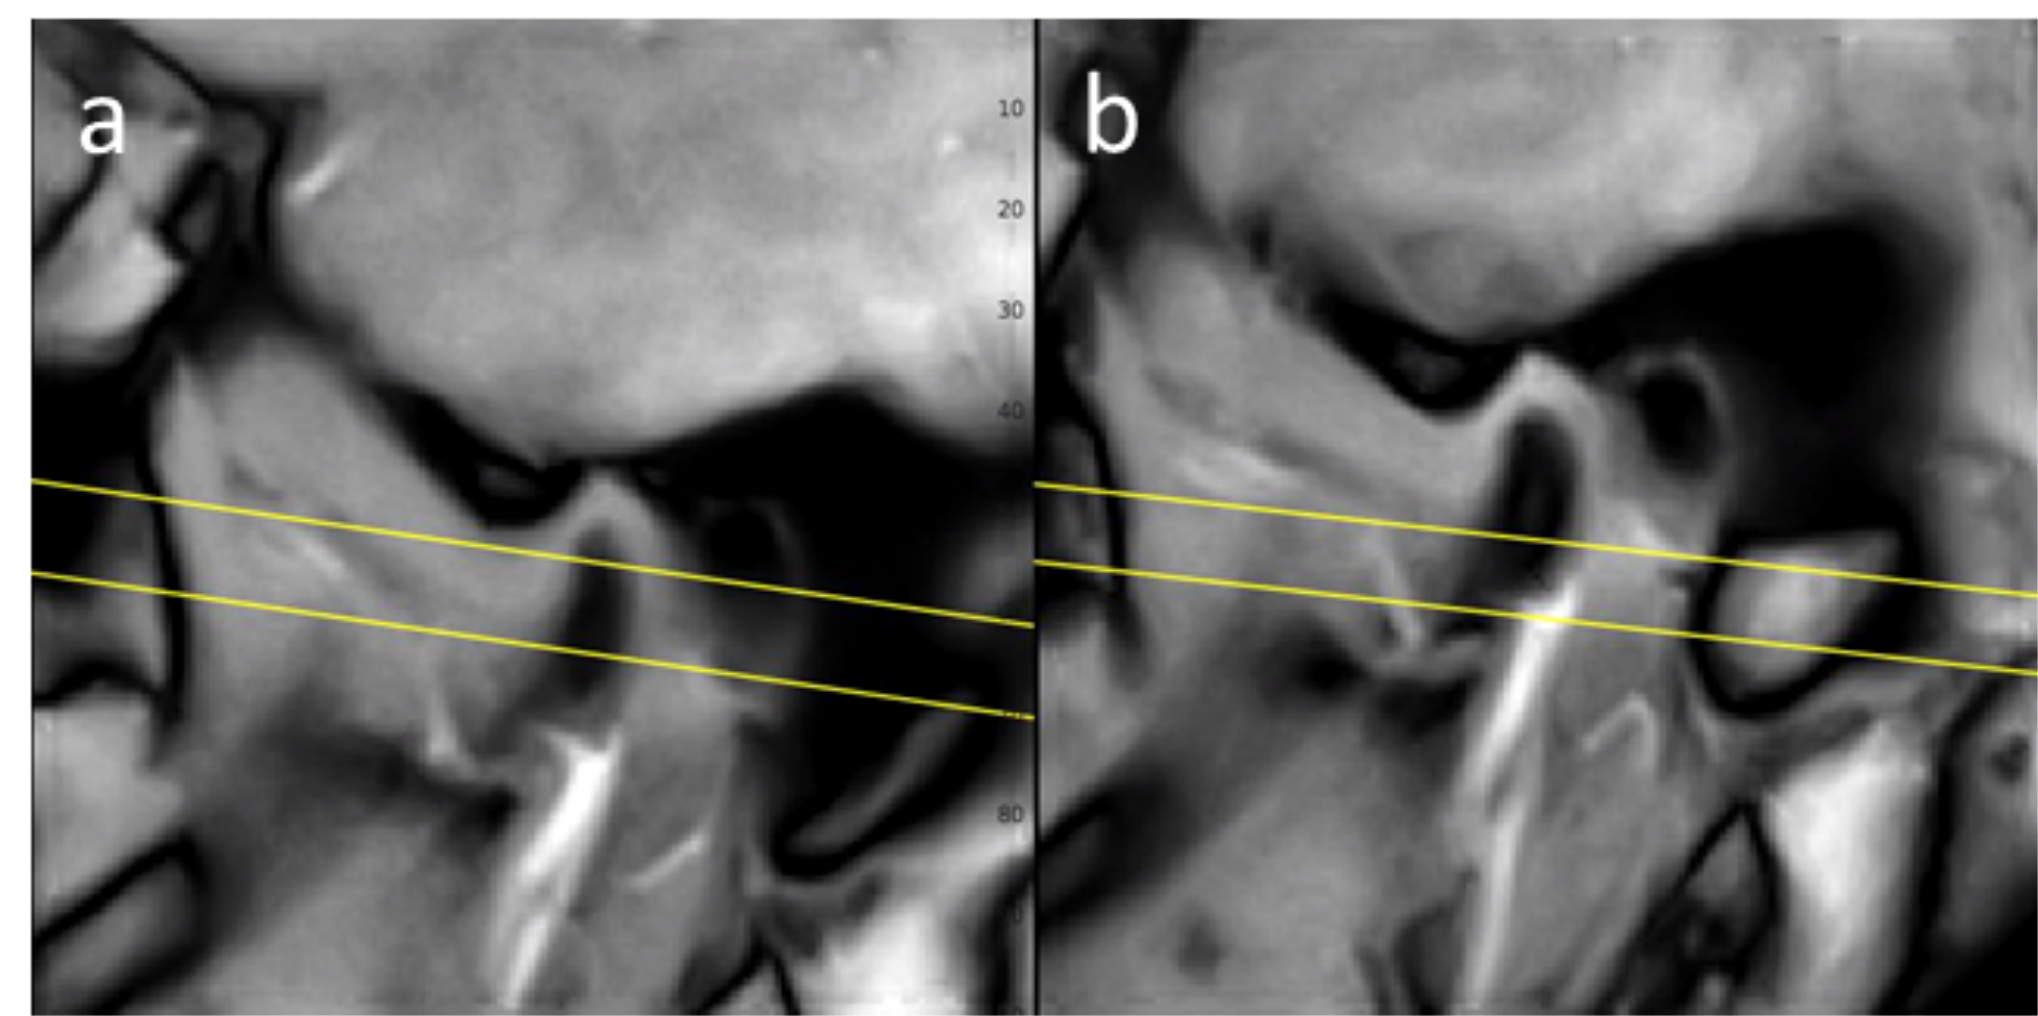
Figure
3. The axial slice position (denoted by the yellow lines) of the volunteer S4
displayed on oblique sagittal slices going through the left (a) and the right
(b) condyle and imaged quasi-simultaneously.

Table 1. Mean square difference between projections of mass centers of automacially and manually segmented condyles, and maximal absolute difference between left and right mass center projections.
DOI: https://doi.org/10.58530/2022/1688