1686
Magic Angle effect in Diffusion Tensor Imaging1Radiology and Imaging Sciences, Indiana University, Indianapolis, IN, United States, 2Stark Neurosciences Research Institute, Indiana University, Indianapolis, IN, United States, 3Radiology Department, Duke University, Durham, NC, United States
Synopsis
Magic Angle Effect (MAE) has been demonstrated to play an important role in both T2 and T1rho relaxation times in articular cartilage, its impact on the DTI measurements is still unknown. In this study we imaged rat knee, rat brain, and human brain at different orientation to explore the magic angle effect.
Purpose
To evaluate the magic angle effect on diffusion tensor imaging (DTI) measurements in ligament, mouse brain, and human brain.Introduction
Magic Angle Effect (MAE) has been demonstrated in knee joint connective tissues including cartilage, ligaments, and tendons (1). The signal intensity, SNR, T2, T2*, and T1ρ values are strongly dependent on the fiber orientation with respect to the main magnetic field (2). To the best of our knowledge, the effect of magic angle on DTI metrics has not been systematically investigated (3,4). In this study, ex vivo diffusion MRI scans were performed on a rat knee and a mouse brain oriented in different directions (0°, 90°, and 180°) by physically rotating the specimens to different orientations respect to the main magnetic field. Diffusion MRI scans were also performed on an in vivo human brain imaged in different head orientations.Methods
Animal experiments were carried out in compliance with the local IACUC Committee. Wild-type C57BL/6 mice (Jackson Laboratory, Bar Harbor, ME) were chosen for brain imaging. Animals were sacrificed and perfusion fixed with a 1:10 mixture of ProHance-buffered (Bracco Diagnostics, Princeton, NJ) formalin to shorten T1 and reduce scan time. Knee joints were harvested shortly after sacrifice from healthy rats. The specimens were scanned at 9.4 T (Oxford 8.9-cm vertical bore) with maximum gradient strength of 2000 mT/m on each axis using a modified 3D Stejskal-Tanner diffusion-weighted (DW) spin-echo pulse sequence (5,6). Scan parameters were as follows: matrix size = 420 × 256 × 256, FOV = 18.9 × 11.52 × 11.52 mm3, TE = 7.6 ms, TR = 100 ms, with a b value of 1000 s/mm2 (for rat knee) and 4000 s/mm2 (for mouse brain). The human brain experiment was performed on a healthy volunteer (24 year old female) on a 3T system (MAGNETOM Prisma, Siemens Healthcare, Erlangen, Germany) with a 64-channel head/neck coil. Diffusion-weighted images were collected using a single-shot echo planar imaging sequence that contained four b0 images and 24 unique diffusion directions with a b-value of 1000 s/mm2. The field of view was 240×240 mm with an imaging matrix of 120×120 and 68 slices with a slice thickness of 2 mm, yielding 2-mm isotropic voxels. The volunteer was asked to rotate the head respect to the B0 axis to three positions (head tilted 30° left; 0°, 20° right). Informed consent was obtained for the human subject. The DTI model was used to calculate the tensor and tractography using DSI studio software (7).Results
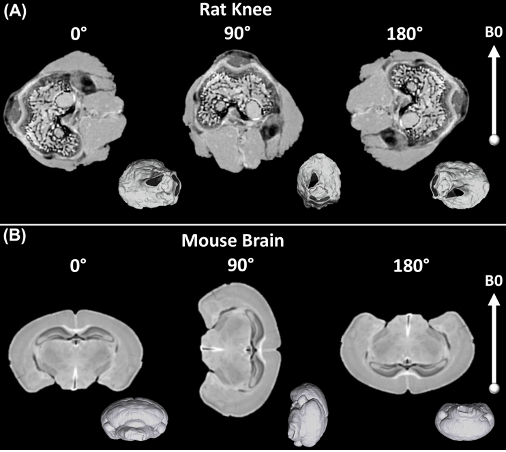
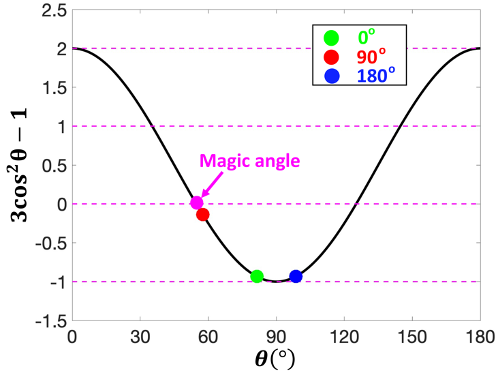
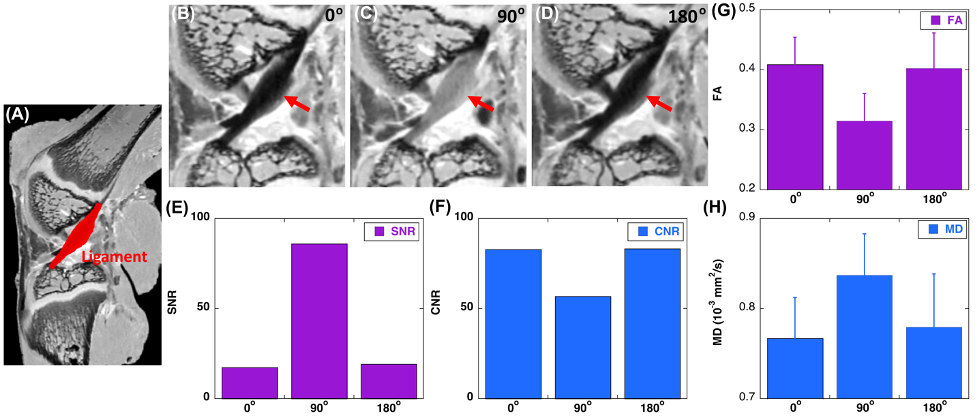
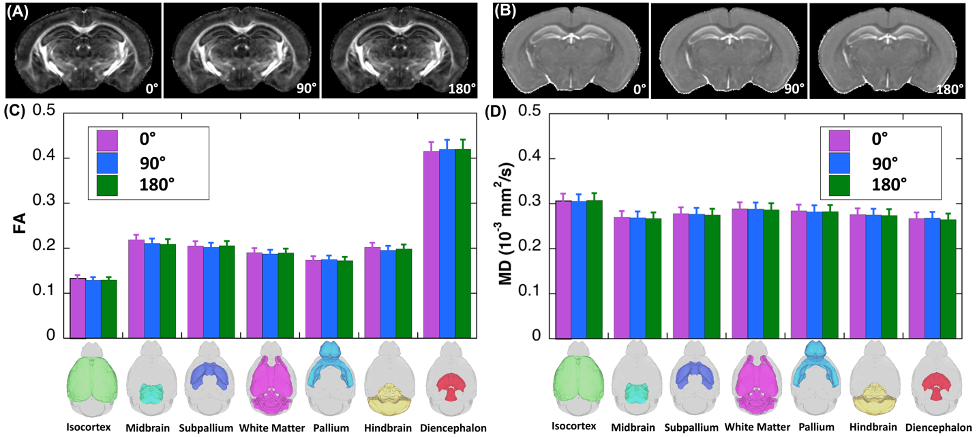
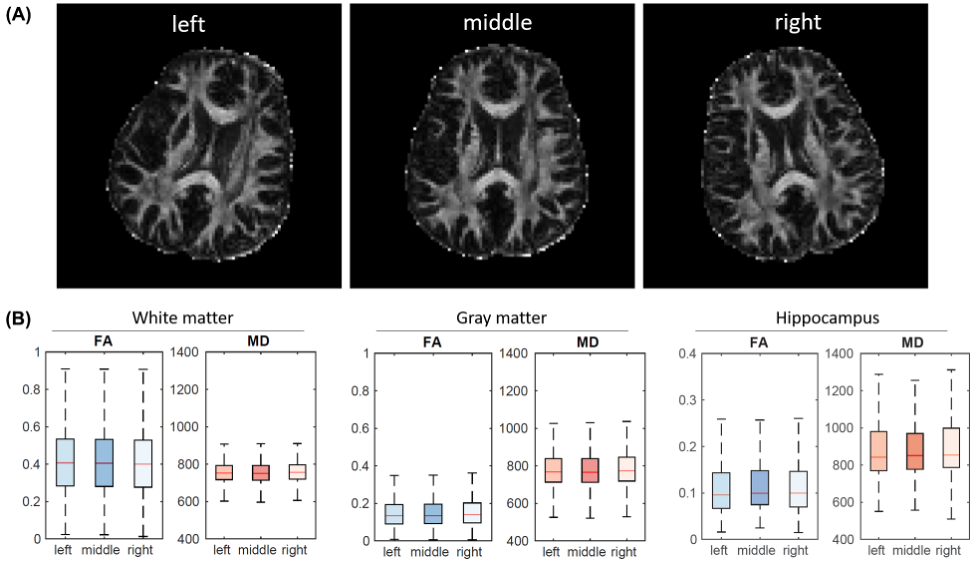
Three specimen orientations (0°, 90°, and 180°, nominal) were used for DTI scans, where the orientation of the brain and knee with respect to the main magnetic field is illustrated in Figure 1. The collagen fiber orientation of ligament at the nominal 90º was close to the magic angle; while collagen fiber orientations at the nominal 0º and 180º were close to 90º (Figure 2). Figure 3 illustrates the b0 image of rat knee ACL (3A), SNR, CNR, FA, and MD values (3E-3H) at different orientations (0°, 90°, 180°, 2B-2D). The ACL demonstrated decreased signal intensity at both 0° and 180° compared to the surrounding tissue, while the intensity elevated dramatically at 90°. The SNR of the ACL at 90° was 86.04, while the SNR were much lower at 0° and 180°, 17.38 and 19.20 respectively. In contrast, the CNR showed the opposite trend, being lowest at 90° with a value of 56.83. The mean FA value at 90° was 0.31 ± 0.04, and the value increased about 32% at 0° to 0.41 ± 0.05. The MD values at 0° was 0.77 ± 0.09, which raised nearly 11% at 90°. Overall, the FA and MD values were comparable at 0° and 180° with less than 3% variation. The FA and MD of mouse brain at different orientations were shown in Figure 4. The mouse brain was divided into seven major parts: isocortex, midbrain, subpallium, white matter, pallium, hindbrain, and diencephalon. The FA and MD maps were visually comparable at different orientations. Both FA and MD values showed negligible variations (less than 5%) among different orientations (0°, 90°, 180°) in all seven parts. In the human brain, DTI maps at different orientations were compared in Figure 5. FA maps did not show any visual differences at different rotations. Boxplots of voxel-wise FA and MD values at different orientations were shown for brain regions including white matter, gray matter, and hippocampus. FA and MD values were found to be independent of brain orientations in all brain regions.Discussion and Conclusion
In summary, we demonstrated there is a strong orientation dependent effect for DTI metrics in ligaments due to the dipolar interaction. To better calculate the FA and MD, the ligament could be deliberately positioned close to the magic angle to increase the signal intensity and SNR. Combining short TE acquisition strategies to reduce the echo time may further improve the SNR and the measurements of DTI parameters.Acknowledgements
This work was supported by NIH/NIBIB P41 EB015897, NIH 5R01AR063071, and Charles E. Putman MD Vision Award of the Department of Radiology, Duke University School of Medicine.References
1. Xia Y et al., Jr. Magic-angle effect in magnetic resonance imaging of articular cartilage - A review. Invest Radiology, 2000;35(10):602-621
2. Du J et al. Magic angle effect in magnetic resonance imaging of the Achilles tendon and enthesis. Magn Reson Imag 2009;27(4):557-564
3. Raya J G et al., Diffusion-tensor imaging of human articular cartilage specimens with early signs of cartilage damage. Radiology 2013;266 (3):831-841
4. Wang N et al., Diffusion tractography of the rat knee at microscopic resolution. Magnetic resonance in medicine 2019;81(6):3775-3786
5. Wang N et al., Compressed sensing in quantitative determination of GAG concentration in cartilage by microscopic MRI. Magn Reson Med, 2018; 79(6):3163-3171
6. Wang N et al., Characterization complex collagen fiber architecture in knee joint using high‐resolution diffusion imaging. Magn. Reson. Med, 2020; 84(2):908-919
7. Yeh FC et al., Generalized q-sampling imaging. IEEE Trans Med Imaging 2010;29(9):1626-1635.
Figures