1685
Variability of ADC Estimates Between-Scanners from Whole Body Imaging is Dominated by Within-Scanner Variance1Department of Medical Physics & Biomedical Engineering, University College London, London, United Kingdom, 2Department of Medical Physics and Biomedical Engineering, University College London Hospitals NHS Foundation Trust, London, United Kingdom, 3Centre for Medical Imaging, University College London, London, United Kingdom, 4Institute of Nuclear Medicine, University College London Hospitals NHS Foundation Trust, London, United Kingdom, 5Centre for Medical Image Computing, University College London, London, United Kingdom, 6King's Technology Evaluation Centre, King’s College London, London, United Kingdom
Synopsis
We investigate the reliability of Whole-Body Imaging ADC estimates from subjects tested and retested within- and between-scanners from different vendors with minimal differences in acquisition protocol and post-acquisition analysis. We show substantial within-subject variation in extracranial ADC estimates within- and between-scanners as measured by Limits of Agreement. We additionally show between-scan variability between scanners is dominated by between-scan variability within a scanner. Furthermore, averaging across subsequent within-scanner examinations does not substantially improve reliability of ADC estimates. We therefore conclude a post-acquisition method for reducing within-scanner variation is required to improve the reliability of ADC estimates.
Introduction
Diffusion-Weighted MRI (DWI) has the potential to be used as a Quantitative Imaging Biomarker (QIB) in oncology, where low ADC correlates with high cellularity associated with tumours1,2. However, there is a lack of data evidencing its reliability (repeatability on the same scanner and reproducibility on different scanners) in whole body imaging (WBI). To be a useful QIB, it should demonstrate reliability in order to be able to determine meaningful changes in its value over time to allow for critical decision-making with respect to treatment/therapy response2.Previous studies have shown that the reliability of ADC measurements is affected by hardware differences, protocol variations, and post processing methods3–6. Michoux et al.7 investigated the within-subject reliability of WBI ADC estimates for 24 healthy volunteers from three centres with the same scanner vendor. For each subject, the test and retest examinations were performed at one of the three centres and a third examination at a different centre. Winfield et al.8 assessed the repeatability of ADC estimates in extracranial DWI across a wide range of imaging protocols and scanners without a test-retest design for between-scanner measurements.
To our knowledge, there are no studies investigating the reliability of WBI ADC estimates from subjects tested and retested within- and between-scanners from different vendors. Quantifying and comparing the within- and between-scanner variance of ADC estimates can inform the most appropriate strategy to improve the reliability of ADC estimates, which may lead to improved treatment decisions in patients.
Method
Study DesignIn this study, 10 healthy volunteers underwent test-retest WBI examinations on two different scanners, allowing for a within-subject measure of both within- and between-scanner variation. The volunteers comprised of 6 women and 4 men, of median (range) age 37 (27, 56) and 33 (26, 43) years, respectively. To limit the biological variation between scans, healthy volunteers were used as the scans should be unaffected by changes in pathology. The protocols used for both scanners are given in Table 1. A literature search was conducted to determine the most appropriate anatomical locations to compare ADC values between scans. We identified the three most common metastasis sites associated with the five most prevalent cancers in the UK, the results of which are shown in Table 2. For healthy adults, the high volume of air in the lungs reduces signal, also the peritoneum has a median thickness smaller than the scanner resolution9. For these reasons, bone, liver, and brain tissue were the focus of our study.
Image Analysis
The ADC maps were calculated from the DW images on a voxel-wise basis using the same mono-exponential fitting algorithm for both scanners. Circular ROIs were placed in bone (cervical vertebrae, T10, L4, S1, and the head of both the right and left femurs), liver (right and left lobes) and brain (right and left thalami) tissue in the axial plane. Care was taken to select a homogeneous signal region without blood vessels or recognisable artefacts. Due to differences in voxel sizes, the volumes of these ROIs were 501 mm3 and 466 mm3 for the Ingenia (ING) and Biograph mMR (mMR) scanners, respectively. The mean ADC for each ROI was compared between scans to determine reliability.
Results and Discussion
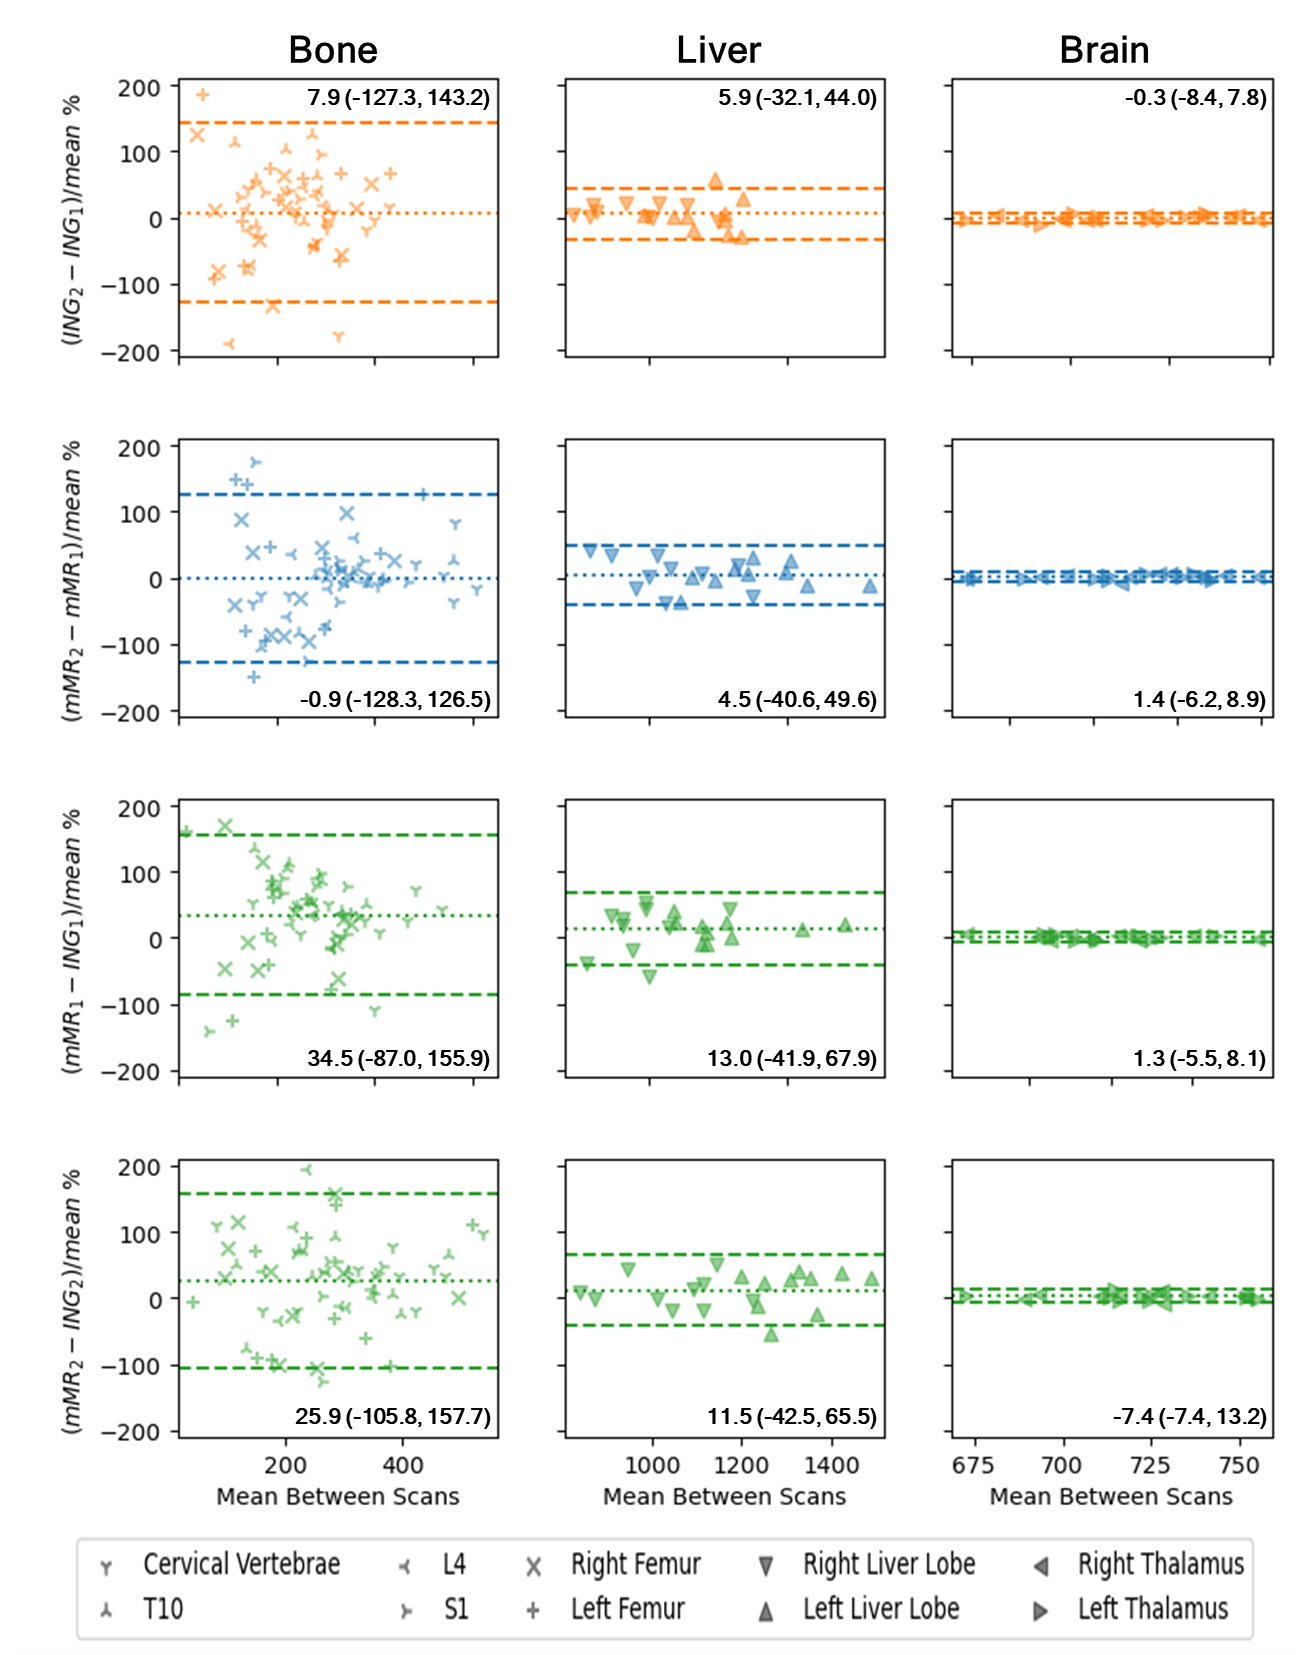
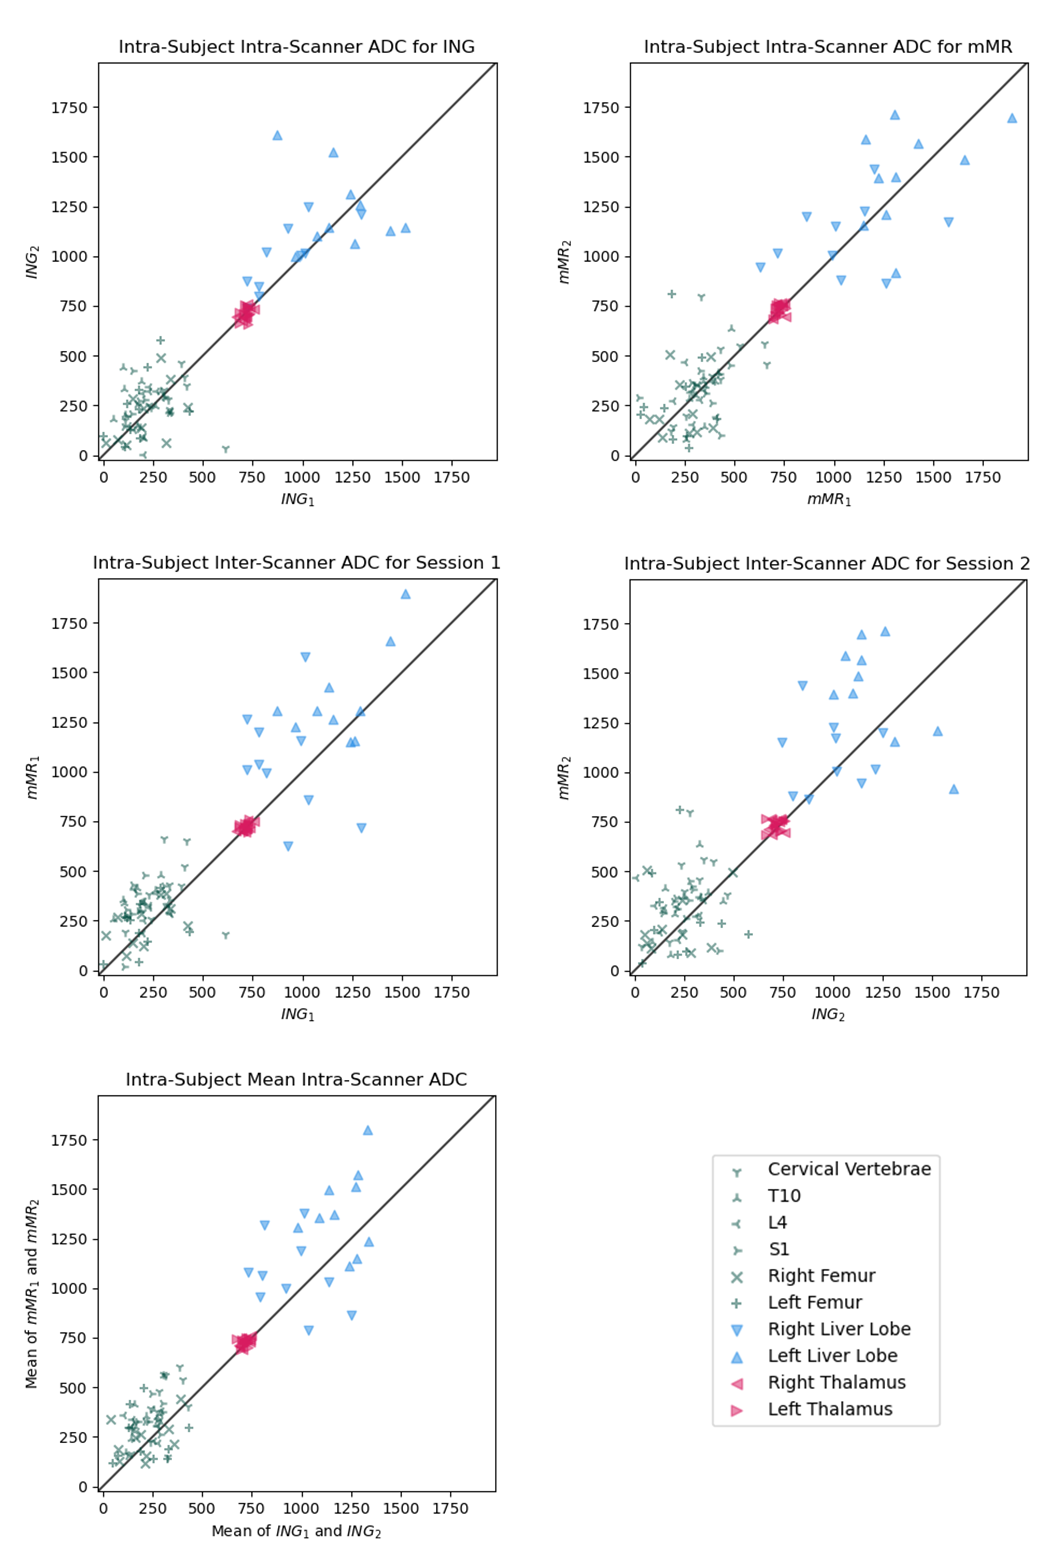
Figure 1 shows Bland-Altman plots for within- and between-scanner agreement grouped by the ROI tissue types (Bone, Liver and Brain). We can observe two key results. First, it can be observed from the 95% Limits of Agreement (LoA) that the within-scanner variability for the two scanners is similar. Second, the LoA show that the between-scanner variability is comparable to the within-scanner variabilities, suggesting that the between-scan variability between scanners is dominated by between-scan variability within a scanner. A paired sample t-test assessed whether the mean bias was statistically significantly different from zero (p < 0.05). For all within-scanner cases, the mean bias was not significantly different from zero. With the exception of mMR1-ING1 in the brain and mMR2-ING2 in the liver, the between-scanner cases did have a mean bias significantly different from zero; however, this can be seen from the plots to be minimal compared to the LoA. Figure 2 shows plots comparing within-subject ADC estimates for test-retest scan pairs, in addition to a comparison of the mean of the test-retest of ING to that of mMR. No improvement to the variability is evident when taking the average of two scans from the same scanner, suggesting doubling an already-lengthy scan is unlikely to improve reliability.Conclusion
There was substantial within-subject variation in extracranial ADC estimates within- and between-scanners as measured by LoA. The similarities in within- and between-scanner LoA suggest that the main source of variance within a given tissue type is between-scan variability within a scanner. Our results suggest that to improve the reliability of ADC estimates, a method to reduce within-scanner variation is required. As no improvement to reliability is observed via averaging across scans within-scanner, and given the consistency of the within-scanner protocol and analysis used in this study, it would seem a post-acquisition method for reducing the remaining variability using machine learning or conventional statistical methods would be most appropriate.Acknowledgements
References
- C, M. & NM, deSouza. Diffusion Weighted Magnetic Resonance Imaging of metastatic bone disease: A biomarker for treatment response monitoring. Cancer Biomark. 6, 21–32 (2010).
- Kalasthry, J. et al. Reproducibility of whole body ADC in a non-optimized multi-centre trial: Effectiveness of normalisation method. in ISMRM 24th Annual Meeting & Exhibition (International Society for Magnetic Resonance in Medicine, 2016).
- M Sasaki, K. Y. Y. W. Variability in absolute apparent diffusion coefficient values across different platforms may be substantial: a multivendor, multi-institutional comparison study. Radiology 249, 624–630 (2008).
- L Fedeli, G. B. A. C. Dependence of apparent diffusion coefficient measurement on diffusion gradient direction and spatial position - a quality assurance intercomparison study of forty-four scanners for quantitative diffusion-weighted imaging. Phys Med 55, 135–141 (2018).
- A Ghosh, T. S. V. S. R. B. N. K. Comparison of absolute apparent diffusion coefficient (ADC) values in ADC maps generated across different postprocessing software: reproducibility in endometrial carcinoma. AJR Am J Roentgenol 209, 1312–1320 (2017).
- MG Zeilinger, M. L. P. B. A. D. M. U. M. D. Impact of post-processing methods on apparent diffusion coefficient values. Eur Radiol 27, 946–955 (2017).
- Michoux, N. F. et al. Repeatability and reproducibility of ADC measurements: a prospective multicenter whole-body-MRI study. Eur. Radiol. 31, 4514–4527 (2021).
- JM, W. et al. Extracranial Soft-Tissue Tumors: Repeatability of Apparent Diffusion Coefficient Estimates from Diffusion-weighted MR Imaging. Radiology 284, 88–99 (2017).
- Schaefer, B. et al. Quantitative Histomorphometry of the Healthy Peritoneum. Sci. Rep. 6, (2016).
- Xiao, W. et al. Breast cancer subtypes and the risk of distant metastasis at initial diagnosis: a population-based study. Cancer Manag. Res. 10, 5329 (2018).
- Bubendorf, L. et al. Metastatic patterns of prostate cancer: an autopsy study of 1,589 patients. Hum. Pathol. 31, 578–583 (2000).
- Liao, Y., Fan, X. & Wang, X. Effects of different metastasis patterns, surgery and other factors on the prognosis of patients with stage IV non-small cell lung cancer: A surveillance, epidemiology, and end results (SEER) linked database analysis. Oncol. Lett. 18, 581–592 (2019).
- Riihimaki, M., Hemminki, A., Sundquist, J. & Hemminki, K. Patterns of metastasis in colon and rectal cancer. Sci. Rep. 6, (2016).
- Patel, J. K., Didolkar, M. S., Pickren, J. W. & Moore, R. H. Metastatic pattern of malignant melanoma: A study of 216 autopsy cases. Am. J. Surg. 135, 807–810 (1978).
- Bartlett, J. W. & Frost, C. Reliability, repeatability and reproducibility: analysis of measurement errors in continuous variables. Ultrasound Obstet. Gynecol. 31, 466–475 (2008).
Figures