1684
Sodium Breast Imaging of Ductal Carcinomas at 3 T1Radiology, University of Cambridge, Cambridge, United Kingdom, 2Cambridge Institute, Cancer Research UK, Cambridge, United Kingdom, 3Biology, University of York, York, United Kingdom, 4York Biomedical Research Institute, University of York, York, United Kingdom, 5Chemistry, University of York, York, United Kingdom, 6GE Healthcare, Munich, Germany
Synopsis
Sodium (23Na)-MRI was performed using a dual-tuned bilateral 23Na/1H breast coil on seven patients with ductal carcinoma, one patient with lobular carcinoma, and ten normal volunteers. Several patients had [23Na] measurements that were 2-3 times higher than the mean normal fibroglandular [23Na] measurements. There were no strong correlations between 23Na-MRI and either DCE or DWI measurements in the patients. These measurements suggest that [23Na] may provide an additional physiological imaging mechanism of breast cancer.
Introduction
Sodium (23Na)-MRI is an emerging technique with evidence that it can differentiate between malignant and benign breast lesions and normal fibroglandular tissue[1]. 23Na-MRI measures of total tissue sodium concentration (TSC) provides information about the physiological/biochemical state of tumors, which is complementary to assessing tissue cellularity with diffusion-weighted imaging (DWI) and vascularity with dynamic contrast-enhanced imaging (DCE-MRI). Furthermore, as changes in sodium concentration are likely to occur before changes in cellularity or vascularity as measured by DWI and DCE-MRI, respectively, 23Na-MRI may provide more immediate information about changes in tumor physiology to assess the effects of therapy[2].Methods
Ten normal volunteers (ages = 24-65 years) and eight breast cancer patients (ages = 42-67 years) were imaged with 23Na-MRI, DWI, and DCE-MRI on a 3 T system (MR750, GE Healthcare, Waukesha, WI). Imaging was performed with informed consent and the approval of the local ethics board.Seven patients had invasive ductal carcinomas, and one had a lobular carcinoma. All patients had small biopsies and were ER+ and HER2-, which tumor type responds well to treatments. Additional patient details are in Table 1.
23Na-MRI protocol: 23Na-MRI was performed using a 3D cones UTE trajectory[3] with TR/TE = 100/0.46 ms, flip angle = 90°, voxel-size = 3x3x6 mm3 for a 36x36 cm2 FOV, number of averages = 4, interleaves = 1402, total scan time = 9 m 21 s. For calibration purposes, two agar phantoms with sodium concentrations 60 and 80 mM were placed in the FOV. Imaging was performed in the prone position with a dual-tuned bilateral 23Na/1H breast array (Rapid Biomedical, Rimpar, Germany; 4 sodium and 16 proton channels).
1H-MRI protocol: DWI was performed using a single-shot echo-planar imaging sequence with TR/TE = 4000/94.2 ms, FOV = 36x36 cm2, voxel size = 2.8x2.8x4 mm3, acceleration factor = 2, averages = 4, b-values = 0, 100, 500, 1000, 1500, 2000, 2500 s/mm2, total scan time = 10 minutes 12 seconds. DCE-MRI was acquired using a 3D fast spoiled gradient echo technique with k-space data sharing[4] with TR/TE = 7.1/3.8 ms, field-of-view = 350 mm, image matrix = 512×512, section thickness = 1.4 mm (interpolated), voxel size = 0.6×0.6×1.4 mm3, flip angle = 12°, array spatial sensitivity encoding factor = 2.5. Five baseline volumes were acquired before contrast injection, followed by 43 contrast-enhanced volumes with a nominal temporal resolution of ~10 s.
Image processing: 23Na images were reconstructed using a re-gridding scheme. Regions-of-interest over the lesions were drawn on the T1w images by a radiologist with over six years of experience. TSC maps were generated based on the calibration fiducial concentration, and assumed that the TR was sufficiently long to avoid T1 saturation. B1 correction was not applied in patient TSC estimations. Apparent diffusion coefficient (ADC) maps were generated using in-house software developed in MATLAB. Quantitative pharmacokinetic (PK) parameters were obtained from the DCE-MRI data with MIStar (Apollo Medical, Melbourne, Australia), using the extended Toft’s model[5] incorporating T1 and B1 corrections.
Results
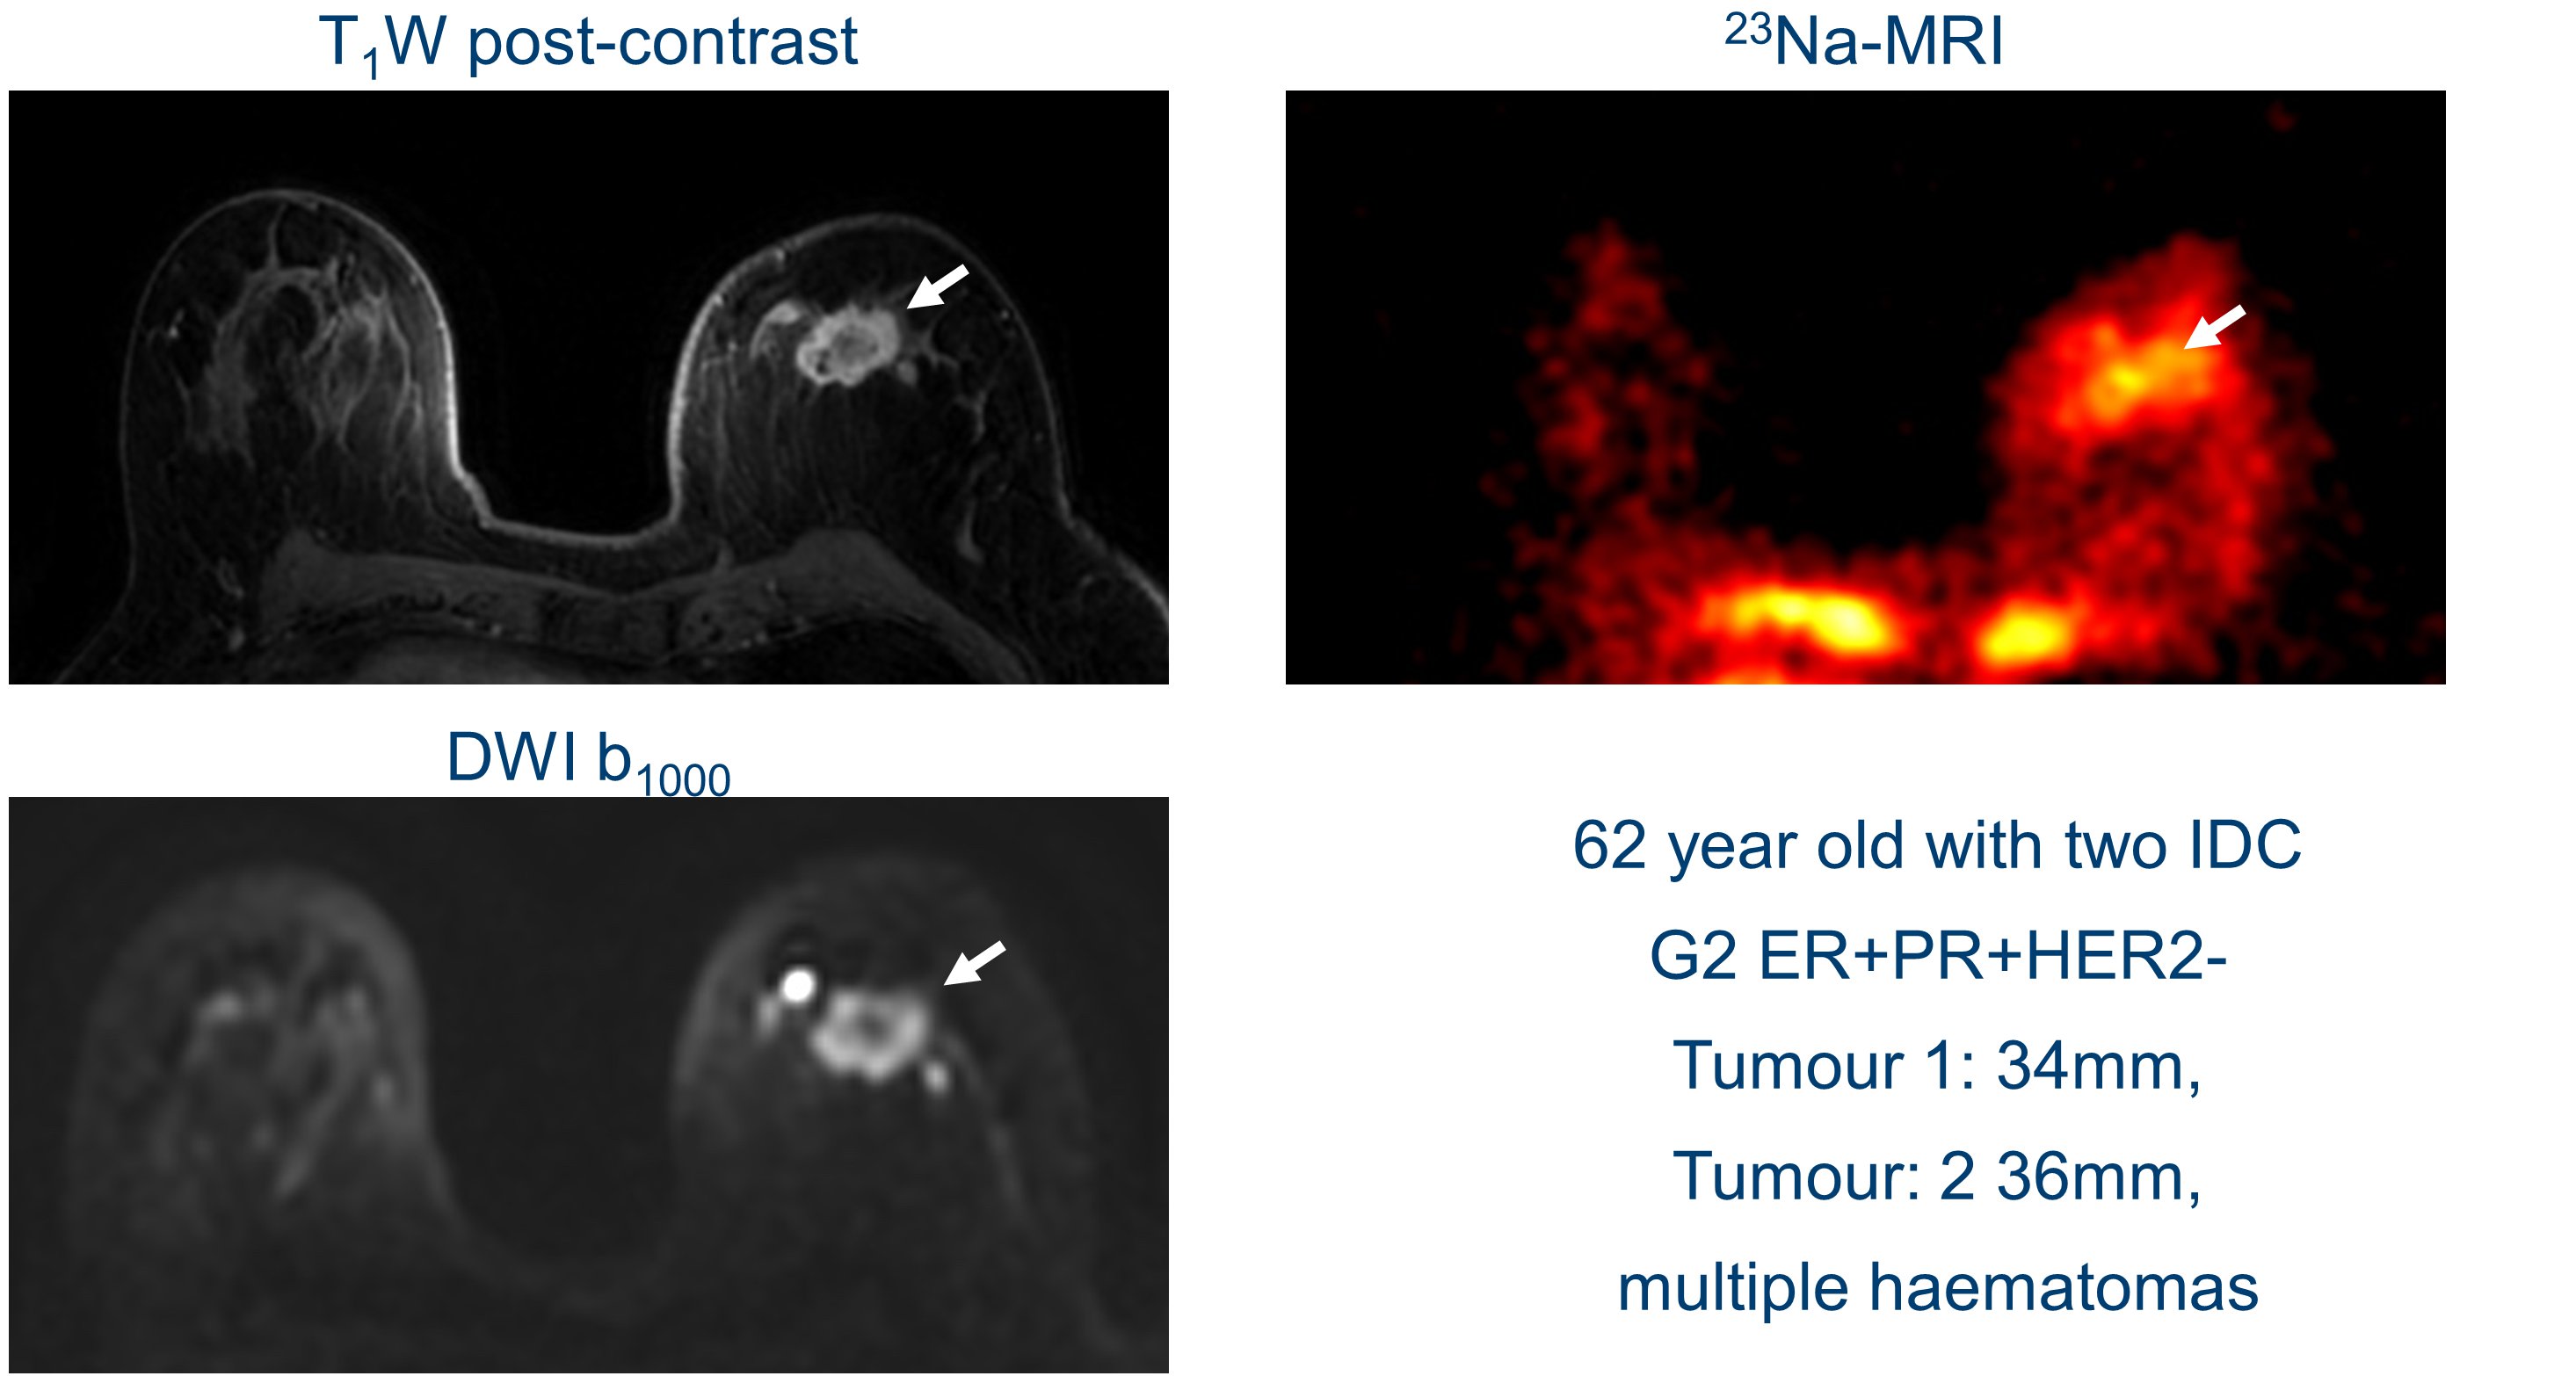
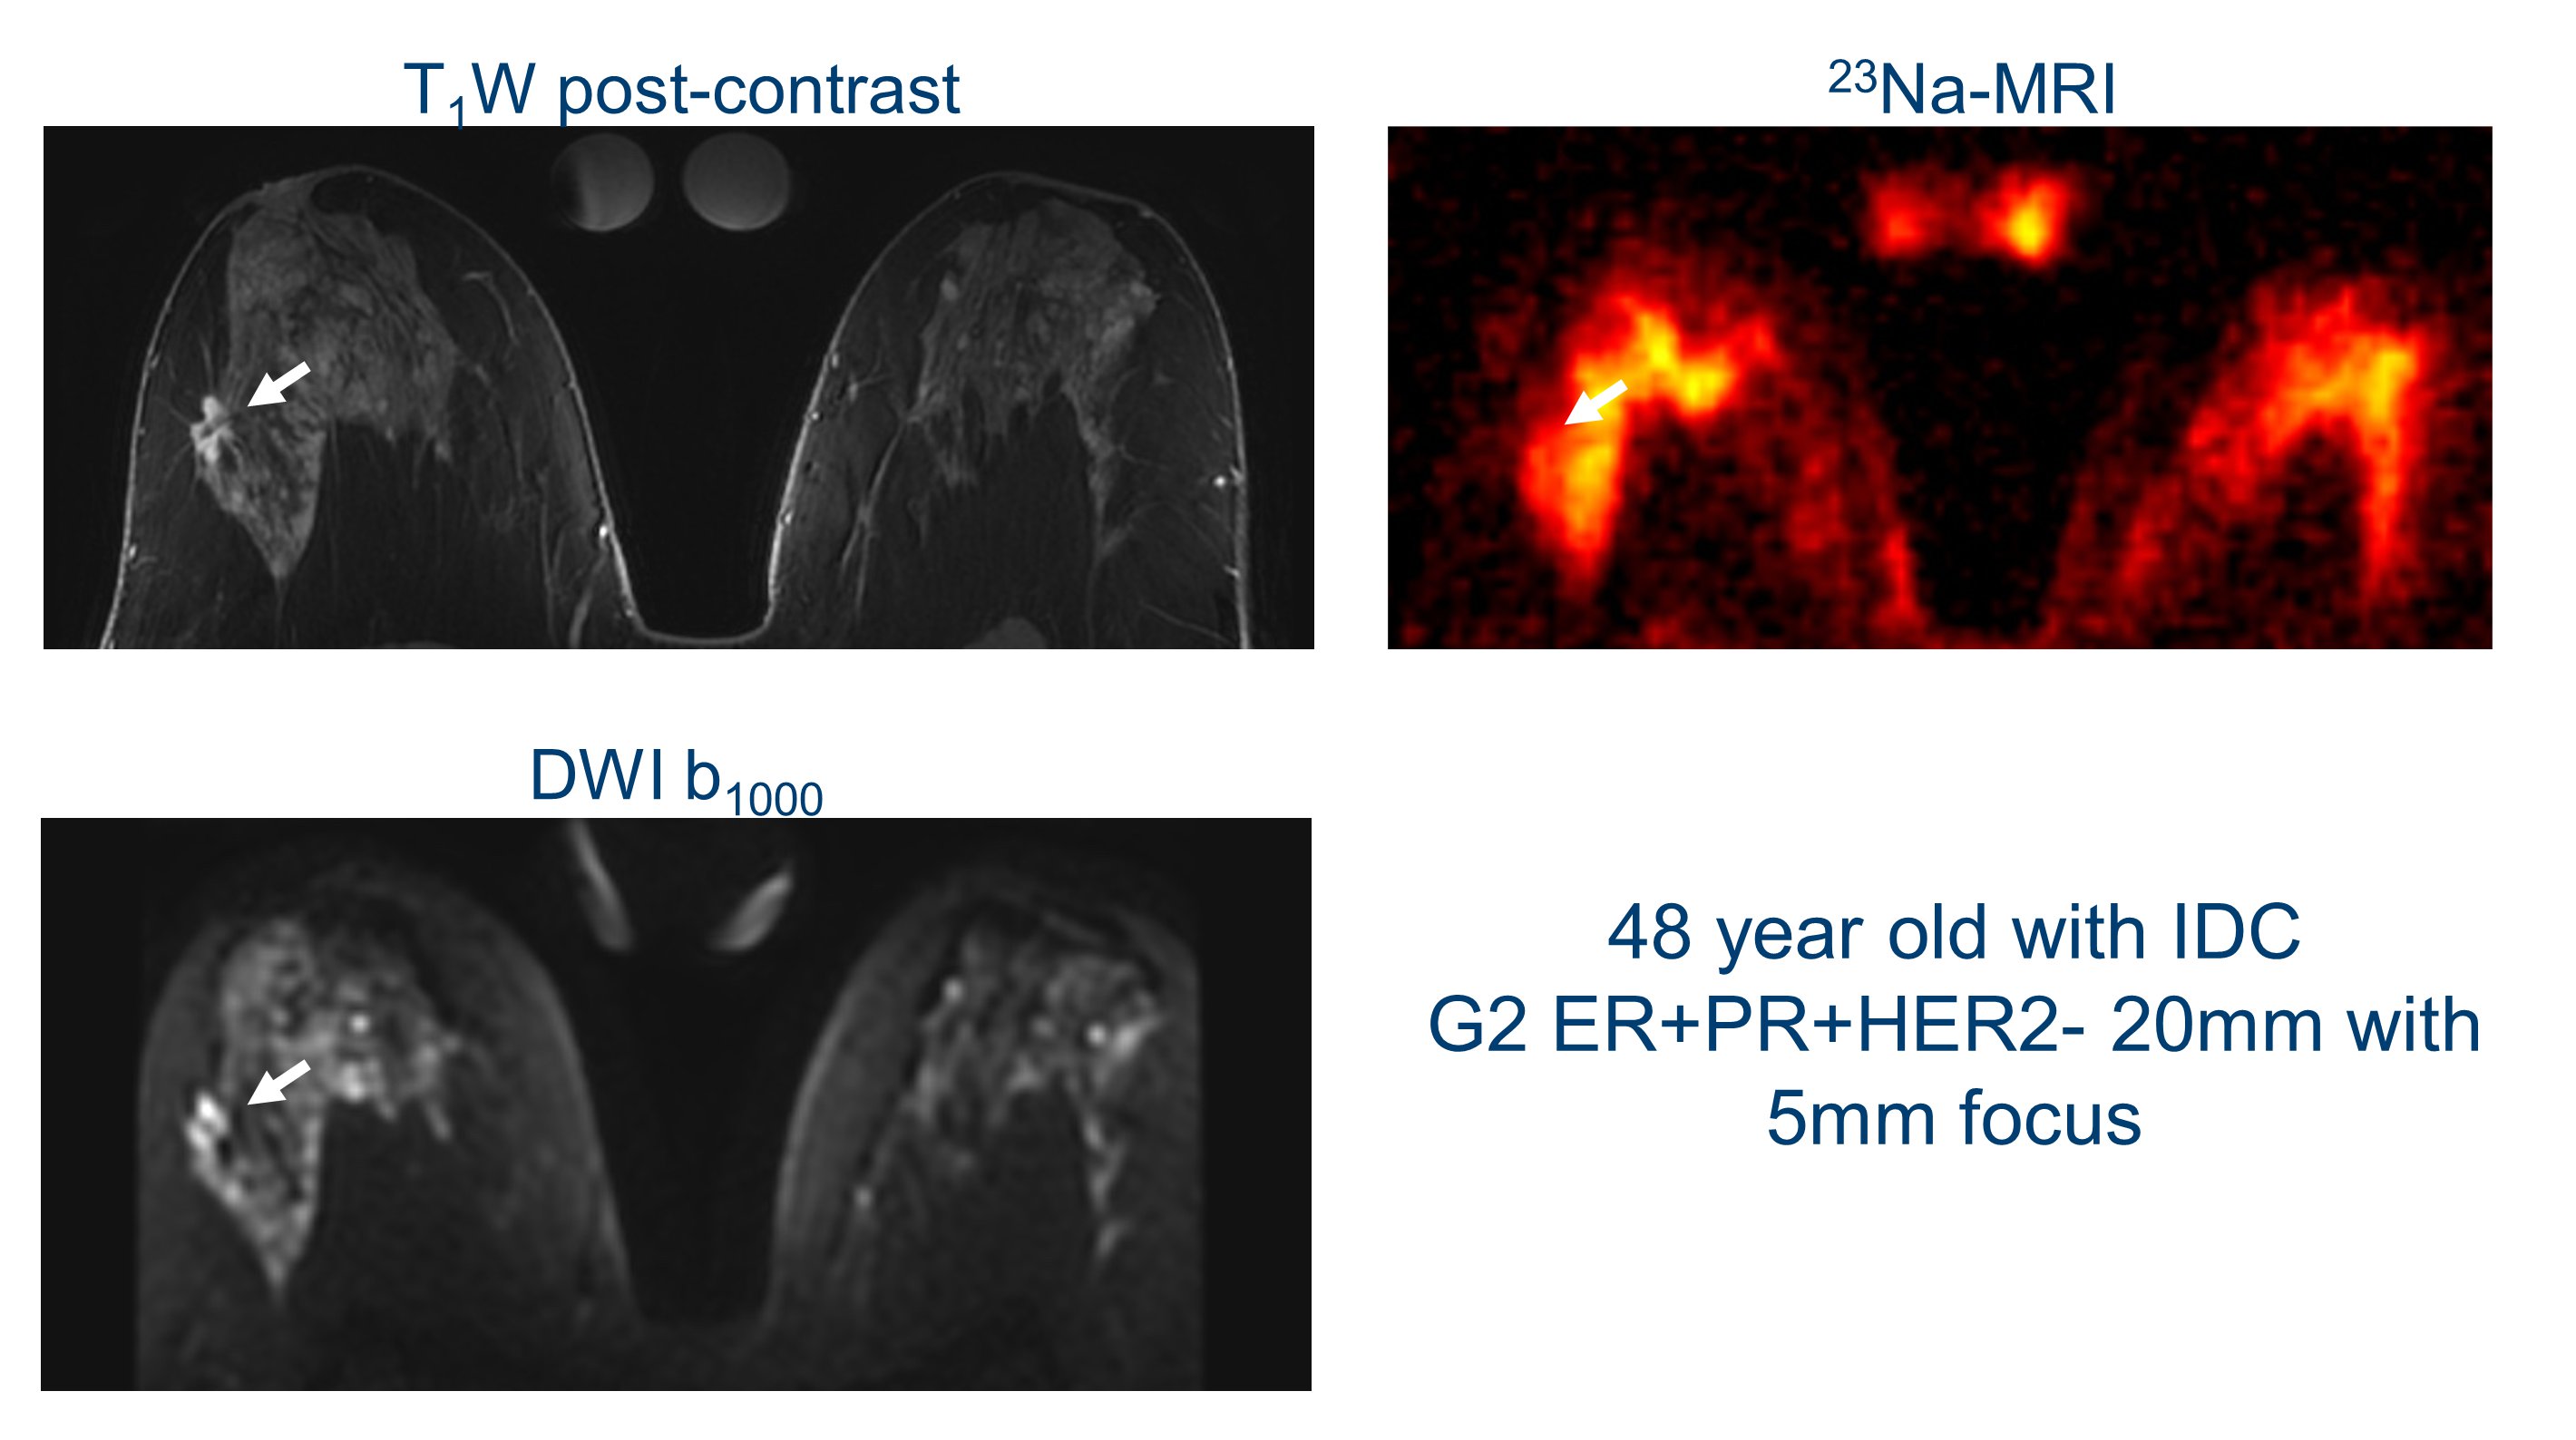
The mean whole breast fibroglandular TSC in healthy volunteers was 46±19 mmol/l, compared with 43±7 mmol/l in breast cancers. Interestingly, there was a clear higher maximum TSC in several patients (up to 135 mmol/l).Figures 1&2 show 23Na-MRI, DWI at b=1000 to show diffusion restriction, and post-contrast T1w images from two patients. Similar anatomical structures are observed in all three types of image, with higher TSC in areas of fibroglandular tissue and histopathologically proven breast cancer. Areas with high sodium signal correspond to areas with restricted diffusion. Qualitatively, there is increased signal at the lesion locations in Figure 1 in all three types of images: post-contrast T1w, DWI, and 23Na. The patient in Figure 2 shows increased sodium signal throughout the fibroglandular tissue, and only modest sodium signal where the diffusion and post-contrast T1w image are enhanced. The patient in Figure 1 has more adipose tissue than the younger patient of Figure 2, which is an important difference for determining the sensitivity of the technique.
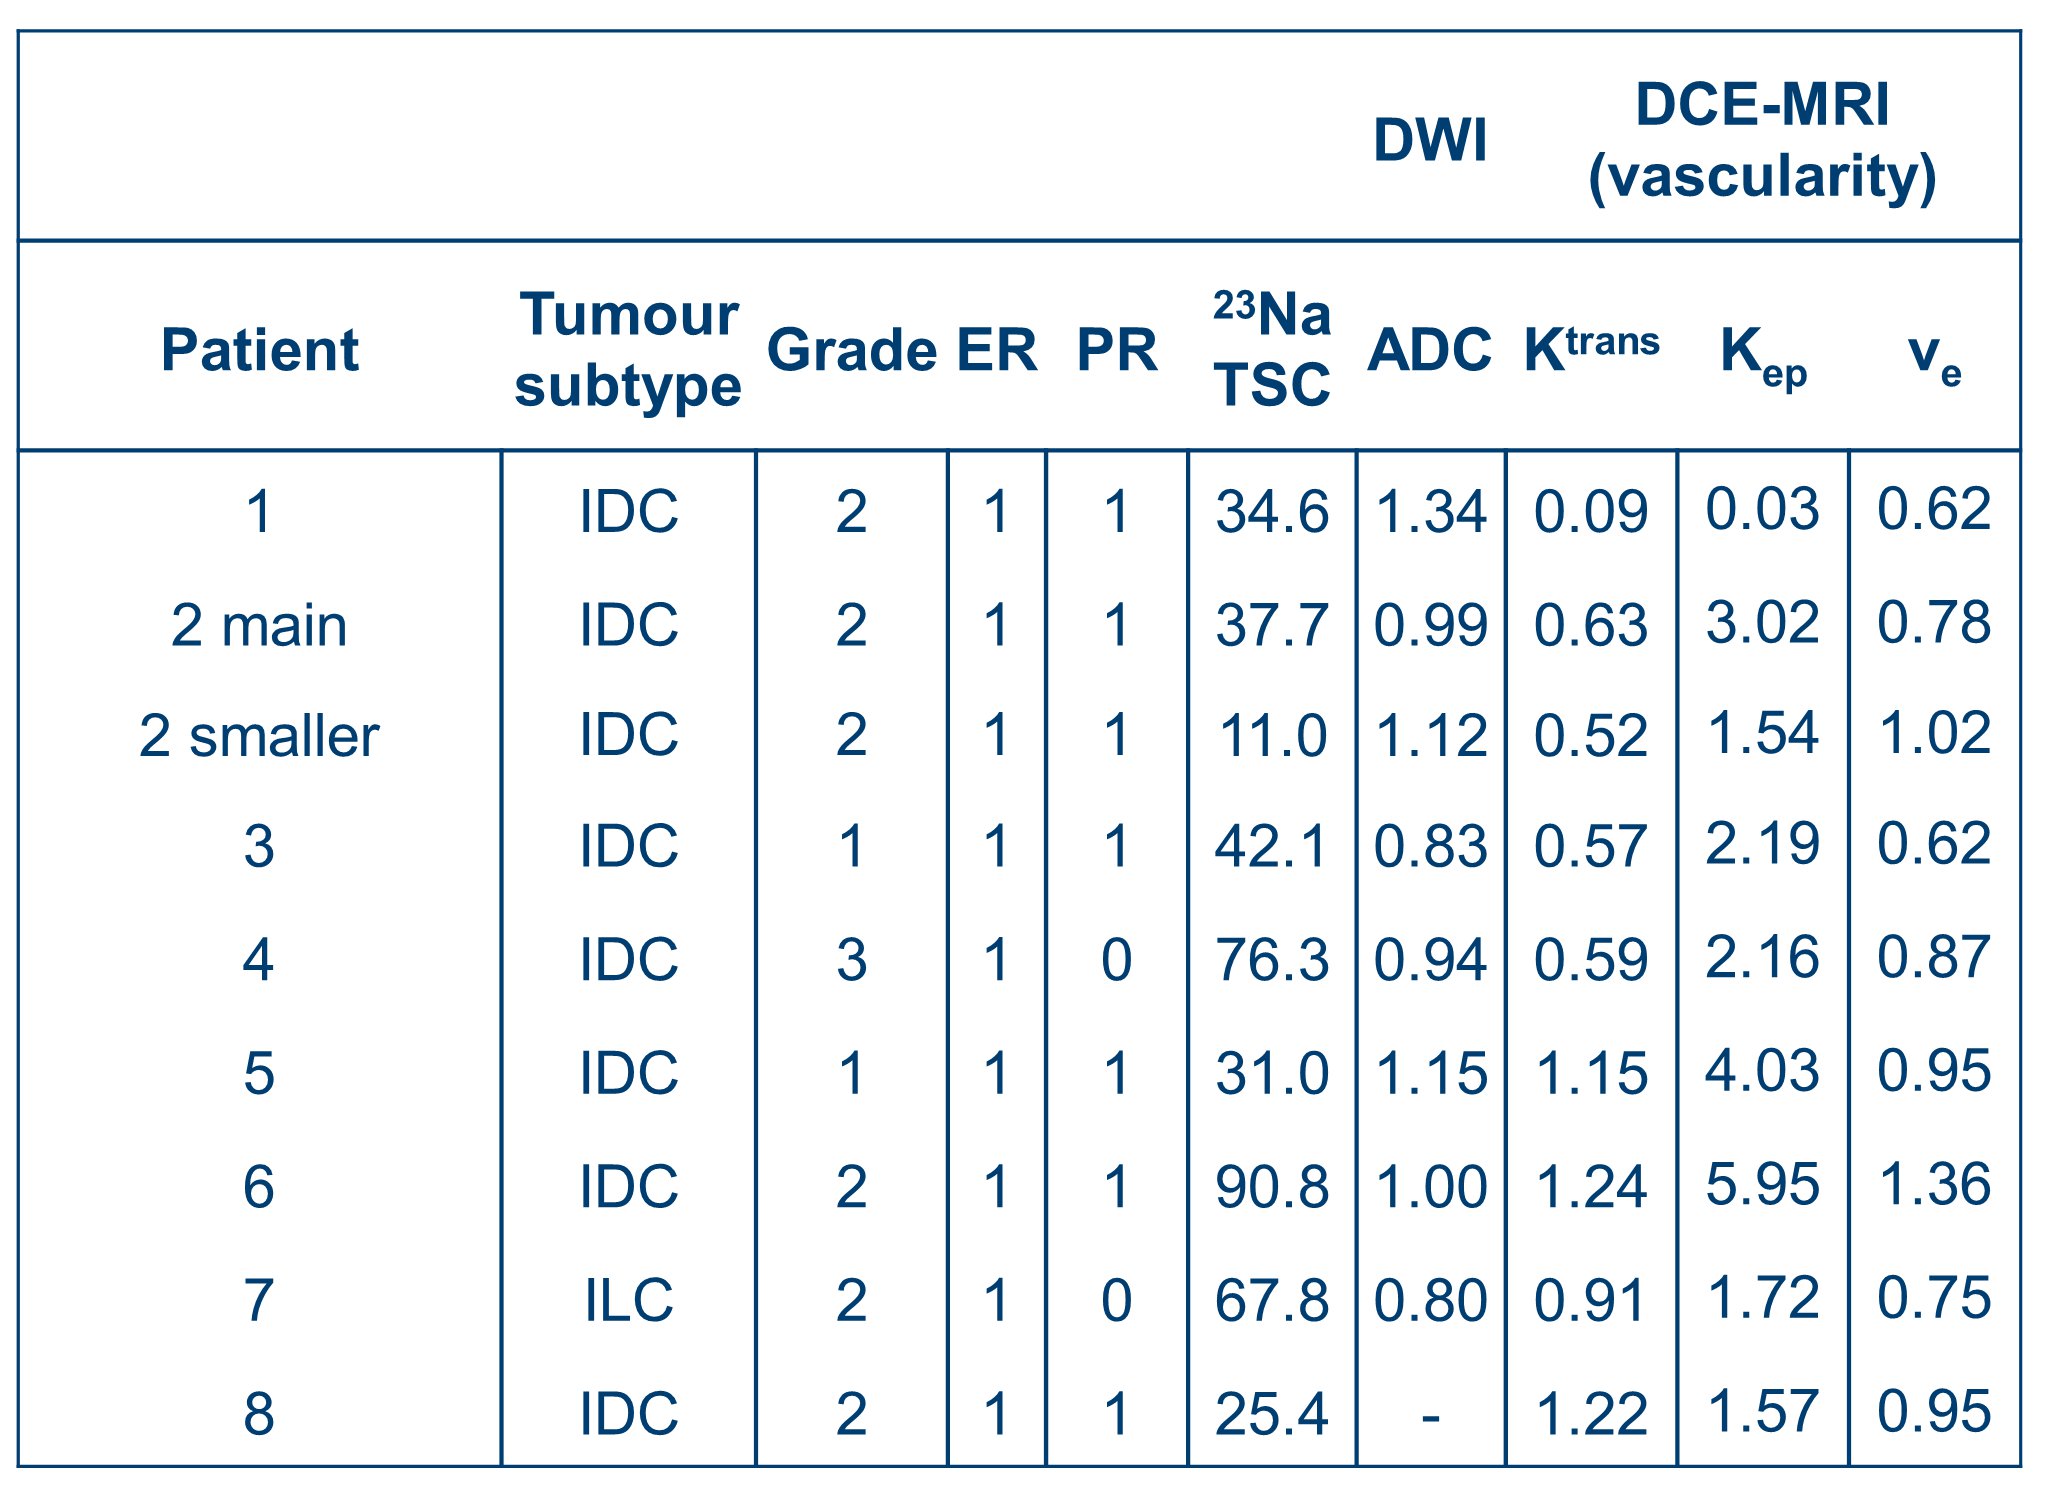
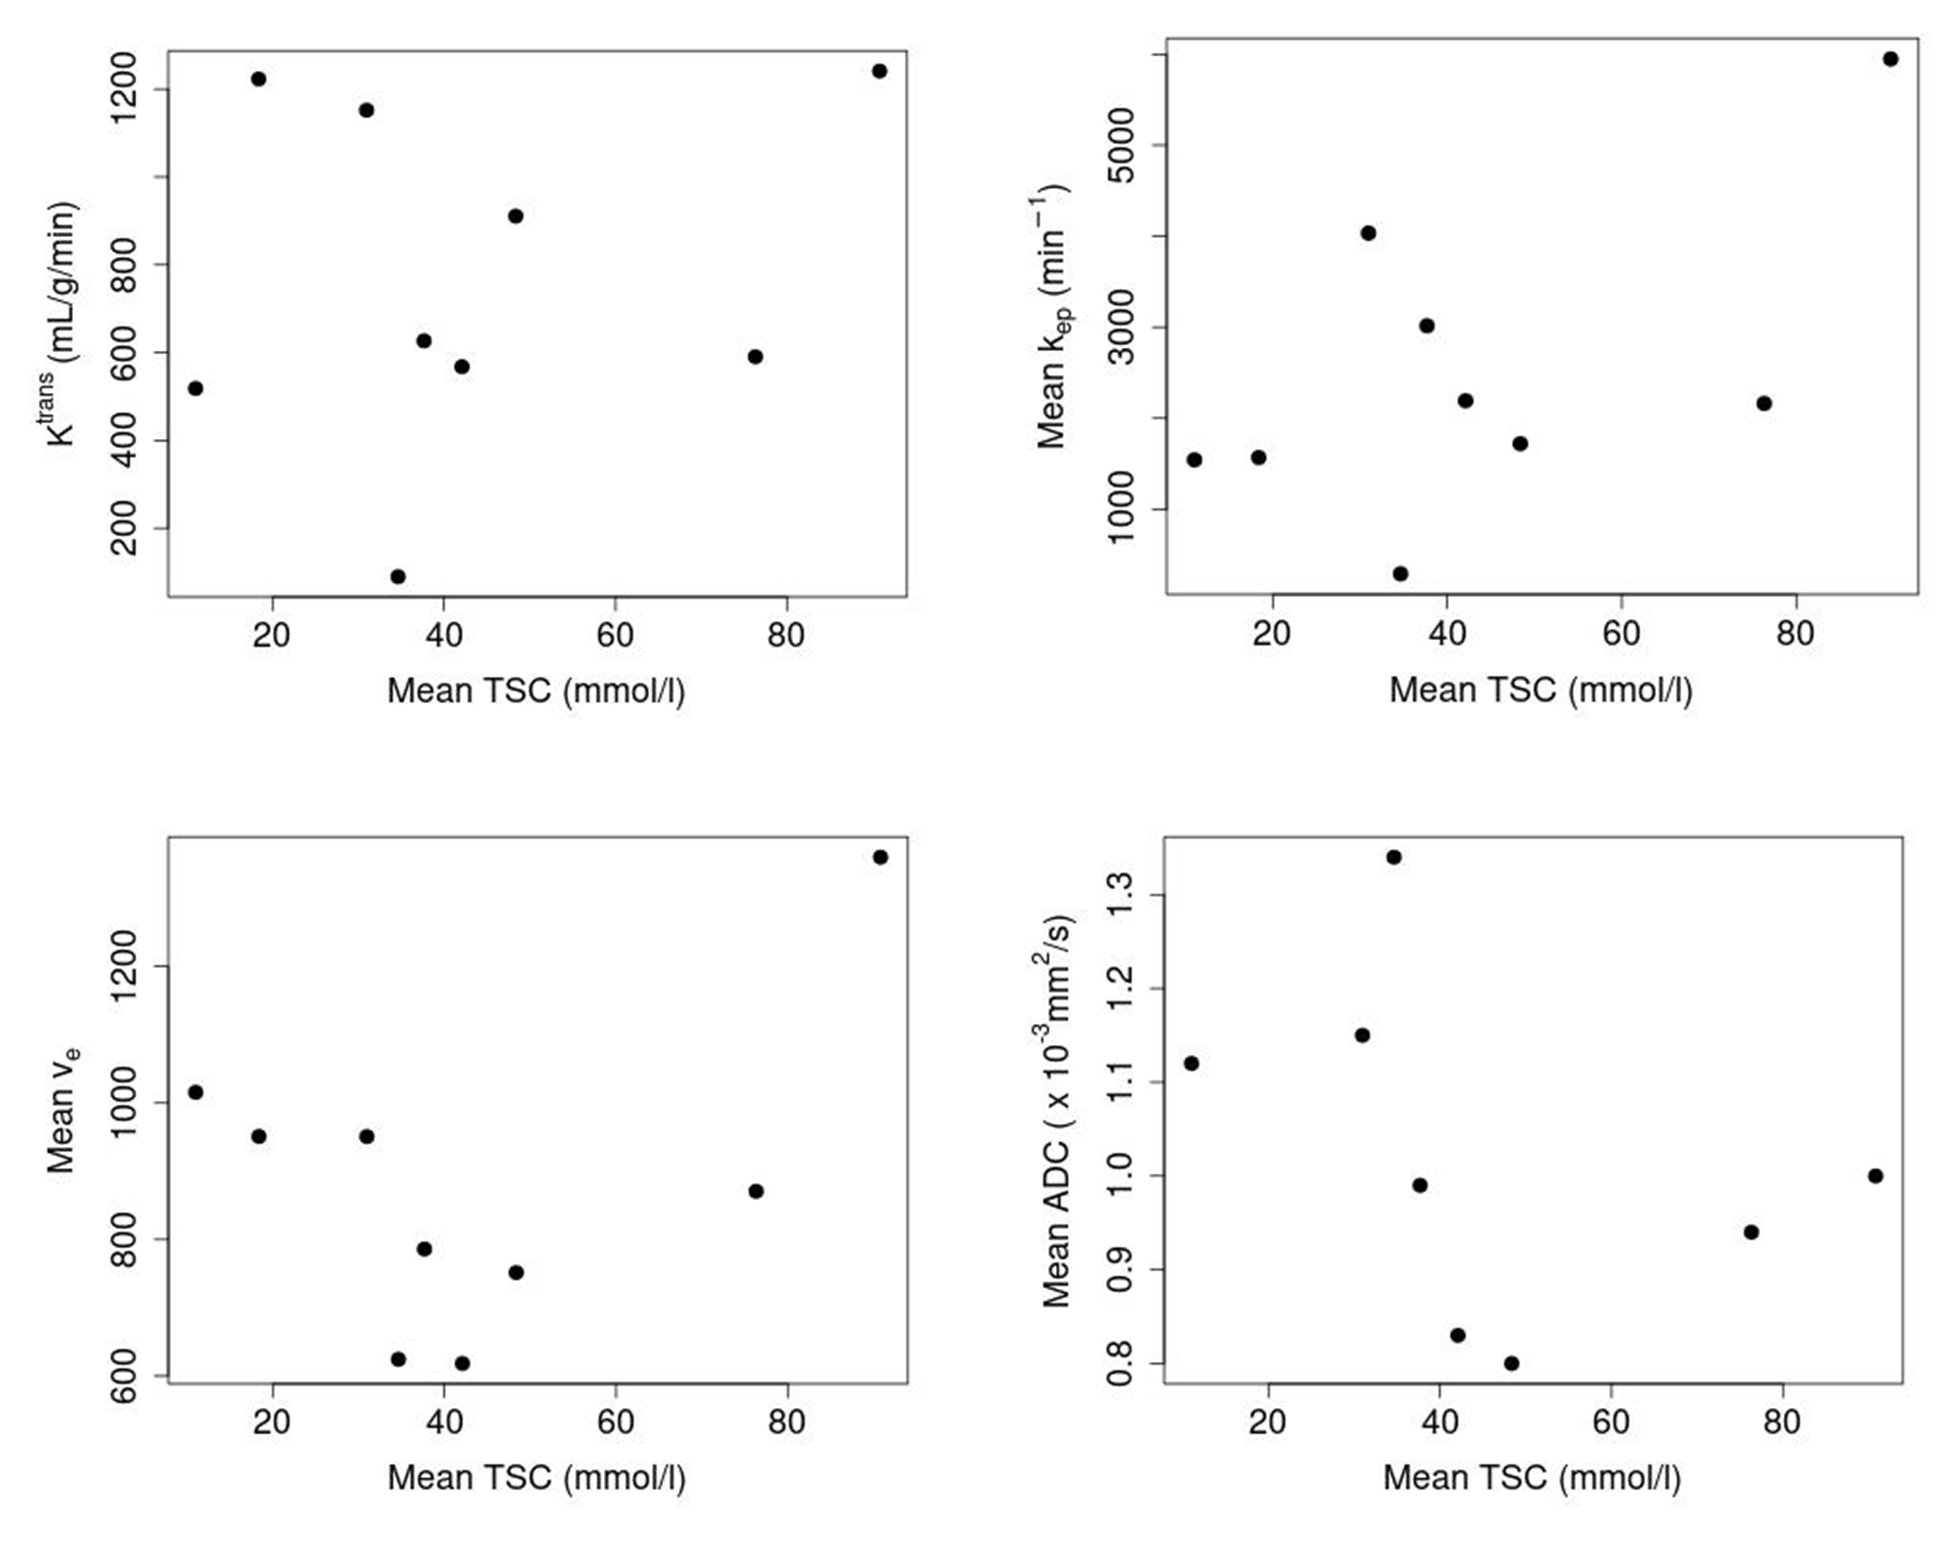
Table 1 shows relevant metrics of the tumors, including their sodium concentration, ADC and pharmacokinetic parameters. Figure 3 shows plots of parameters against mean TSC to visualise correlations. There were no strong linear correlations between TSC and either DWI/DCE measurements (p>0.5).
Discussion & Conclusion
The mean TSC of normal breasts in healthy volunteers and within breast cancers were similar, which suggests method consistency. The maximum TSC differences were however striking, with several TSC increasing up to twice the normal value. The sodium concentrations measured in fibroglandular tissue were slightly higher than those reported previously[1]. The younger age of the normal volunteers confounds these TSC comparisons, as younger populations generally have less adipose tissue and increased TSC. We expect increased patient numbers will enhance the correlations found between tumor types, and pharmacokinetic, diffusion, and sodium measurements.Patient differences shown in Figures 1&2 suggest that there may be more interesting underlying relationships between tumor pharmokinetics and sodium concentrations. Two lesions had nearly double mean TSC and T1w post-contrast enhancement. However, several lesions had a lower TSC than neighboring fibroglandular tissue, despite contrast enhancement. These tissue differences suggest that TSC offers unique physiological information that can complement diffusion and pharmokinetic biomarkers.
Acknowledgements
This work was supported by Cancer Research UK and the National Institute of Health Research Cambridge Biomedical Research Centre.References
[1] R. Ouwerkerk, M. A. Jacobs, K. J. Macura et al., “Elevated tissue sodium concentration in malignant breast lesions detected with non-invasive 23Na MRI,” Breast Cancer Res Treat, vol. 106, no. 2, pp. 151-60, Dec, 2007.
[2] G. Madelin, J.-S. Lee, R. R. Regatte et al., “Sodium MRI: methods and applications,” Progress in nuclear magnetic resonance spectroscopy, vol. 79, pp. 14-47, 2014.
[3] P. T. Gurney, B. A. Hargreaves, and D. G. Nishimura, “Design and analysis of a practical 3D cones trajectory,” Magn Reson Med, vol. 55, no. 3, pp. 575-82, Mar, 2006.
[4] L. E. Kershaw, and H.-L. M. Cheng, “A general dual-bolus approach for quantitative DCE-MRI,” Magnetic resonance imaging, vol. 29, no. 2, pp. 160-166, 2011.
[5] P. S. Tofts, G. Brix, D. L. Buckley et al., “Estimating kinetic parameters from dynamic contrast-enhanced T 1-weighted MRI of a diffusable tracer: standardized quantities and symbols,” Journal of Magnetic Resonance Imaging, vol. 10, no. 3, pp. 223-232, 1999.
Figures