1680
In vivo mapping of sodium relaxation times in breast fibroadenoma at 7T1Center for Advanced Imaging Innovation and Research (CAI2R), Department of Radiology, New York University Grossman School of Medicine, New York, NY, United States, 2Center for Biomedical Imaging, Department of Radiology, New York University Grossman School of Medicine, New York, NY, United States, 3Perlmutter Cancer Center, New York University Grossman School of Medicine, New York, NY, United States, 4Department of Surgery, New York University Grossman School of Medicine, New York, NY, United States
Synopsis
Sodium (23Na) MRI has been employed to measure the total sodium concentration (TSC) in breast lesions, which is often elevated compared to healthy breast. The knowledge of the 23Na relaxation times of the breast, which could be subject to variations in lesions, could increase the accuracy of TSC estimation. In this work we measured the 23Na relaxation times in six fibroadenoma patients and found a 71% increase in T2,s and a 28% decrease in T1 in the lesions compared to healthy tissue. Therefore, using healthy breast relaxation times in TSC quantification could result in errors in lesions.
Introduction
Sodium (23Na) MRI allows non-invasive detection of sodium concentration in soft tissues [1]. Sodium ions play a key role in maintaining the homeostasis at the cellular level, thus alterations of sodium concentration are often associated with pathological conditions. The total sodium concentration (TSC, i.e. the average of the intra- and extracellular concentrations) is elevated in breast lesions [2-5], therefore TSC could be a valuable biomarker for malignancy. However, TSC calculation from 23Na MRI measurements is biased by the 23Na relaxation times because in typical 3D sodium sequences, TR and flip angle are set to maximize SNR efficiency rather than to allow full magnetization recovery and TE is in the same range as T2,s. Therefore, the knowledge of the 23Na relaxation times of the breast could potentially increase the accuracy of TSC. Moreover, changes in the molecular environment of the lesion could result in alteration of its 23Na relaxation times, which could also be an indicator of tumor malignancy or of therapy response. The current literature on breast 23Na relaxation times is scarce and only focuses on healthy fibroglandular tissue [6]. The aim of this work is to measure 23Na relaxation times in a cohort of patients with fibroadenoma, which are common benign (non-cancerous) breast tumors.Methods
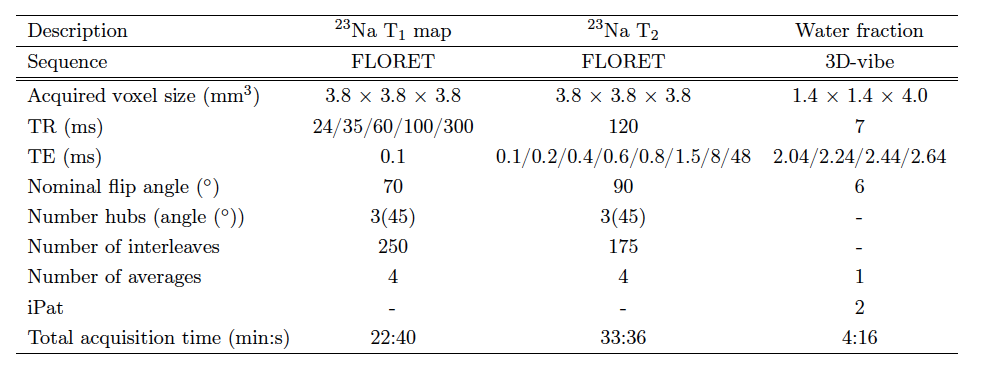
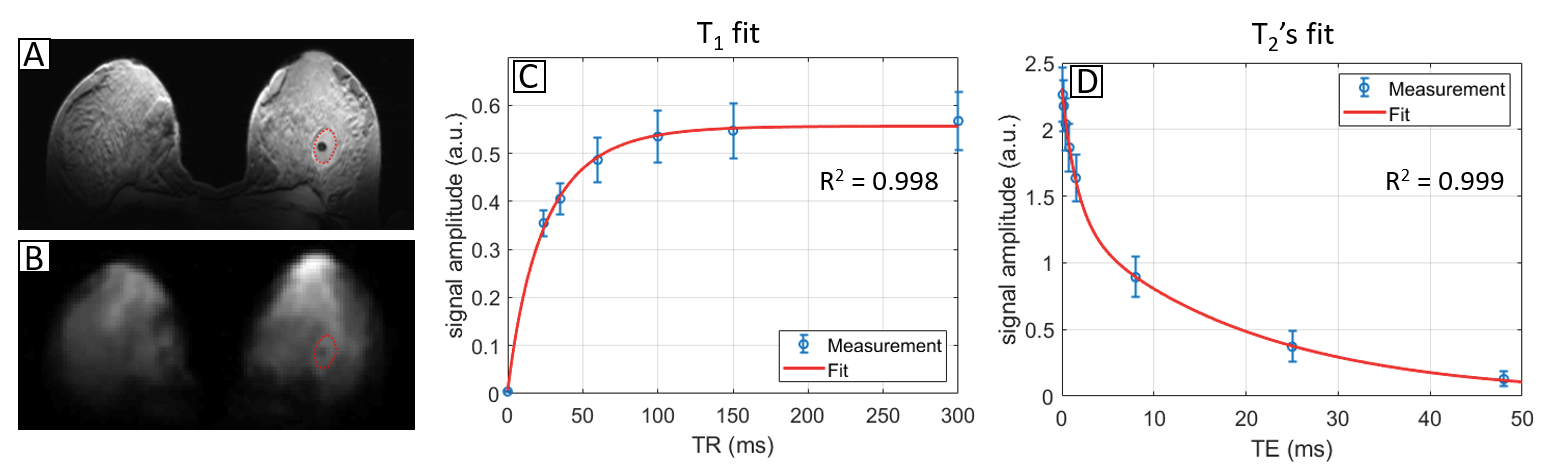
Six patients diagnosed with fibroadenoma were recruited for the study. All experiments were performed in accordance with the relevant institutional and national guidelines. The MRI measurements were acquired on a Siemens 7T MAGNETOM scanner (Siemens Healthineers, Erlangen, Germany) using an in-house built transmit/receive dual-tuned bilateral breast coil [7] with two proton and eight sodium receive channels. For morphological proton imaging and segmentation purposes, a water fraction map was acquired using the IDEAL method [8]. T1 values were obtained by fitting a monoexponential function to the signal acquired using five fermat looped orthogonally encoded trajectories (FLORET) [9] sequences with different TRs ranging from 24 to 300 ms. Similarly, T2,l and T2,s values were calculated by fitting a biexponential function to eight FLORET sequences with different TEs ranging from 0.1 to 48 ms. The total scan time was approximately one hour. The prescribed sequence parameters are listed in Table 1. ROIs containing the lesions and contralateral fibroglandular tissue were drawn on the co-registered proton images using FireVoxel (NYU).Results
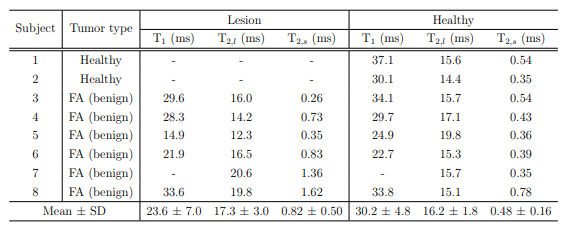
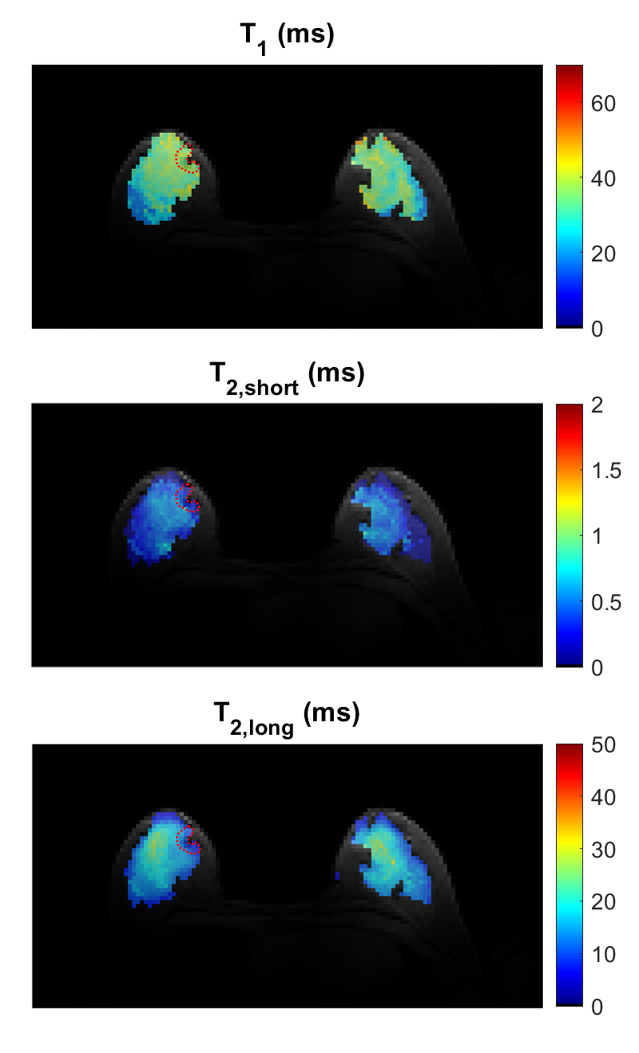
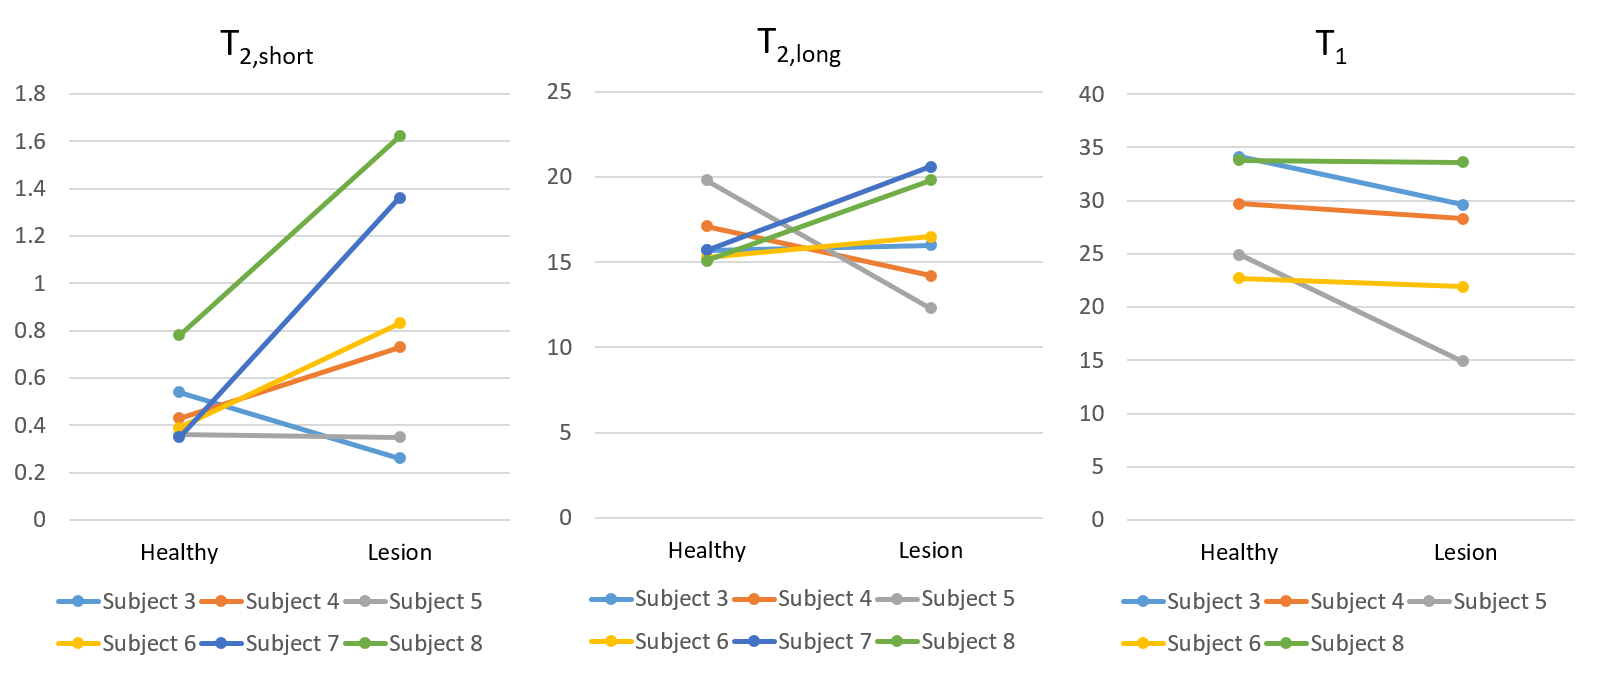
Figure 1 shows the fitting results in a 25 year-old patient diagnosed with a fibroadenoma measuring 2.6 x 1.4 x 2.6 cm (Subject 8 from Table 2). In a 3D ROI containing the lesion T1 = 33.6 ms (R2 = 0.998), T2,l = 19.8 ms and T2,s = 1.62 ms (R2 = 0.999). The relaxation times measured in two healthy subjects and six fibroadenoma patients are listed in Table 2. The mean T1, T2,l and T2,s of the lesions and of healthy tissue were, respectively: T1 = 23.6 ± 7.0 ms, T2,l = 17.3 ± 3.0 ms, T2,s = 0.82 ± 0.50 ms and T1 = 30.2 ± 4.8 ms, T2,l = 16.2 ± 1.8 ms, T2,s = 0.48 ± 0.16 ms, respectively. The mean R2 was 0.9986 for T1 and 0.9989 for T2 fitting. Voxel-wise maps of T1, T2,l and T2,s in a patient with fibroadenoma in the right breast (subject 4 in Table 2) are shown in Figure 2. In Figure 3, the data in Table 2 (subject 3-8) are plotted to facilitate their interpretation. Each line in the plots represents the comparison of T2,s, T2,l and T1 between healthy contralateral tissue and lesions, respectively, in each of the patients.Discussion
Our results show in vivo measurements of sodium relaxation times in a cohort of healthy subjects and patients with fibroadenoma. Using a tailored coil with multiple sodium receivers at 7T in combination with a FLORET sequence with prescribed voxel size of 3.8 mm isotropic allowed measuring sodium relaxation times with a goodness of fit R2 > 0.9958. The relaxation times that we measured in healthy breast tissue were in agreement with previous findings [6]. In a small cohort of fibroadenoma patients, the trends indicate a 71% increase in T2,s and a 28% decrease in T1 in the lesion compared to healthy contralateral fibroglandular tissue, while T2,l is somewhat unchanged. Given the small sample size, these differences were not statistically significant.Conclusion
In this work we measured sodium relaxation times of healthy breast and fibroadenoma. Localized relaxation time measurements may be important in TSC quantification, since unique physiological conditions in lesions may give rise to significant differences with healthy tissue. For context, a 71% increase in T2,s would result in 15% change in TSC, while a 28% decrease in T1 would result in a 8.5% change in TSC using our previously described framework [5]. While subject specific relaxation time measurement would be ideal, it is prohibitive due to its long acquisition time. Therefore, a priori lesion-specific values may serve as a suitable reference. While additional measurements are needed in a more diverse range of tumor types, this work serves as a starting point for such a database.Acknowledgements
This work was supported by National Institutes of Health Grant R21CA213169 and was performed under the rubric of the Center for Advanced Imaging Innovation and Research (CAI2R, www.cai2r.net) at the New York University School of Medicine, which is an NIBIB Biomedical Technology Resource Center (NIH P41 EB017183).References
1. Madelin, G., et al., Sodium MRI: methods and applications. Prog Nucl Magn Reson Spectrosc, 2014. 79: p. 14-47.
2. Jacobs, M.A., et al., Monitoring of neoadjuvant chemotherapy using multiparametric, (2)(3)Na sodium MR, and multimodality (PET/CT/MRI) imaging in locally advanced breast cancer. Breast Cancer Res Treat, 2011. 128(1): p. 119-26.
3. Ouwerkerk, R., et al., Elevated tissue sodium concentration in malignant breast lesions detected with non-invasive 23Na MRI. Breast Cancer Res Treat, 2007. 106(2): p. 151-60.
4. Zaric, O., et al., Quantitative Sodium MR Imaging at 7 T: Initial Results and Comparison with Diffusion-weighted Imaging in Patients with Breast Tumors. Radiology, 2016. 280(1): p. 39-48.
5. Ianniello, C., et al., Multinuclear MRI to disentangle intracellular sodium concentration and extracellular volume fraction in breast cancer. Sci Rep, 2021. 11(1): p. 5156.
6. Zbyn, S., et al. Bilateral in vivo mapping of sodium relaxation times in breasts at 7T. in Twenty-Third Meeting of the International Society for Magnetic Resonance in Medicine. 2015. Toronto, Ontario.
7. Ianniello, C., et al., A dual-tuned multichannel bilateral RF coil for (1) H/(23) Na breast MRI at 7 T. Magn Reson Med, 2019. 82(4): p. 1566-1575.
8. Tsao, J. and Y. Jiang, Hierarchical IDEAL: robust water-fat separation at high field by multiresolution field map estimation, in Proceedings of the 18th Annual Meeting of ISMRM. 2008: Toronto, ON, Canada. p. 653.
9. Pipe, J.G., et al., A new design and rationale for 3D orthogonally oversampled k-space trajectories. Magn Reson Med, 2011. 66(5): p. 1303-11.
Figures