1679
Discrimination Between Benign and Malignant Lesions in the Breast with Restriction Spectrum Imaging on a Screening Breast MRI Cohort1Radiology, UCSD, San Diego, CA, United States, 2Department of Circulation and Medical Imaging, Norwegian University of Science and Technology, Trondheim, Norway, 3Radiation medecine, UCSD, San Diego, CA, United States, 4Bioengineering, UCSD, San Diego, CA, United States, 5Beth Israel Hospital, Boston, MA, United States, 6Harvard Medical School, Bosston, MA, United States, 7Commonwealth Radiology Associates, Boston, MA, United States, 8Neurosciences, UCSD, San Diego, CA, United States, 9American college of radiology, Reston, VA, United States
Synopsis
Diffusion weighted imaging (DWI) holds great potential in improving specificity of findings detected on contrast enhanced breast MRI. Restriction spectrum imaging (RSI), an advanced diffusion imaging model, has potential in discriminating between malignant and fibroglandular breast tissue. In this abstract, we evaluate RSI’s performance in differentiating malignant from benign lesions in a prospective study performed on a breast screening population. All lesions were biopsy proven. The breast RSI model allowed discrimination between malignant, high-risk and low-risk benign lesions and healthy fibroglandular tissue.
INTRODUCTION
Standard of care breast MRI exams include dynamic contrast-enhanced MRI (DCE-MRI) collected with intravenous gadolinium injection. DCE has high sensitivity (71-94%), but variable specificity (61-97%)1,2. Biopsies are then required to distinguish benign from malignant tissue. Breast MRI would benefit from improved specificity, minimizing unnecessary biopsies.Quantitative diffusion-weighted MRI (DW-MRI) based biomarkers, such as the apparent diffusion coefficient (ADC) have shown potential for discriminating healthy and malignant tissues in breast3. However, conventional DW-MRI is limited by the lack of robust thresholds between benign and malignant lesions. More advanced models such as intravoxel incoherent motion (IVIM)4, kurtosis5 and restriction spectrum imaging (RSI)6 aim to decompose the diffusion signal to extract information on the different water pools in tissues. Recently, an RSI breast-specific model was developed and demonstrated potential in discriminating malignancy from healthy tissue7,8, based on data at two sites (sites 1 & 2) on known cancers greater than 2 cm in size. Therefore, the goal of this work is to evaluate the performance of the breast-specific RSI model in an independent cohort from a screening population (site 3).
METHODS
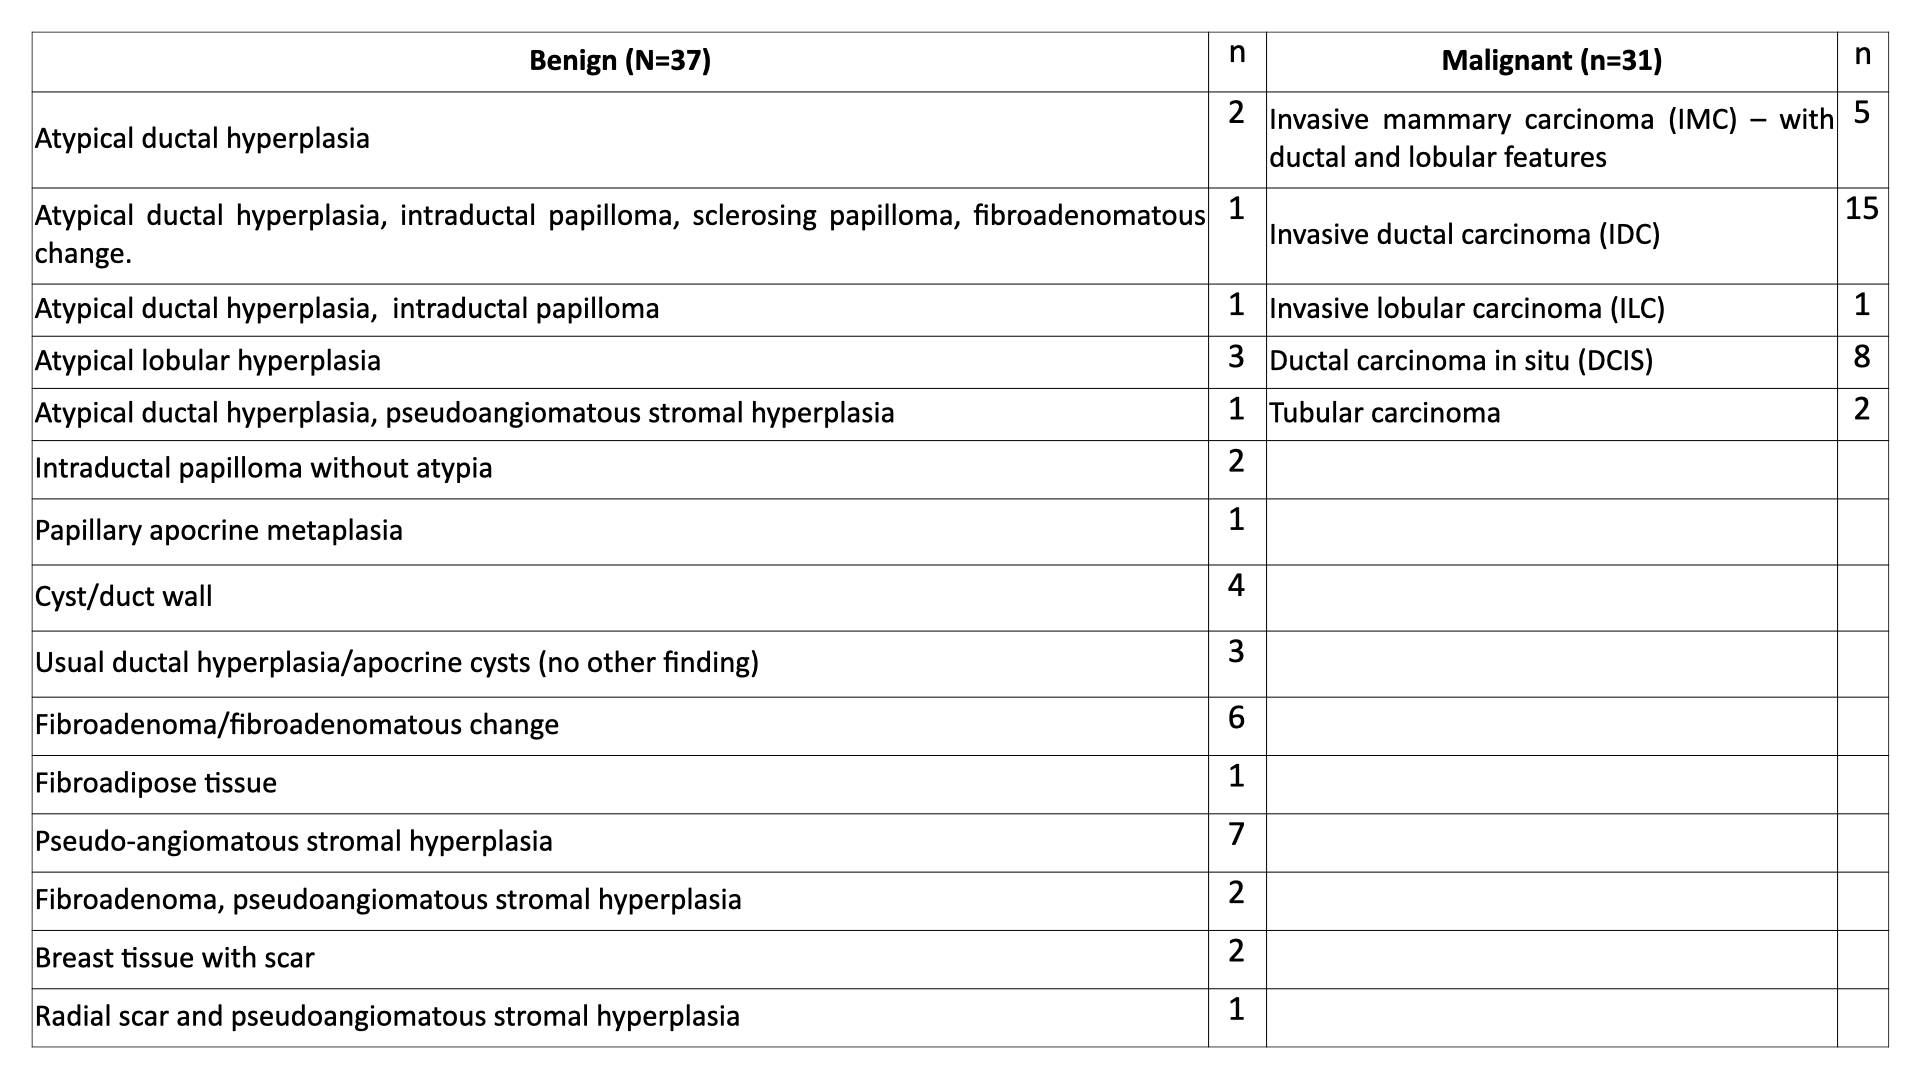
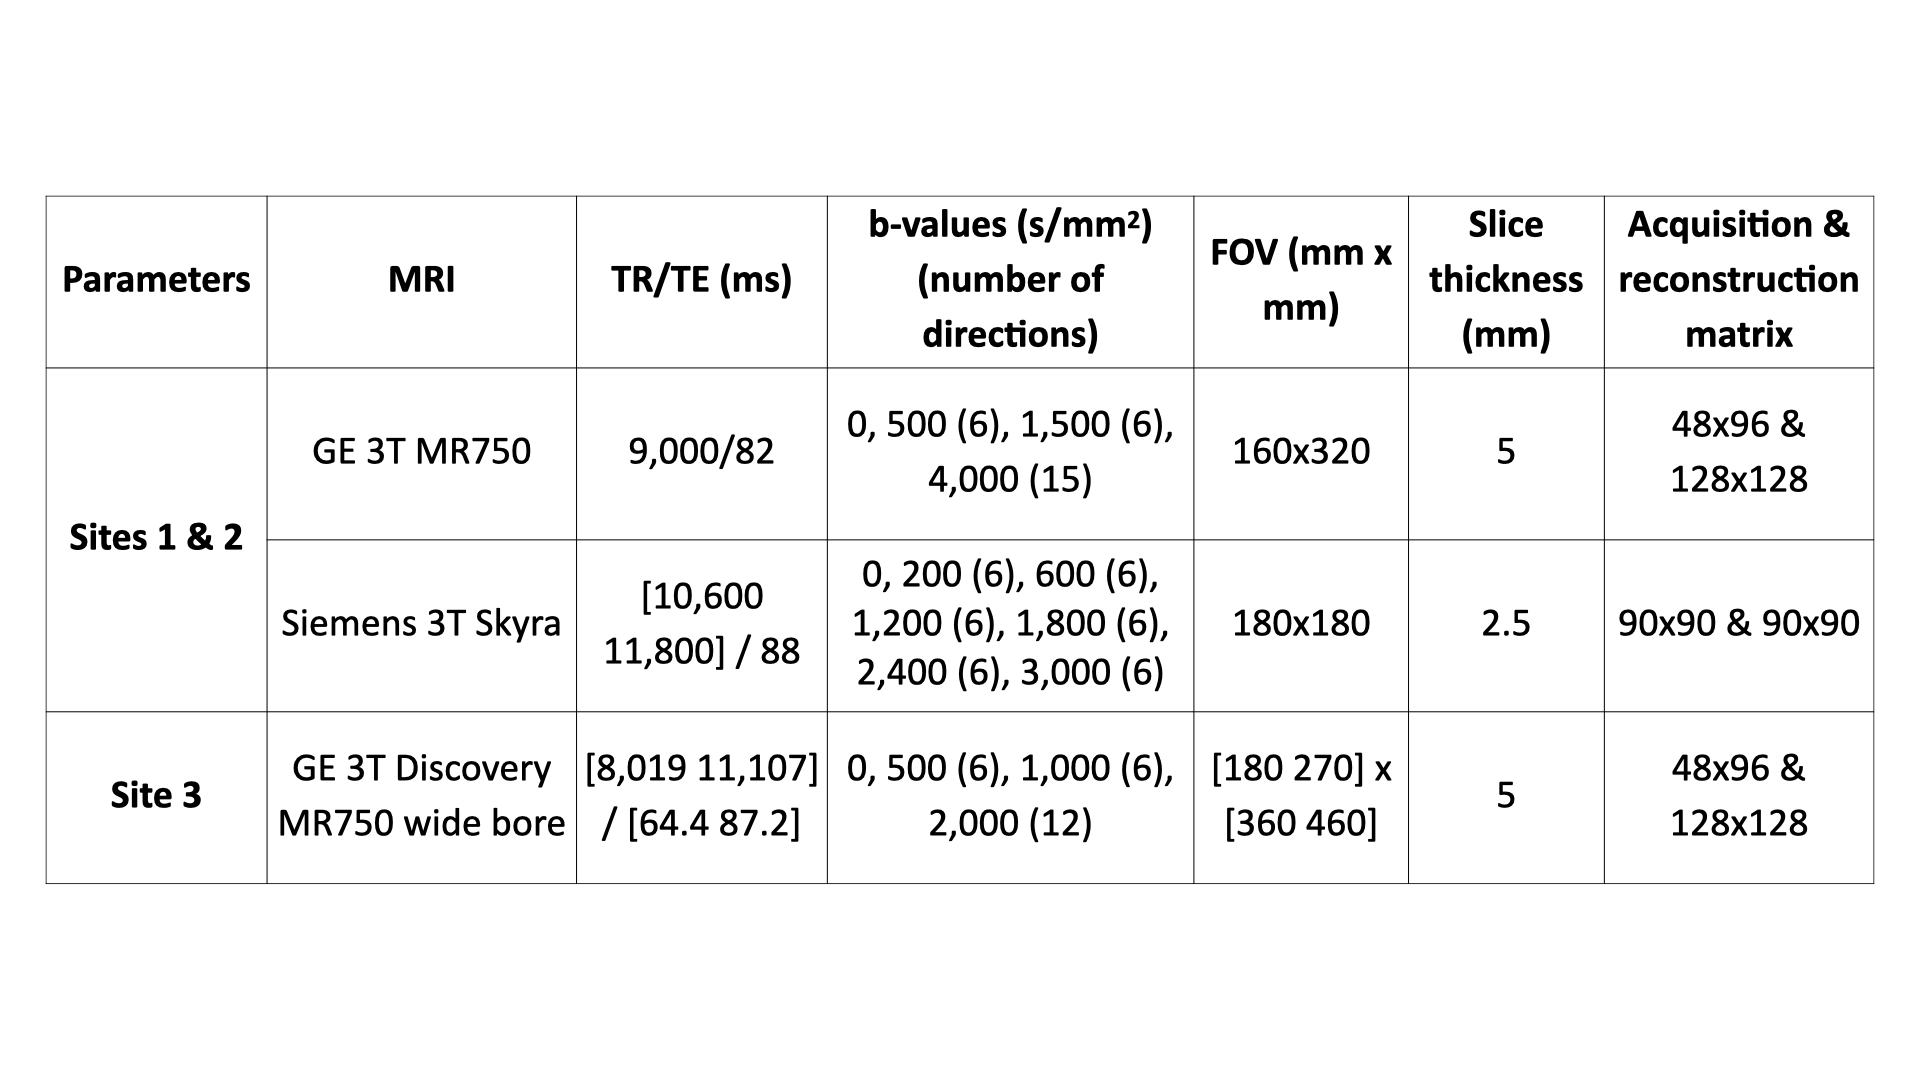
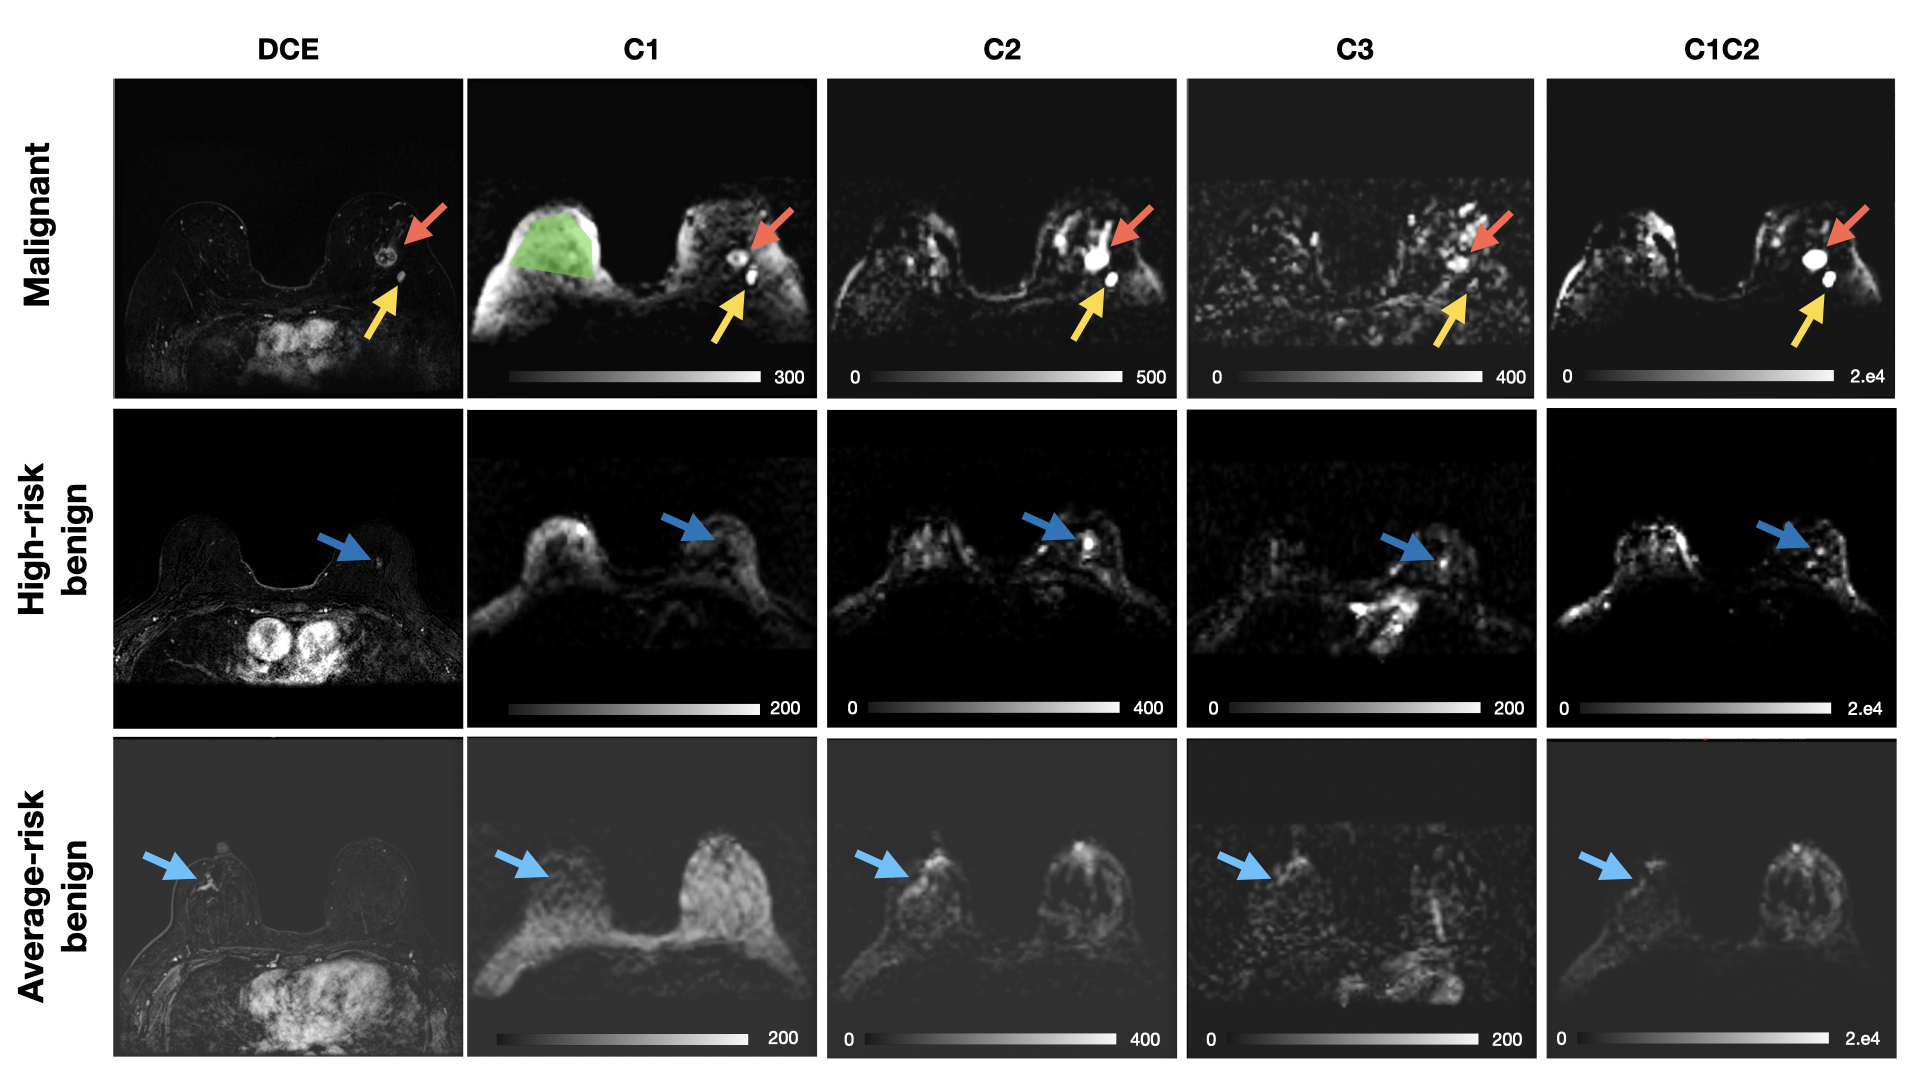
Women were recruited in two cohorts from a screening population– after screening mammography interpreted as BIRADS 0 with subsequent diagnostic work-up leading to the recommendation for biopsy or undergoing routine screening MRI due to high-risk status. A total of 185 women were prospectively scanned, of which 31 had at least one malignant lesion and 37 had at least one benign lesion. All lesions were assessed via core needle biopsy (Table 1). Data were collected using a 3.0T wide-bore (Discovery MR750w, GE Healthcare, USA) and breast coil array. Reduced field-of-view (FOV) DW-MRI and DCE were collected (Table 2).DW-MRI data were processed using Matlab (R2017a, Mathworks, USA) and were distortion corrected using reverse polarity gradient (RPG) method9, followed by noise and eddy current corrections7. Finally, datasets were normalized by the 98th percentile of the b=0 s/mm2 images. Pre-processed data of all patients were fit to the breast RSI model7 to generate signal contribution maps of components C1, C2, C3 and C1C2 product:
$$S(b)=C_1+C_{2}e^{-b×1.4×10^{-3}}+C_{3}e^{-b×10.3×10^{-3}}$$
The outputs are hypothesized to correspond to cancer and fatty tissue (C1), fibroglandular tissue (C2), and vascular flow (C3), respectively. The product C1C2 has been reported to improve discrimination between cancer and healthy tissue8. To better account for scaling, the square root of C1C2 was also calculated.
Regions of interest (ROIs) of malignant and benign lesions were 3D-delineated using ITK-SNAP under the supervision of a radiologist, based on suspicious findings detected on DCE-imaging corresponding to biopsied tissue. Benign lesions were further separated into high-risk lesions (e.g. atypia, papillomas) and average-risk lesions. Healthy fibroglandular tissue ROIs were drawn in the contralateral breast.
Two-way repeated measures analysis of variance (RM-ANOVA) and post-hoc tests were used to compare the magnitude of the RSI output compartments (Ci) in the four different tissue types (i.e. malignant, high-risk benign lesions, average-risk benign lesions, and fibroglandular tissue).
RESULTS
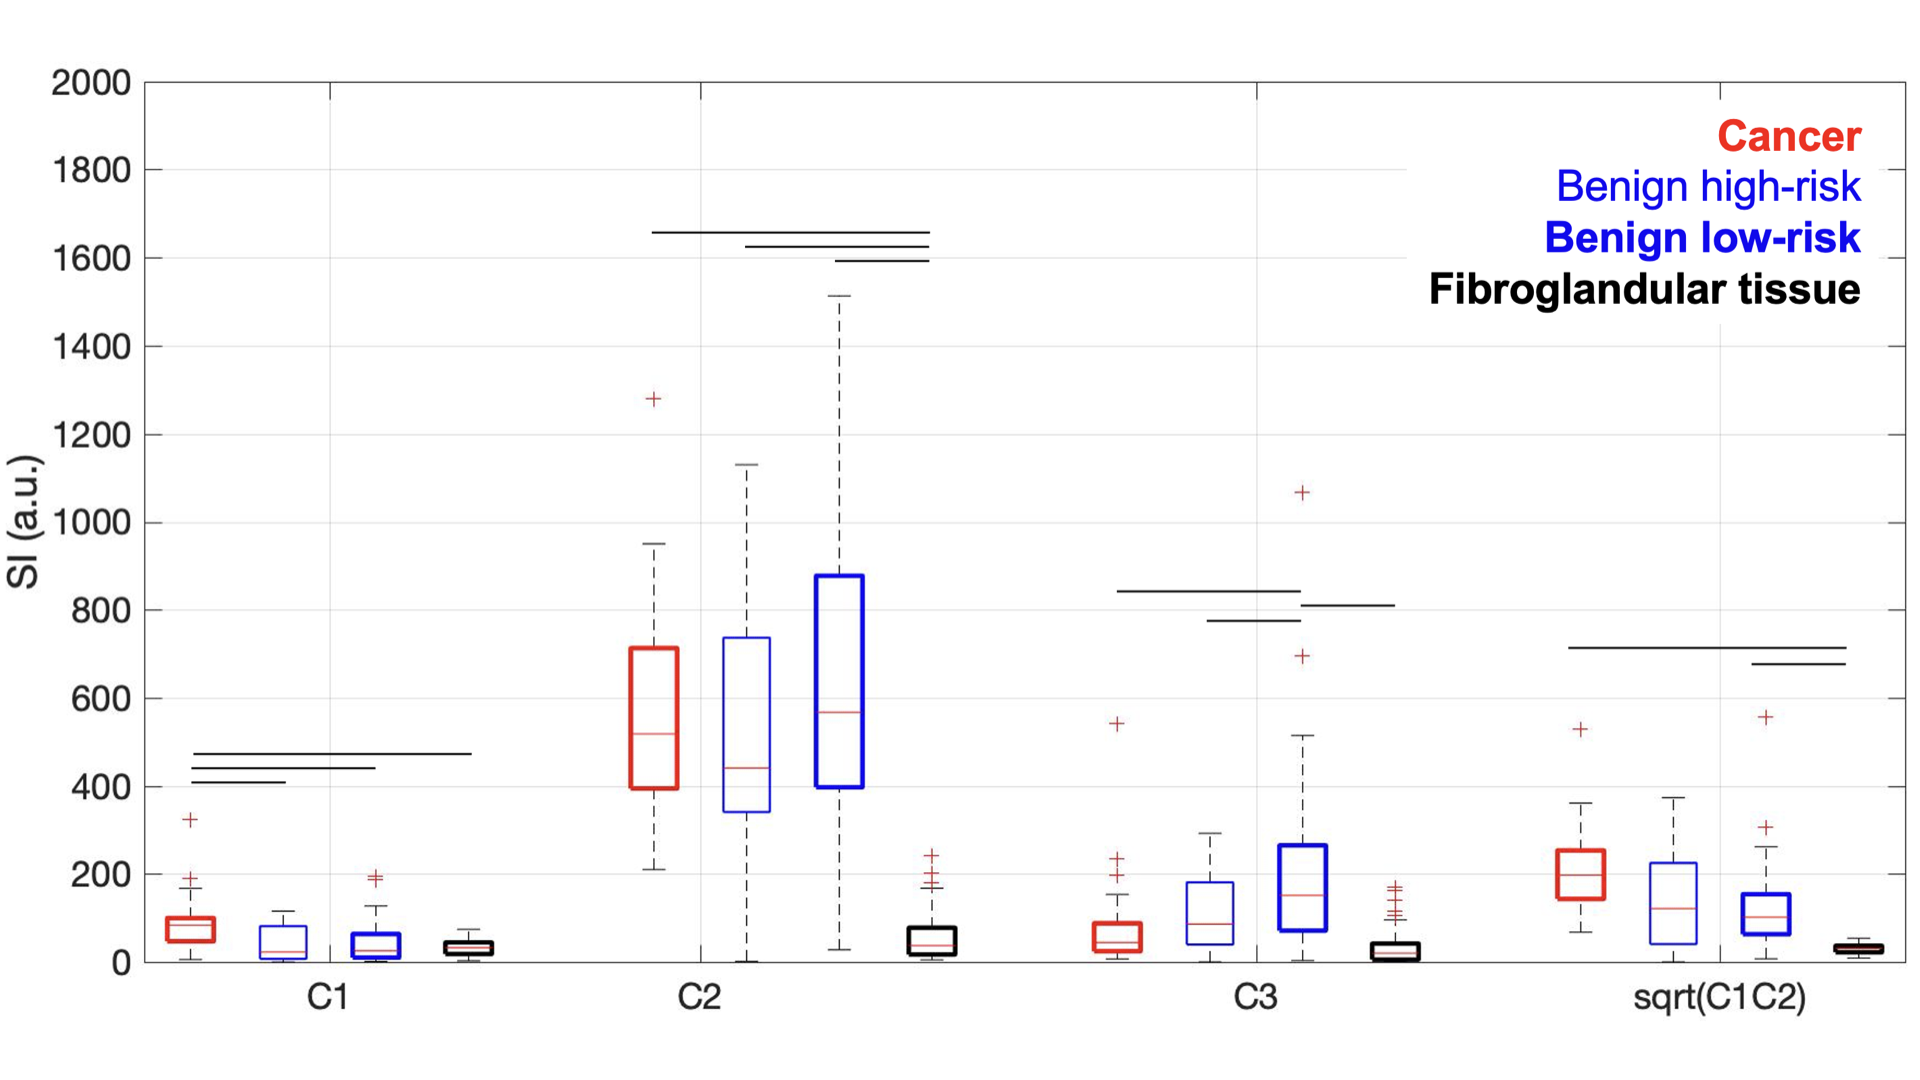
A total of 31 lesions in were identified as malignant, 11 as high-risk benign lesions and 26 as average-risk benign lesions in 68 women. The remaining patients had negative breast MRIs (117 patients). After fitting the pre-processed reduced-FOV DW-MRI data to the breast-specific RSI model, we quantified median signal from cancer lesions and fibroglandular ROIs in the RSI outputs (Figure 1).We found that RSI signal compartment C1 was higher (p<0.05) in cancer than in benign lesions and fibroglandular tissue, while C2 was higher (p<0.05) in all cancer and benign lesions compared to fibroglandular tissue. Interestingly, C3 was highest (p<0.05) in benign average-risk lesions (Figure 2), and significantly different from high-risk benign lesions.
DISCUSSION & CONCLUSIONS
This is the first time the breast-specific RSI model is applied to a screening population, and a cohort independent of the initial model development. Of note, the imaging parameters were different from those used to develop the model, which was developed on data at higher b-values (bmax=3,000 and 4000 s/mm2 vs 2,000 s/mm2 in this study) and without including benign lesions.Our breast-specific RSI model results show differentiation between benign and malignant lesions detected by DCE-MRI in a screening population. We hypothesize that the C1-compartment reflects restricted diffusion within malignant tissues with high cellularity. Similarly, we hypothesize that C2 corresponds to signal with greater hindered diffusion weighting, which can be high in both cancer and benign tissue. The high C2 signal in benign lesions may be related to the long T2 of some benign lesions10. Future work will focus on incorporating T2 information into the RSI model to determine the source of the reported differences in C2.
In this study, we found that the combination C1C2 discriminates malignant and healthy tissues in a breast screening MRI, based on lesions suspicious by DCE-MRI. Additionally, we observed a trend between high risk and average risk benign lesions. These results may help decrease unnecessary biopsies. Future developments will involve fine-tuning the model to allow for classifying suspicious lesions without requiring DCE in the screening population. Specifically, image acquisition with increased resolution will be performed. Additionally, the model will take into account T2 signal as well as field anisotropy associated with benign tissue.
Acknowledgements
GE Healthcare Research Grant
Krueger v. Wyeth Research Award
RSNA Research Resident Award
References
1. Kuhl CK, Schrading S, Leutner CC, et al. Mammography, Breast Ultrasound, and Magnetic Resonance Imaging for Surveillance of Women at High Familial Risk for Breast Cancer. J Clin Oncol. 2005;23(33):8469-8476. doi:10.1200/JCO.2004.00.4960
2. Kriege M, Brekelmans CTM, Boetes C, et al. Efficacy of MRI and mammography for breast-cancer screening in women with a familial or genetic predisposition. N Engl J Med. 2004;351(5):427-437. doi:10.1056/NEJMoa031759
3. Partridge SC, Nissan N, Rahbar H, Kitsch AE, Sigmund EE. Diffusion-weighted breast MRI: Clinical applications and emerging techniques: Diffusion-Weighted Breast MRI. J Magn Reson Imaging. 2017;45(2):337-355. doi:10.1002/jmri.25479
4. Klauß M, Maier-Hein K, Tjaden C, Hackert T, Grenacher L, Stieltjes B. IVIM DW-MRI of autoimmune pancreatitis: therapy monitoring and differentiation from pancreatic cancer. Eur Radiol. 2016;26(7):2099-2106. doi:10.1007/s00330-015-4041-4
5. Granata V, Fusco R, Reginelli A, et al. Diffusion kurtosis imaging in patients with locally advanced rectal cancer: current status and future perspectives. J Int Med Res. 2019;47(6):2351-2360. doi:10.1177/0300060519827168
6. White NS, McDonald CR, Farid N, et al. Diffusion-Weighted Imaging in Cancer: Physical Foundations and Applications of Restriction Spectrum Imaging. Cancer Res. 2014;74(17):4638-4652. doi:10.1158/0008-5472.CAN-13-3534
7. Rodríguez-Soto AE, Andreassen MMS, Conlin CC, et al. Characterization of the Diffusion Signal of Breast Tissues Using Multi-Exponential Models. Radiology and Imaging; 2020. doi:10.1101/2020.04.27.20082271
8. Andreassen MMS, Rodríguez-Soto AE, Conlin CC, et al. Discrimination of Breast Cancer from Healthy Breast Tissue Using a Three-component Diffusion-weighted MRI Model. Clin Cancer Res. 2021;27(4):1094-1104. doi:10.1158/1078-0432.CCR-20-2017
9. Holland D, Kuperman JM, Dale AM. Efficient correction of inhomogeneous static magnetic field-induced distortion in Echo Planar Imaging. NeuroImage. 2010;50(1):175-183. doi:10.1016/j.neuroimage.2009.11.044
10. Liu L, Yin B, Shek K, et al. Role of quantitative analysis of T2 relaxation time in differentiating benign from malignant breast lesions. J Int Med Res. 2018;46(5):1928-1935. doi:10.1177/0300060517721071
Figures