1678
Improving measures of cerebrovascular reactivity using a sinusoidal hypercapnic challenge and dual-echo pseudocontinuous ASL1School of Life Sciences, University of Nottingham, Nottingham, United Kingdom, 2The School of Life Sciences, University of Nottingham, Nottingham, United Kingdom
Synopsis
New clinical tools are needed for the diagnosis and prognosis of cerebrovascular diseases. Cerebrovascular Reactivity (CVR) is a potential marker for brain health and can be induced using stressors to the brain like high carbon dioxide (hypercapnia) challenges. These challenges can be used to map CVR. Dual-echo pseudocontinuous Arterial Spin Labelling (pCASL) and Blood Oxygen Level Dependent (BOLD) weighted imaging was combined with sinusoidally modulated and conventional block hypercapnic challenges to map CVR. Preliminary results show qualtitative improvements to pCASL based CVR maps when using sinusoidal hypercapnic challenges compared with the conventional block.
BACKGROUND
Problem: Earlier prognosis and diagnosis of vascular disease in the brain (i.e. cerebrovascular diseases[1]) is needed.Solution: Non-invasive brain imaging such as pseudocontinuous Arterial Spin Labelling (pCASL)[2] is able to quantify tissue cerebral blood flow (CBF) and subsequently cerebrovascular reactivity (CVR), a measure of brain health and a potential clinical marker[3]. Dual-echo (DE) allows pCASL CBF and blood oxygenated level dependent (BOLD) weighted images to be acquired simultaneously. The signal to noise ratio (SNR) of BOLD is better than pCASL, but is inherently qualitative. In contrast, pCASL is a direct measure of CBF and provides quantitative CVR maps, but is limited by the reduction in labelling efficiency during a hypercapnic (high CO2) challenge[4]. In this study, a pCASL preparation shown to be more robust to changes in labelling efficiency was used to maximise pCASL SNR[6].
This study used two sinusoidal hypercapnic challenges and a conventional block hypercapnic challenge. The sinusoidal paradigm provides a more natural and comfortable fluctuation in CO2 above baseline than the block stimulus. However, due to short time periods the analysis must consider regional delays in CVR. Fortunately, modelling the signal response as a sine/cosine pair, i.e. a sinusoid at the stimulus frequency with arbitrary phase, resolves this issue[5].
This study aimed to investigate the effect of using a sinusoidal hypercapnic challenge on CVR measurements using DE-pCASL, and provides further proof of concept for using a sinusoidal stimuli in hypercapnic challenges.
METHODS
Subjects: Written informed consent was obtained from healthy volunteers (N=3 males, aged 27±2 years) following local ethics committee approval.Respiratory Challenges: A block hypercapnic challenge (blockDE, Fig1.a) and two sinusoidal hypercapnic challenges (sinDE60 and sinDE120, Fig. 1b&c) were delivered using a prospective end-tidal targeting system[7] (RespirAct Gen 3TM, Thornhill Medical, Toronto, Canada) to target the end-tidal partial pressure of CO2 (PETCO2)[8].
Imaging: Subjects were scanned using a 3T Ingenia scanner (Philips Healthcare, Best, Netherlands) using the vendors 32-channel receive coil. DE-pCASL data were acquired (FOV=240mm2, 64x62 matrix, twenty 5mm slices, 1mm gap, TR =4.5s, TE1/2 =13ms/35ms, BW=2665Hz/px, PLD=1800ms label duration=1500ms). Background suppression was used to maximise pCASL SNR.
Analysis: Pre-processing consisted of motion correction, spatial smoothing (σ=2mm) and high-pass temporal filtering[9]. Surround subtraction or averaging was performed for the first (pCASL) and second (BOLD) echoes[10], respectively. General Linear Model analysis was performed in MATLAB (Mathworks, Natick, MA) for the three different stimuli; a boxcar (blockDE) and a sine/cosine pair with time periods of 60s (sinDE60) or 120s (sinDE120). All three had a constant term for baseline CBF/BOLD. The response to the sinusoidal stimuli was calculated as the root mean square of the parameter estimates of the sine/cosine pair[5]. CVR was calculated as the change in CBF/BOLD normalised by the baseline to give the percentage change in CBF/BOLD. Median values of CVR were extracted from cortical grey matter ROIs generated by segmenting a T1-weighted structural[9].
RESULTS
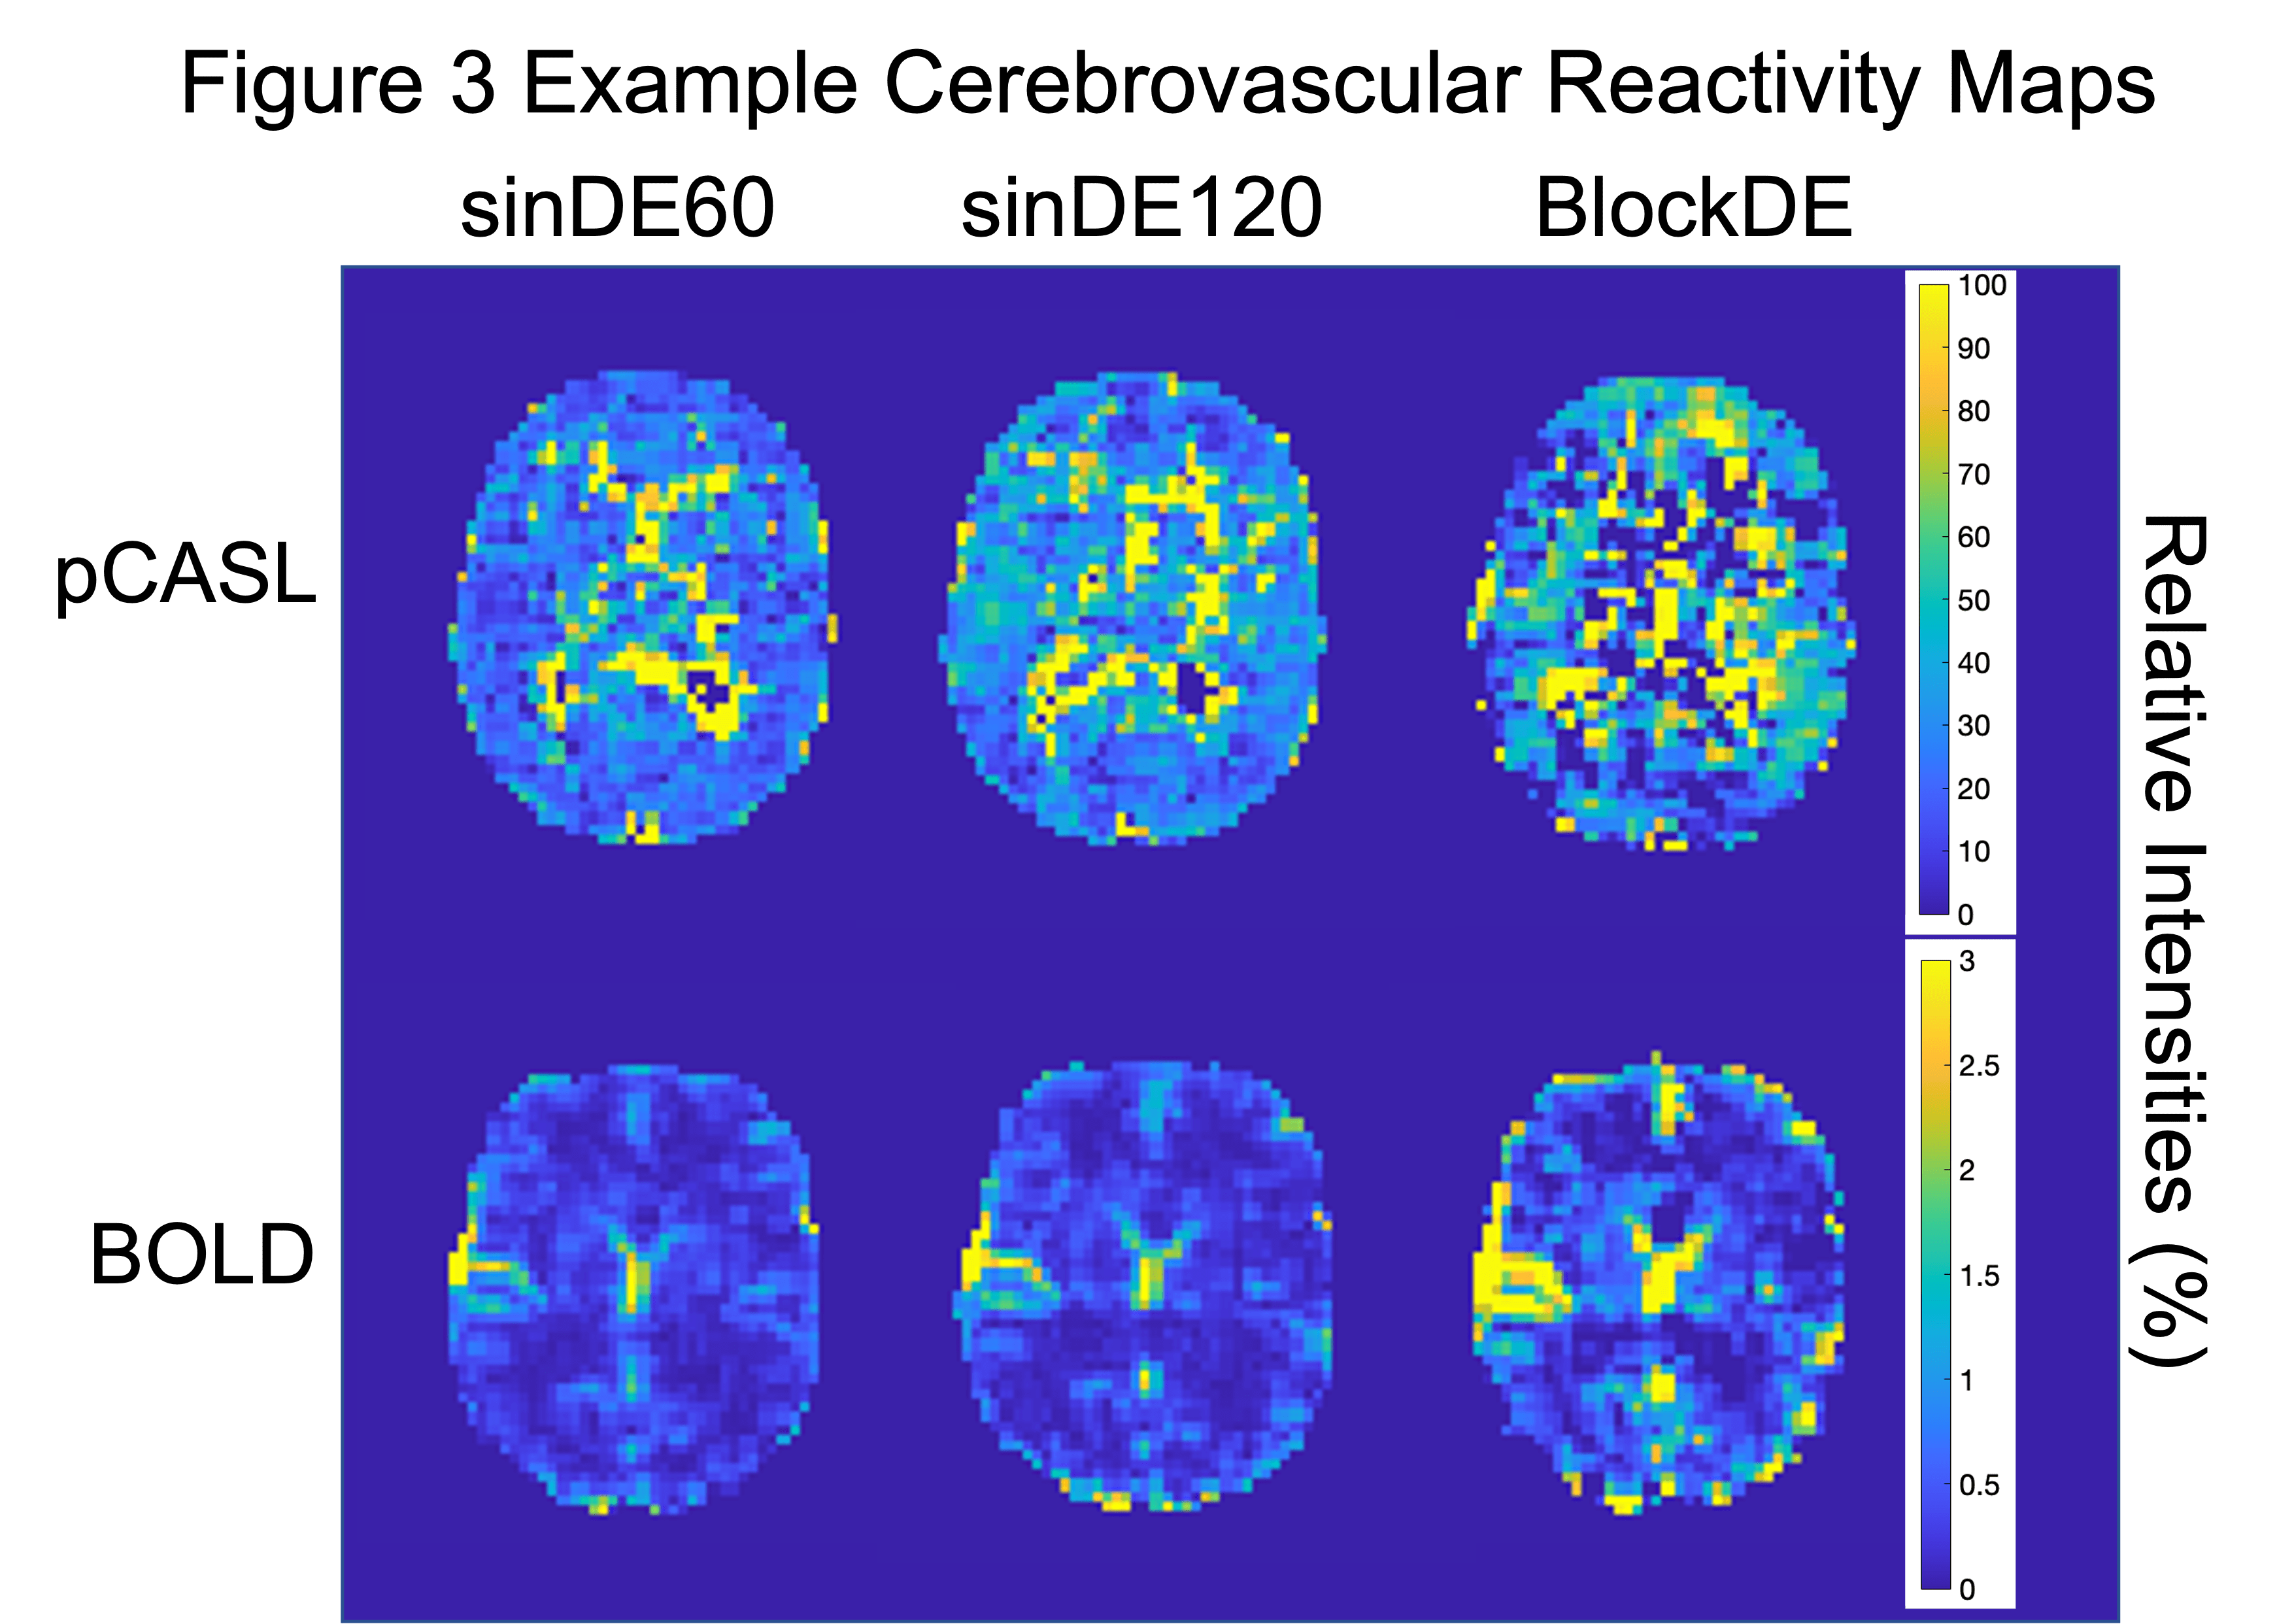
Respiratory Challenges: Figure 2 shows the group average respiratory response to the three hypercapnic challenges. Across all challenges there was an average change in CO2 from normocapnia (normal baseline CO2) to hypercapnia (sinDE60=6.6±1.0mmHg, sinDE120=6.8±0.5mmHg, blockDE=6.9±1.2mmHg, mean±standard deviation).Imaging: Figure 3 shows example CVR maps for one subject for each of the hypercapnic challenges for both pCASL and BOLD data. Large draining veins do not appear in the pCASL CVR maps leading to greater conspicuity of tissue CVR compared to the BOLD CVR maps.
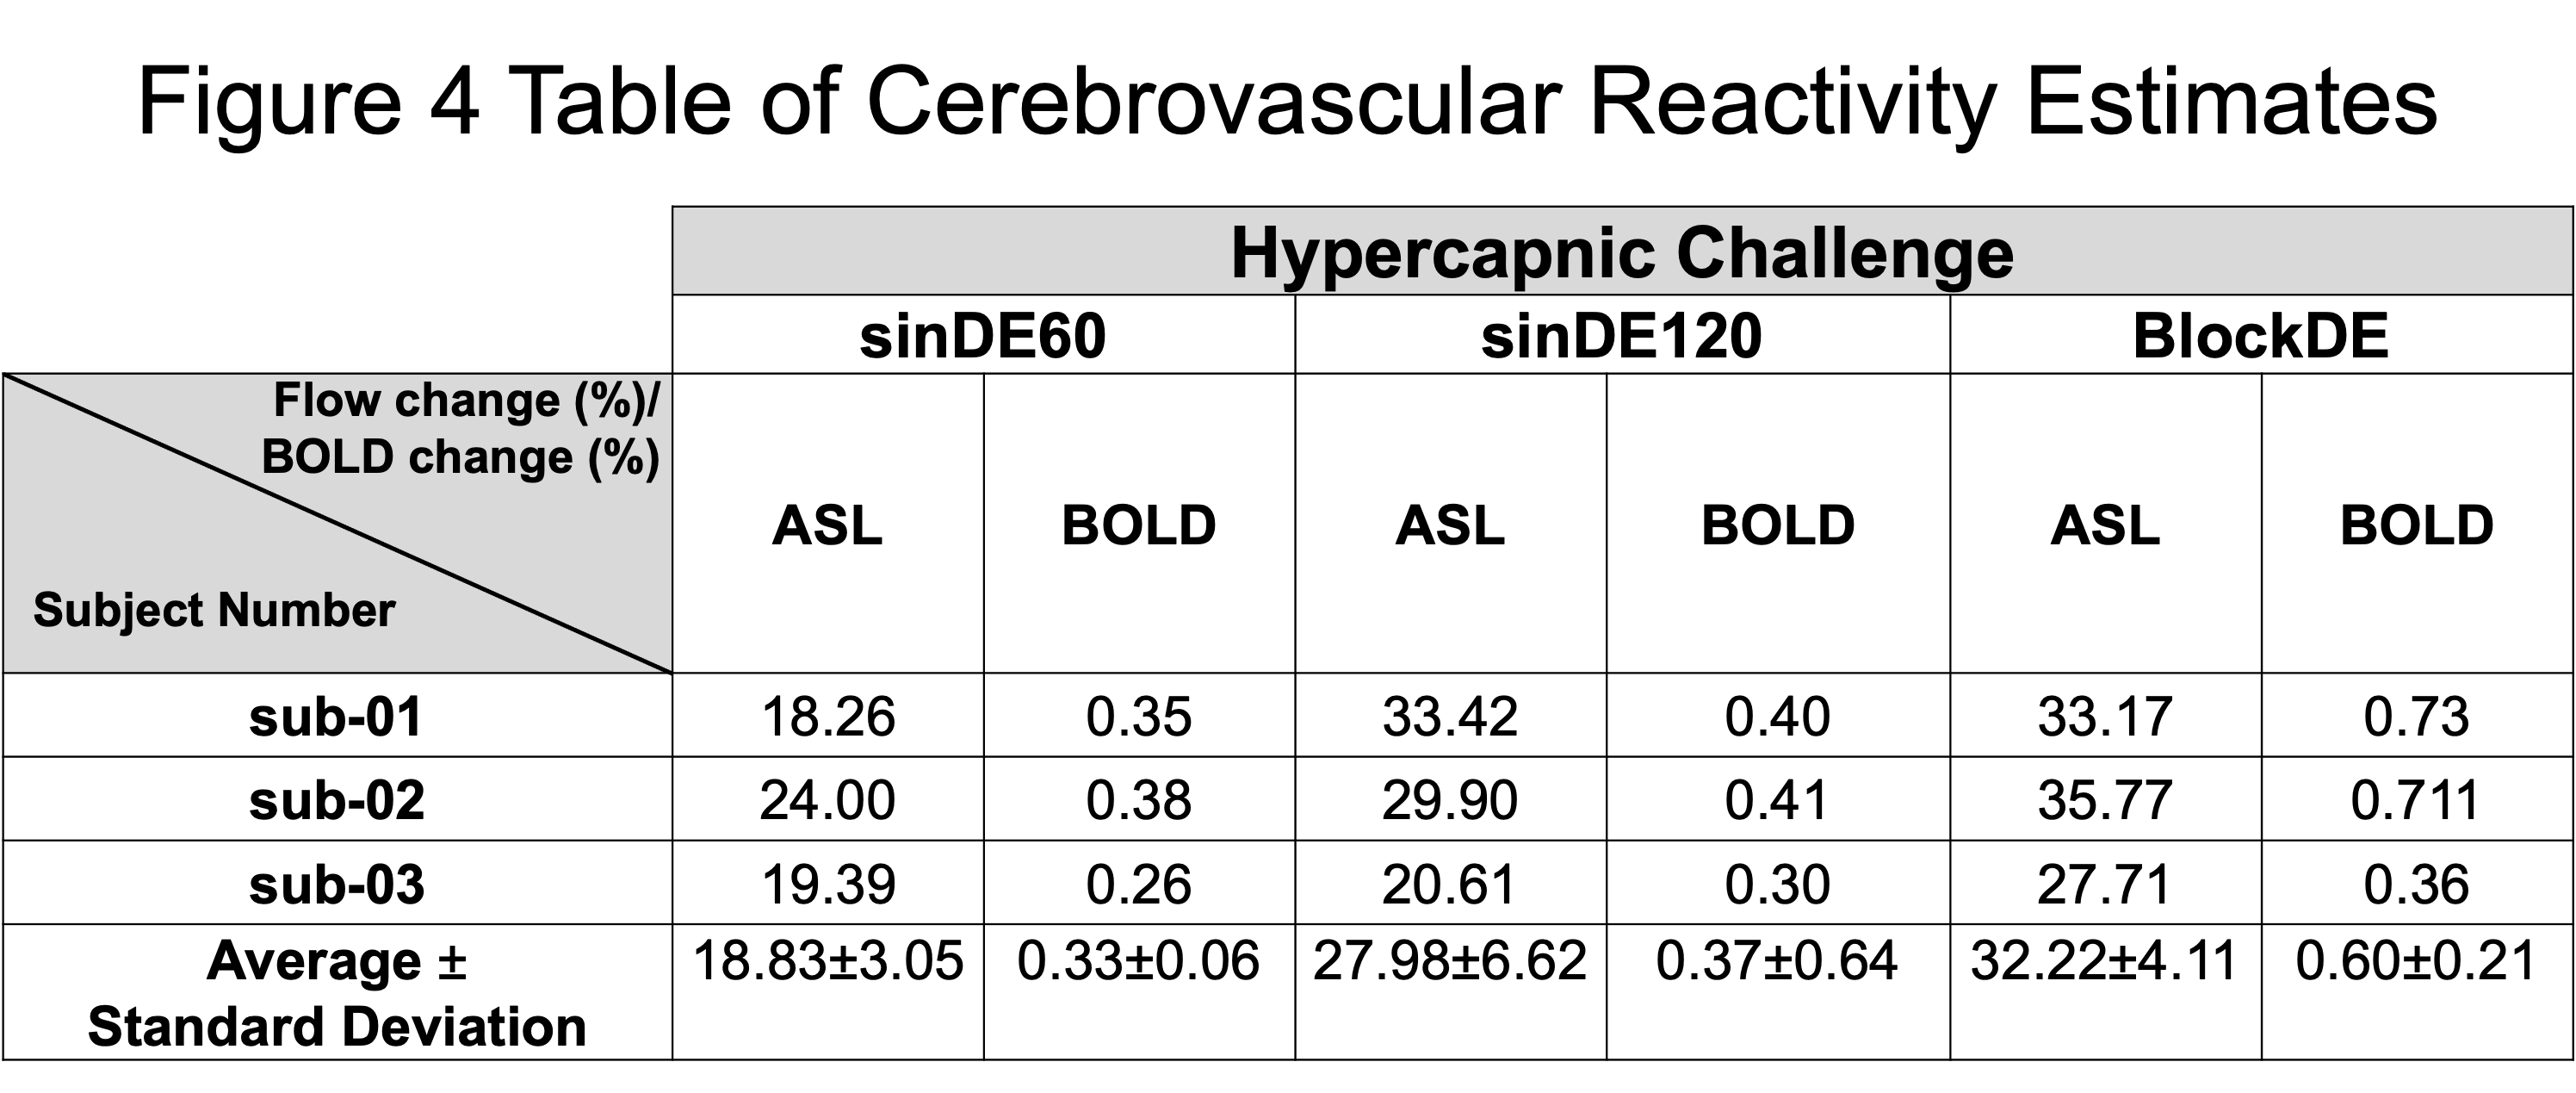
Figure 4 shows the quantified percentage flow change and the percentage BOLD signal change for each of the three hypercapnic challenges. As expected, these showed a change in CVR in the grey matter for all three hypercapnic challenges for both pCASL and BOLD. White matter regions showed low reactivity in BOLD CVR maps, but high reactivity in pCASL CVR maps. Percentage signal changes in grey matter were larger for pCASL CVR maps (sinDE60=18.8±3.1%, sinDE120=28.0±6.6%, blockDE=32.2±4.1%,(mean±Standard Deviation)), compared to the BOLD CVR maps (sinDE60=0.33±0.06%, sinDE120=0.37±0.64%, blockDE=0.60±0.21%), which are a qualitative measure of CBF change. This reflected the expected physiological change.
DISCUSSION
Experiments were performed to determine if a sinusoidal hypercapnia stimulus was suitable for mapping CVR using pCASL. Using DE-pCASL made it possible to simultaneously map CVR using BOLD. Additionally, comparisons were made to a conventional block challenge.Sinusoidal pCASL CVR maps appeared qualitatively improved compared to the conventional block challenge. In contrast, BOLD responses were weaker than previously reported and this may be a consequence of using background suppression. However, it has previously been suggested that this effect should be minimal[11]. Further work is required to understand this phenomenon.
Measurements of CVR appeared to vary moderately depending on the hypercapnic challenge. However, more datasets will be needed to increase the power of the statistical results before performing statistical tests. This is important as the vasculature may not have had sufficient time to respond to the higher frequency (sinDE60) hypercapnic stimulus.
Further work is required to investigate the measurement of regional delays in the CVR response seen when using the sinusoidal stimulus[5], and to estimate the errors associated with the amplitude and delay of the CVR response. The latter will be particularly useful for investigating the pCASL CVR response in white matter.
Acknowledgements
The authors would like to acknowledge the funding for this study from the Biotechnology and Biosciences Research Council (BBSRC). Authors would also like to thank the volunteers who participated in this study.
References
1. Stroke Association (2020). Stroke Association. [online] Available at: <https://www.stroke.org.uk/> [Accessed 2 June 2020].
2. Aslop, D.C., Detre, J. A., Golay, X., Günther, M, Hendrikse, J., Hernandez-Garcia, L., Lu, H., MacIntosh, B. J., Parkes, L. M., Smits, M., van Osch, M. J. P., Wang, D. J. J., Wong, E. C., Zaharchuk, G. (2015). 'Recommended implementation of arterial spin-labeled perfusion MRI for clinical applications: A consensus of the ISMRM perfusion study group and the European consortium for ASL in dementia', Magn. Reson. Med. 73(1), 102-106.
3. Dai, W., Garcia, D., de Bazelaire, C. and Alsop, D. (2008). 'Continuous flow-driven inversion for arterial spin labeling using pulsed radio frequency and gradient fields', Magn. Reson. Med. 60(6), pp.1488-1497.
4. Aslan, S., Xu, F., Wang, P. L., Uh, J., Yezhuvath, U. S., van Osch, M., Lu, H. (2010). ‘Estimation of labeling efficiency in pseudocontinuous arterial spin labeling’, Magn. Reson. Med. 63(3), 765–771.
5. Blockley N. P., Harkin J. W. & Bultec D. P. (2017). 'Rapid cerebrovascular reactivity mapping: Enabling vascular reactivity information to be routinely acquired', NeuroImage. 159: 214-223.6
6. Milbourn, C. C., Okell, T. W., Blockley, N. P. 'Moving Towards Robust Quantification of Cerebrovascular Reactivity (CVR) using Pseudocontinuous Arterial Spin Labelling (pCASL)', Proc. ISMRM #2744 (2021)
7. Slessarev M., Han J., Mardimae A., Prisman E., Preiss D., Volgyesi G., Ansel C., Duffin J., Fisher J.A. (2007). 'Prospective targeting and control of end-tidal CO2 and O2 concentrations', The Journal of Physiology. 581:1207–1219. doi: 10.1113/jphysiol.2007.129395.
8. Blockley, N.P., Driver, I.D., Francis, S.T., Fisher, J.A., Gowland, P.A., (2011). 'An improved method for acquiring cerebrovascular reactivity maps', Magn. Reson. Med. 65, 1278–1286.
9. Jenkinson, M., Beckmann, C. F., Behrens, T. E. J., Woolrich, M. W. & Smith, S. M. (2012) 'FSL', Neuroimage. 62, 782–790.
10. Liu, T. T. & Wong, E. C. (2005). 'A signal processing model for arterial spin labeling functional MRI', Neuroimage. 24, 207–215.
11. Ghariq, E., Chappell, M., Schmid, S., Teeuwisse, W. and van Osch, M., (2014). 'Effects of background suppression on the sensitivity of dual-echo arterial spin labeling MRI for BOLD and CBF signal changes', NeuroImage. 103, pp.316-322.
Figures
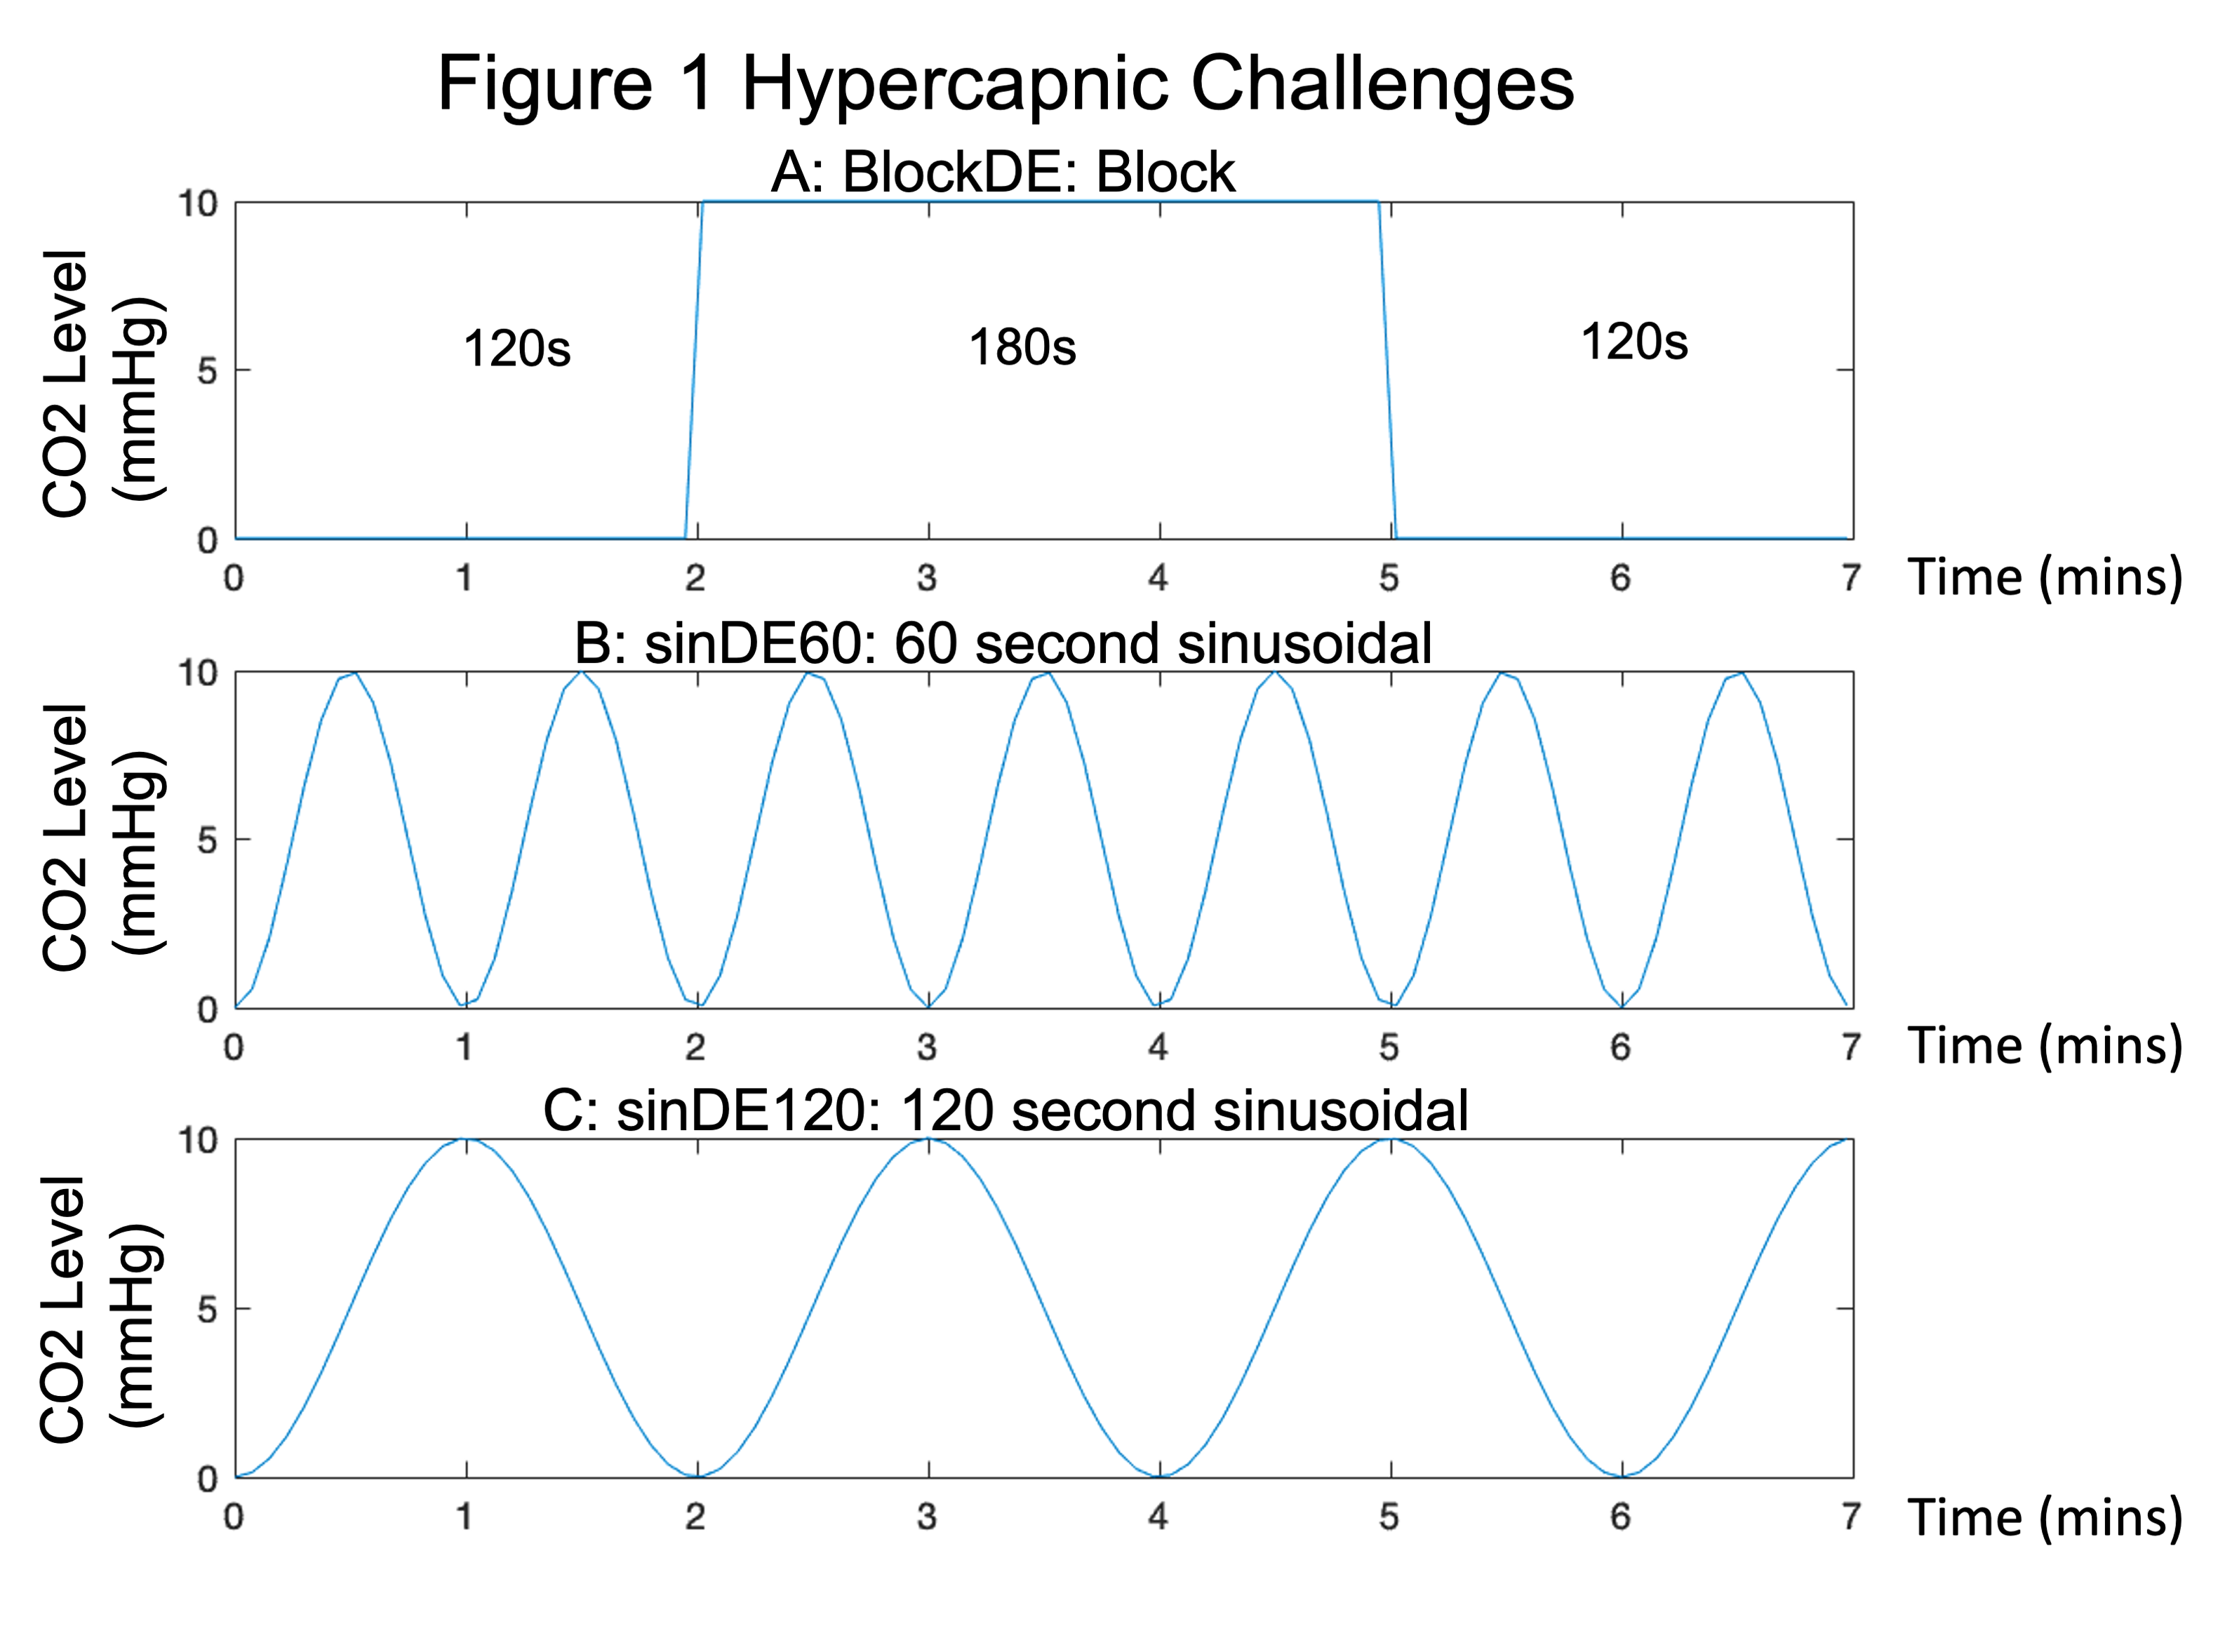
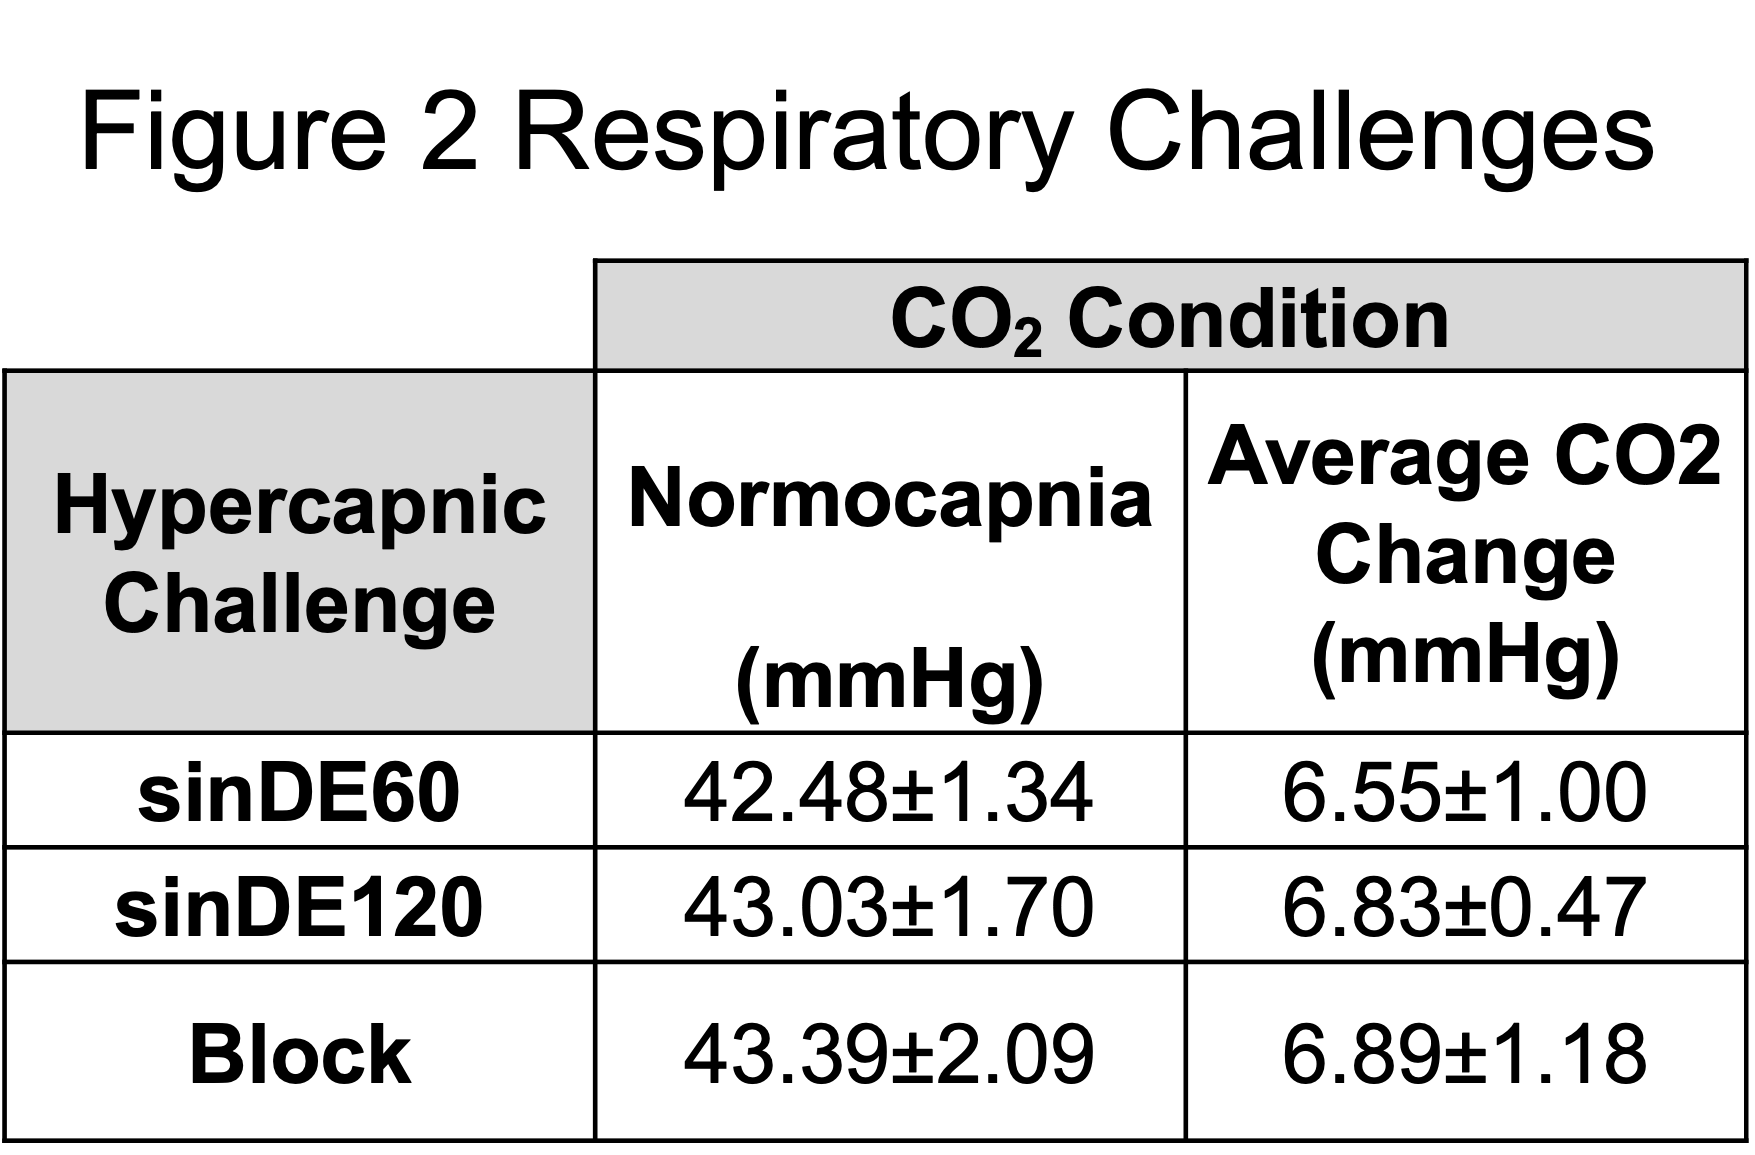
Table of group mean values of CO2 (carbon dioxide) levels during hypercapnic challenges and the average change in CO2 from normocapnia (normal baseline CO2) to hypercapnia conditions (Mean±Standard Deviation). mmHg (millilitres of mercury).